适用于MetaTrader 5的技术指标 - 5
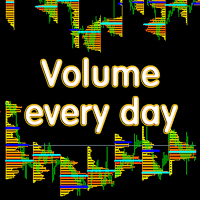
Основные отличия и преимущества индикатора Volume every day от похожего продукта Volume Profile V6 В Volume every day можно параметром Range period задать временной диапазон построения профиля, а параметром Range count задать количество профилей данных диапазонов. Например, на втором скрине Range period=1Day, а Range count=10 - это значит, что профиль будет строиться на периоде один день, десять последних дней. Важно, что переключение тайм фрейма графика не влияет на построение профиля, что т

KT Custom High Low shows the most recent highs/lows by fetching the data points from multi-timeframes and then projecting them on a single chart. If two or more highs/lows are found at the same price, they are merged into a single level to declutter the charts.
Features
It is built with a sorting algorithm that declutters the charts by merging the duplicate values into a single value. Get Highs/Lows from multiple timeframes on a single chart without any fuss. Provide alerts when the current pri

This indicator obeys the popular maxim that: "THE TREND IS YOUR FRIEND" It paints a GREEN line for BUY and also paints a RED line for SELL. (you can change the colors). It gives alarms and alerts of all kinds. IT DOES NOT REPAINT and can be used for all currency pairs and timeframes. Yes, as easy and simple as that. Even a newbie can use it to make great and reliable trades. NB: For best results, get my other premium indicators for more powerful and reliable signals. Get them here: https://www.m
FREE

任何新手或专家交易者的最佳解决方案!
这个指标是一个独特的、高质量的、可负担得起的交易工具,因为我们纳入了一些专有的功能和一个新的公式。只需一个图表,你就可以读出28个外汇对的货币强度!想象一下,你的交易将如何得到改善,因为你的交易是在你的手中进行的。想象一下,你的交易将如何改善,因为你能够准确地确定新趋势或剥头皮机会的触发点?
用户手册:点击这里 https://www.mql5.com/en/blogs/post/697384
这是第一本,原版的! 不要买一个毫无价值的崇拜者的克隆品。
特别的 子窗口中的箭头显示强劲的货币势头GAP将指导你的交易! 当基础货币或报价货币处于超卖/超买区域(外盘斐波那契水平)时,在个人图表的主窗口中出现警告信号。 当货币力量从外围区间回落时,回撤/反转警报。 十字星模式的特别警报
可选择多个时间框架,以快速查看趋势! 货币强度线在所有的时间框架中都非常平稳,当使用较高的时间框架来识别总体趋势,然后使用较短的时间框架来确定精确的入口时,效果非常好。你可以根据自己的意愿选择任何时间框架。每个时间框架都由其自身进行了优化。
建立在新的基础算法
The SyntheticaFX Pain & Gain Spike Indicator is a specialized tool designed to identify potential spike opportunities in the market, exclusively for traders focusing on Weltrade Pain and Gain pairs. This indicator is optimized to operate on the 1-minute (M1), 2-minute (M2), 3-minute (M3), and 5-minute (M5) timeframes and supports only the following pairs: PainX 1200, PainX 999, PainX 800, PainX 600, PainX 400, GainX 1200, GainX 999, GainX 800, GainX 600, and GainX 400. It will not display signal

功能
斐波那契回调交易指标 根据之前选择的1小时、4小时、1天和1周中的某个时间段绘制斐波那契图表。 当市场价格触及斐波那契水平时,颜色会变化,并显示触摸时间。 斐波那契图在-23.6、0、23.6、38.2、50、61.8、76.4、100和123.6水平绘制,当柱更新时,图表会刷新。
变量
时间框架:根据选择的1小时、4小时、1天和1周时间框架绘制斐波那契图表。 FiboWidth:确定水平线的粗细。 FiboStyle:设置枢轴水平线的样式。 TouchedColor:触摸时变化的颜色。
如果您发现任何错误或希望看到改进,请发表评论。 评价对开发者非常有帮助。如果您满意,请给我们5星评价。
-----------------------
FREE

N/B: All our product purchase comes with our free ‘’DAILY SCALPER EA’’ - bit.ly/4qlFLNh Whatsapp Developer for yours after successful purchase SUPREME PRECISION TRADER SCANNER
Your All-in-One Market Scanner for High-Probability Trades Across All Timeframes (M5–H4)
---
WHY THIS SCANNER IS A GAME-CHANGER
Most traders spend hours analyzing charts, hunting for setups, and still miss high-probability trades.
The Supreme Precision Trader Scanner does all the heavy lifting for you — scann
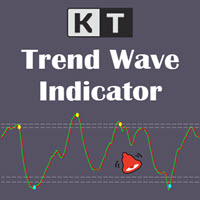
KT Trend Wave is an oscillator based on the combination of Price, Exponential, and Simple moving averages. It usually works great to catch the short term price reversals during the ongoing trending market. The bullish and bearish crossovers of the main and signal lines can be used as buy/sell signals (blue and yellow dot). It can also be used to find the overbought and oversold market. The buy and sell signals that appear within the overbought and oversold region are usually stronger.
Features

KT CCI Divergence shows the regular and hidden divergence created between the price and CCI oscillator. Divergence is one of the vital signals that depicts the upcoming price reversal in the market. Manually spotting the divergence between price and CCI can be a hectic and ambiguous task.
Limitations of KT CCI Divergence
Using the CCI divergence as a standalone entry signal can be risky. Every divergence can't be interpreted as a strong reversal signal. For better results, try to combine it w
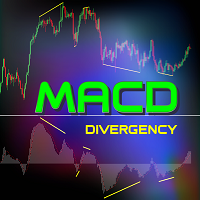
该指标准确地识别出价格走势与MACD柱状图之间的牛市和熊市背离,使用的指数移动平均线(EMA)周期为5(快速),34(慢速),信号线周期为5。该指标突出显示了动能减弱的点,提示可能的趋势反转。 正确识别背离的规则: 当价格形成更低的低点,而MACD柱状图同时在零线之上形成更高的低点时,牛市背离有效。 当价格形成更高的高点,而MACD柱状图同时在零线以下形成更低的高点时,熊市背离有效。 如果柱状图的极值和价格的极值没有位于零线的同一侧,则背离信号无效,因为这可能导致假信号。 这种方法代表了应用MACD背离分析最准确和可靠的方法。 指标特点: 清晰地标记已确认的牛市和熊市背离。 严格遵守MACD背离验证规则,提高可靠性。 其他信息:该指标作为MetaTrader 5的EX5编译文件提供。它不需要外部库或DLL文件。建议交易者将此工具与整体交易策略一起使用。在进行真实交易前,请务必在模拟账户中充分测试。该指标不保证盈利,仅作为帮助识别真实MACD背离的分析工具。
FREE

Also check my premium spikes bot: https://www.mql5.com/en/market/product/142350 Also check my premium spikes bot: https://www.mql5.com/en/market/product/142350 Also check my premium spikes bot: https://www.mql5.com/en/market/product/142350 MEGASPIKES BOOM AND CRASH v1.32 NB: source codes of this indicator are available: PM me: https://t.me/Machofx PLEASE JOIN THE CHANNEL BELOW TO HAVE ACCESS TO ALL PREVIOUS VERSIONS check out Spikes robot
BoomCrash Cheatcode EA : https://www.mql5.com/en/ma
FREE

40% off. Original price: $50
Advanced Bollinger Bands Scanner is a multi symbol multi timeframe Bollinger bands dashboard that monitors and analyzes the Bollinger Bands indicator from one chart. This panel scans the Bollinger bands indicator in up to 28 configurable instruments and 9 timeframes for price overbought/oversold, price consolidation (Bollinger bands squeeze), and consolidation breakout (squeeze break) with a deep scan feature to scan all market watch symbols (up to 1000 instrument

The Oracle是需要精准市场分析而无需管理多个指标的交易者的完美伴侣。
大多数指标只显示单一视角的信号,而The Oracle将经过科学验证的方法与专有增强功能融合到一个共识直方图中。 七个模型,包括我们的Ultimate Flow Index(UFI)配合Ehlers平滑算法,在每根K线上独立投票。
当足够多的模型达成一致——根据您设置的从4/7激进到7/7保守的阈值——方向就变得清晰。
主要功能
七模型共识系统 - 经验证的指标与专有模型的组合 - 包含具有高级平滑功能的UFI(Ultimate Flow Index) - 预优化参数(无需配置)
可配置警报阈值 - 4/7模型:激进(早期信号,噪音较多) - 5/7模型:标准(平衡) - 6/7模型:推荐(最佳信噪比) - 7/7模型:保守(稀少,仅高确信度)
信号持续模式 - Persisted模式:信号保持直到强烈反向信号 - Hybrid模式:稳定性与响应性之间的平衡 - 防重绘逻辑(信号在K线收盘时确定)
多时间框架就绪 - 在同一图表上叠加2-3个实例 - 每个分析不同时间框架(当前/M5/M15
FREE

ATR Progress Control
Trading is all about probability, and if you don't know how much range the price has left today, you're trading blind.
This indicator is your dashboard that answers the most important question before a trade: does it make mathematical sense to enter the market right now? It's a tool for professional volatility analysis that helps filter out false entries and avoid trades when the move is already exhausted.
What's the problem?
Imagine that the average daily movement (ATR

Advanced ideas of the popular MACD indicator: It detects and displays classic and reverse divergences (two methods of detecting divergences). It uses different color to highlight an uptrend and a downtrend. Two methods of determining a trend: а) MACD crosses the 0 level (classic signal); б) MACD crosses its own average (early signal). This is a multi-timeframe indicator: it can display MACD data from other timeframes. Two methods of drawing: classic histogram and line. It generates sound and vis

Auto Fibo 是一个为加强你的手动交易而开发的指标。它将自动画出黄金比例,节省你的时间,促进你的交易。 将指标附在图表上,它就会自动画出准确的黄金比例,省去你寻找临界点的麻烦。 界面会根据你的电脑调整到波段的近似高点和低点。 这个指标会纠正大多数起点和终点的选择错误。 对于每个波段,都会显示准确的价格。 警告 我只在MQL5.com上出售我的EA。如果有人与您联系,向您出售我的EA,那么他们是骗子,只想要您的钱。
另外,如果您从外部网站购买我的EA,我向您保证,它们将是假的版本,不会和原来的一样工作。 .....................................................
FREE

VM Trend Candles Indicator - Complete Trend Trading Solution Trend Candles Indicator is a professional, intuitive, and easy-to-use Forex trading system designed to transform complex trend analysis into clear, high-probability trading signals. Based on proven trend-following principles and enhanced with intelligent market filtering, the indicator provides accurate BUY/SELL signals together with automatically calculated Stop Loss and Take Profit levels according to market volatility. The system su

相对强弱指数 (RSI) 指标的多货币和多时间框架修改。 您可以在参数中指定任何所需的货币和时间范围。 此外,该面板还可以在跨越超买和超卖水平时发送通知。 通过单击带有句点的单元格,将打开该符号和句点。 这是 MTF 扫描仪。
默认情况下,从图表中隐藏仪表板的键是“D”.
与货币强度计类似,仪表板可以自动选择包含指定货币的货币对,或以该货币为基础货币的货币对。该指标在“货币对集合”中指定的所有货币对中搜索货币;其他货币对将被忽略。并根据这些货币对计算该货币的总 RSI。您可以看到该货币的强弱程度.
参数 RSI Period — 平均周期。 RSI Applied price — 价格类型。 Clear the chart at startup — 启动时清除图表 Set of Pairs — 符号集 — Market Watch — 来自 MT 的“市场观察”的货币对。 — Specified manually — 在参数“Pairs”中手动指定对。 — Current pair — 仅显示当前对。 Pairs (separated by a space or semic

Real Trend Zigzag PRO shows the real trend of a market, u nlike the default Zigzag indicator. It calculates the trend in real time and shows green lines for upwards trends, red lines for downward trends and blue lines for no trends. Regarding the old slogan "the trend is your friend" it helps you to decide if should open a buy or sell position. The PRO version is a multi timeframe zigzag (MTF). Means, it shows the trend of the current timeframe as well as the trend of a higher or lower time.

CRUDE OIL BUY/SELL (3 Min) Technical Overview The CRUDE OIL BUY/SELL indicator is designed for short-term traders focusing on crude oil price movements.
It identifies high-probability buying and selling opportunities based on a combination of RSI levels , SMA trend positioning , and candle structure analysis .
This tool is particularly effective on the 3-minute timeframe , providing clear visual signals and alerts for both momentum continuation and potential reversals. How It Works The indicator

The Golden PainX and GainX Spike Indicator is a cutting-edge, AI-powered trading tool engineered exclusively for the synthetic indices market. It masterfully combines proprietary spike detection algorithms and real-time price action analysis to generate high-probability, non-repainting trade signals with exceptional accuracy. Important( Use only on PainX 400and GainX 400 (M1 one minute timeframe) Identifies high-probability spikes with non-repainting buy/sell arrows. Automatically sets profit t

INDICATOR: GEN TriFactaX Developer: gedeegi General Description GEN TriFactaX is a technical indicator designed to automatically identify and visualize the 1-2-3 Pattern or price reversal pattern. This pattern is a classic price action formation frequently used by traders to detect potential trend reversals. This indicator not only displays the 1-2-3 pattern on the chart but also automatically identifies the breakout signal from the critical level (point 2) and projects Entry, Stop Loss (SL), a

FREE Heiken Ashi Smoothed indicator is fully adjustable, easy to use and comes with possibility to access the indicator via iCustom function so you can use it in your own trading software. Indicator can also pop up alerts when signal changes or send push notifications. For Metatrader 4 version click here: https://www.mql5.com/en/market/product/70824 For detailed information click: >>HERE<< Features
Easy to use Accessible via iCustom Fully adjustable Alerts and Push notifications Possib
FREE

您是否厌倦了在图表上手动绘制斐波那契水平?您是否正在寻找一种方便有效的方法来确定交易中的关键支撑位和阻力位?别再犹豫了! 隆重推出 DrawFib Pro,这是一款可自动执行 ibonacci 水平的 终极 MetaTrader 5 指标 在图表上绘制,并在突破这些水平时及时发出警报。借助 DrawFib Pro,您可以增强交易策略、节省时间并做出更明智的决策。 我的基于斐波那契的指标: Advanced Gartley Pattern MT5 || Price Wave Pattern MT5 主要特征:
自动 斐波那契绘图 . 可定制的 参数 . 准确 可靠. 实时 警报. 用户 友好的 界面 . 对于任何寻求高效、可靠且用户友好的方式在图表上自动绘制斐波那契的交易者来说,DrawFib Pro 是必备工具。 DrawFib Pro 能够提供实时警报并支持各种时间范围,使交易者能够做出更准确、更及时的决策。节省宝贵的时间和精力,同时提高您的交易绩效。立即使用 DrawFib Pro 释放自动斐波那契分析的力量!
FREE
Indicator Description Range Filter Pro is a sophisticated trading tool for XAUUSD (Gold) that combines adaptive price filtering with volume analysis and real-time market monitoring. Designed for both novice and professional traders, this indicator helps identify trend direction, potential reversals, and significant market movements through its multi-layered approach.
Key Components 1.Dynamic Range Filter 2.Volatility-Adjusted Bands 3.Volume-Enhanced Candles 4.Professional Trading Dashboard 5.M
FREE

This indicator shows Fractal Breakout Trendlines and Support and Resistance
The Fractal Ascending Trendline and Fractal Descending Trendline are drawn from the last valid fractals. Breakouts can be taken above or below these trendlines. Horizontal lines are drawn from the Last upper and Last lower fractal to show support and resistance levels. Horizontal Upper and Lower Intersection lines are drawn where a fractal trendline has been last intersected, to show where to place a buy or sell order
FREE

Step into the world of Forex trading with confidence, clarity, and precision using Gold Indicator a next-generation tool engineered to take your trading performance to the next level. Whether you’re a seasoned professional or just beginning your journey in the currency markets, Gold Indicator equips you with powerful insights and help you trade smarter, not harder. Built on the proven synergy of three advanced indicators, Gold Indicator focuses exclusively on medium and long-term trends elimina

该指标找到AB = CD回撤形态。 AB = CD回调模式是一种4点价格结构,其中初始价格区间被部分回调,然后与回调完成后等距移动,这是所有谐波模式的基本基础。 [ 安装指南 | 更新指南 | 故障排除 | 常见问题 | 所有产品 ]
可定制的图案尺寸
可定制的AC和BD比率 可定制的突破时间 可定制的线条,颜色和大小 它根据CD纤维水平显示SL和TP水平 视觉/声音/推送/邮件警报,用于模式和突破
AB = CD Retracements可以扩展和重新绘制很多内容。为了使事情变得更容易,该指标实施了一个转折:它在向交易发出信号之前等待正确方向的Donchian突破。最终结果是带有非常可靠的交易信号的重新粉刷指示器。输入donchian突破时段作为输入。
看涨回撤是蓝色的 空头回撤是红色的
请注意,价格模式(例如AB = CD)可以扩展,指标必须重新绘制以跟随该模式的扩展。如果图案重涂超出了参数中输入的AC / BD / AB = CD比率,则该图案将消失,因为它将不再有效。要交易这些模式,请求助于donchian突破信号。
输入参数
幅度:AB = CD模式的大小 突围

Advanced SMC & Volumetric Order Block Indicator Overview
This enhanced-grade for MetaTrader 5 indicator is designed to decode market behavior using Smart Money Concepts (SMC) method . It goes beyond standard price action analysis by integrating Volumetric Data directly into market structure, helping traders identify high-probability reversal and continuation zones with precision. Key Features Volumetric Order Blocks: A unique, split-gauge visualization within Order Block zones that disp
FREE
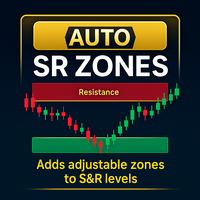
支持/阻力区 - MetaTrader 5 产品概览 概览 支持/阻力区 是一个为 MetaTrader 5 (MT5) 设计的直观指标,通过在图表上的水平线周围自动创建可自定义的区域来增强技术分析。这些区域由用户指定的点数距离定义,视觉上突出关键的支持和阻力区域,帮助交易者快速识别关键价格范围和潜在反转点。 主要功能 动态区域创建 :自动在水平线周围生成区域,可调整点数距离(默认:10点)以定义区域宽度。 支持和阻力识别 :根据当前价格相对于水平线的位置对区域进行颜色编码(支持:LimeGreen,阻力:Tomato),便于快速视觉识别。 可自定义外观 :可调整区域透明度(0-255)、颜色以及可选的支持/阻力标签,包括可配置的字体大小和颜色。 水平线过滤 :可选地通过用户定义的前缀过滤水平线,允许为特定线选择性地创建区域。 调试信息 :在 MT5 专家选项卡中提供可选的调试输出,用于故障排除和监控指标性能。 无缝 MT5 集成 :完全兼容 MetaTrader 5,确保流畅的性能和简单的设置。 性能优化 :轻量级设计,对 MT5 图表性能影响极小。 优势 增强价格水平分析 :清晰定
FREE

Dark Power is an Indicator for intraday trading. This Indicator is based on Trend Following strategy, also adopting the use of an histogram to determine the right power . We can enter in good price with this Indicator, in order to follow the strong trend on the current instrument. The histogram is calculated based on the size of the bars and two moving averages calculated on the histogram determine the direction of the signal
Key benefits
Easily visible take profit/stop loss lines Intui

本指标用于在图表上识别和标记 1-2-3 多头和空头形态。本指标可辅助确定交易的开始和分形信号,以及 МetaTrader 5 所有时间帧内的可能入场点。在图表上绘制的菲波纳奇线用来指示在波浪理论基础上价格移动的可能目标。 在价格顶部或底部形成 1-2-3 形态尤其重要,它的出现可作为离散 (聚合)。 本指标可以调整射线和菲波纳奇线的颜色。 本指标对于任何交易系统或模板都是一个极好的补充。
FREE
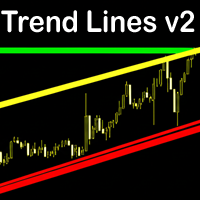
Trend Lines v2 MT5 is an intelligent auto trendline indicator that instantly detects key dynamic support and resistance zones. Built on pivot high/low structure, it delivers a clear and accurate view of market trends across all timeframes. Features Fully automatic trendline drawing based on precise pivot points. Filters out noise – only clean and reliable trendlines are shown. Control the number of lines to keep your chart neat and easy to read. Flexible customization: colors, line thickness, ra
FREE
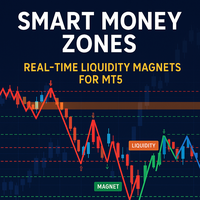
Developed according to the principles of smart money management strategies, the SM Zones indicator is a very convenient tool for traders on the MetaTrader 5 (MT5) platform. It graphically displays on the chart all the significant zones used in the SM strategy: market structure, price levels of increased liquidity, "price magnet" zones - imbalances, order blocks, fvg, breaker blocks and mitigation blocks - towards which the instrument's price moves. The zones influencing the bull market are high
FREE

Do you know VWAP Bands? It is an indicator used to identify support and resistance points from the daily VWAP and you can use it to check the best entry and exit points. This indicator does not use the principle of bollinger bands. There is a difference in the calculation method. Use it according to your strategy. See the applications and what results you can get. The indicator is free and can be used on any account.
FREE

The indicator works to convert normal volume into levels and determine financial liquidity control points.
It is very similar in function to Fixed Volume Profile.
But it is considered more accurate and easier to use than the one found on Trading View because it calculates the full trading volumes in each candle and in all the brokers present in MetaTrade, unlike what is found in Trading View, as it only measures the broker’s displayed prices.
To follow us on social media platforms:
telegram
FREE

该指标显示当前交易品种的盈利(亏损)。 您可以自由拖放线条来显示当前的盈利或亏损。 You can find my products here
参数 Calculation in money or in points — 以点数或货币计算利润/损失。 Add pending orders to calculate — 在计算中考虑挂单。 Magic Number (0 - all orders on symbol) — 幻数,如果需要评估特定订单。 Offset for first drawing (points from the average price) — 线距第一次开始时的平均价格的偏移量。 Decimal places for calculating the Sum — 显示总和的小数点后的位数。 Decimal places for calculating the Percentage — 显示百分比的小数点后的位数。
Tuning 调音 Color of the profit line — 利润线的颜色。 Color of the loss line —
FREE

The Clean Trading Sessions indicator shows the most significant trading sessions for the Forex market, such as London, New York, Tokyo. The Clean Trading Sessions indicator is a simple and, at the same time, quite functional Forex sessions indicator, developed for the MT5 terminal. It is available to download for free.
How is this Forex market session indicator used? Traders normally use trading sessions to determine the volatile hours throughout the day, since the trading activities vary
FREE

Swing High/Low Identifier Swing High/Low Identifier 是一个为 MetaTrader 5 (MT5) 设计的自定义指标,用于突出显示图表上的重要摆动点。该指标基于可配置的柱范围识别并标记高摆动和低摆动点。 高摆动点以红色箭头标记在相应的蜡烛上方。 低摆动点以蓝色箭头标记在相应的蜡烛下方。 该工具帮助交易者快速发现重要的价格水平和模式,这对于做出明智的交易决策至关重要。 有效策略 趋势反转识别: 高摆动点可以指示潜在的阻力水平,可能会开始下跌趋势。 低摆动点可以指示潜在的支撑水平,可能会开始上升趋势。 支撑和阻力分析: 使用标记的高摆动点和低摆动点绘制水平线或通道,作为关键的支撑和阻力水平。 价格行为交易: 将指标与价格行为技术(如蜡烛图模式或突破策略)结合使用,以确认在摆动点的进出点。 摆动交易: 利用高摆动点和低摆动点,根据观察到的价格摆动和潜在的反转区域确定进出点。 其他指标的确认: 使用摆动点确认其他技术指标(如移动平均线或振荡器)的信号,以增强交易信号的可靠性。 该指标提供了关键价格点的可视化表示,帮助交易者增强技术分析和决策过
FREE

Currency RSI Scalper MT5 是基于流行的 Relative Strength Index (RSI) 指标的专业指标。 虽然 RSI 指标在市场区间内运行良好,但在市场条件变化时无法产生盈利信号,因此会产生错误信号,导致巨大损失。 你有没有想过一个自适应 RSI 指标可以根据市场状况调整它? 所提供的指标实现了一种优化算法,可以找到最佳的超买和超卖水平。 这使得 Currency RSI Scalper 能够适应不断变化的市场。 当出现买入或卖出信号时,图表上会绘制一个箭头并触发警报,让您及时开仓,避免一直坐在电脑前。 Currency RSI Scalper 非常适合交易货币(包括加密货币)和二元期权。
为什么选择 Currency RSI Scalper 该指标适用于剥头皮和日内交易。 可以评估指标对历史的有效性。 指标不会重绘(重新计算),信号严格在“柱线收盘”时生成。 它可以用作独立工具或与其他指标一起使用。 电子邮件和移动设备新指标信号通知系统。 能够自定义指标的配色方案。 最优运算算法,终端不“死机”
使用 Currency RSI Scalpe

Free automatic Fibonacci is an indicator that automatically plots a Fibonacci retracement based on the number of bars you select on the BarsToScan setting in the indicator. The Fibonacci is automatically updated in real time as new highest and lowest values appears amongst the selected bars. You can select which level values to be displayed in the indicator settings. You can also select the color of the levels thus enabling the trader to be able to attach the indicator several times with differe
FREE

俄语说明 / 英文 说明 - MT4 版本 主要功能: 显示卖家和买家的活跃区域! 该指标显示所有正确的买入和卖出的初始脉冲水平/区域。当这些水平/区域被激活时,即开始寻找入场点的位置,水平线会改变颜色,并填充特定颜色。此外,还会显示箭头,以便更直观地了解情况。 LOGIC AI - 激活模板时显示用于搜索入口点的区域(圆圈) 为了提高视觉清晰度,添加了使用人工智能搜索入口点的显示区域的功能。 显示更高时间范围内的级别/区域(MTF 模式) 新增使用更高时间间隔显示级别/区域的功能。此外,该指标还具备自动趋势检测功能 ( TPSproTREND PRO )。 独立的专业分步交易算法 该算法专为顺势和逆势的日内交易而设计。每个活动模板均提供详细的说明。 适用于不同的时间范围 TPSpro RFI 水平指标可用于图表上的任何时间间隔,从分钟(M1)到每月(MN)。 图形和声音警报 该指标提供图形和声音提示,让您不会错过交易信号。此外,还支持手机通知。 简单有效的活性模板扫描器 这是一个非常紧凑的主动模式扫描仪,当在一个方向上的所有时间间隔内激活模式时,它会自动发出警报并

关于 Range Explosion Range Explosion 是一款功能强大且免费的交易工具,用于检测市场震荡区间、绘制精确的支撑和阻力,并以高精度和精美的视觉效果识别突破机会。
它是 Break Out Explosion 项目的一部分,为初学者和专业交易者提供可靠且先进的解决方案。 如果您对突破交易概念感兴趣,请查看这款用于检测趋势线突破的高级工具:
https://www.mql5.com/en/market/product/152676 您想要一个根据此指标箭头进行交易的智能交易系统(EA)吗?您只需通过以下链接以 $30 创建一个直接任务,我将为您制作:
https://www.mql5.com/en/job/new?prefered=eeecad 加入此频道以获取 Break Out Explosion 项目 的最新更新和新闻:
https://www.mql5.com/en/channels/breakout_explosion_tradingsystem 主要功能 自动区间检测 – 实时识别市场震荡区。 智能突破信号 – 等待价格突破支撑或阻力并标记买
FREE
Haven Trend Tracker PRO - 您在趋势世界中的导航器 隆重推出 Haven Trend Tracker PRO – 这是一款功能强大的多时间框架指标,专为希望与市场和谐交易的交易者而设计。其主要目标是通过同时在您的工作 (LTF) 和更高 (HTF) 时间框架上显示趋势方向来消除您的疑虑。 我的其他产品 -> 此处 . 顺势交易是最可靠的策略。当局部趋势和全球趋势一致时,该指标可帮助您确定市场的主导力量并找到最佳入场点,从而显着提高成功的可能性。 核心理念——双时间框架的力量 LTF (Lower Timeframe / 较低时间框架) – 这是您当前图表上的趋势。它以细虚线和箭头的形式显示,指示短期价格变动。非常适合寻找精确的入场点。 HTF (Higher Timeframe / 较高时间框架) – 这是您在设置中选择的全球趋势(例如,H1 或 H4)。它以粗线和大箭头的形式绘制,为交易设定主要方向并滤除市场噪音。 当两种趋势重合时,就会出现最强、最可靠的信号! 是什么让 Trend Tracker PRO 成为不可或缺的工具? 该指标
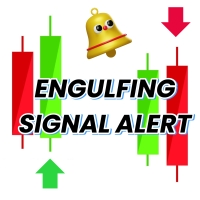
Engulfing Candle Signal Alert: Elevate Your Trading Strategy Unlock the full potential of your trading with the Engulfing Candle Signal Alert, the ultimate tool for identifying market reversals and enhancing your trading precision. Designed specifically for traders who value accuracy and timely alerts, this powerful indicator detects engulfing candle patterns, a key signal in technical analysis that often indicates a potential shift in market direction. What is an Engulfing Candle? An engu
FREE

Breakthrough Solution For Trend Trading And Filtering With All Important Features Built Inside One Tool! Trend PRO's smart algorithm detects the trend, filters out market noise and gives entry signals with exit levels. The new features with enhanced rules for statistical calculation improved the overall performance of this indicator.
Important Information Revealed Maximize the potential of Trend Pro, please visit www.mql5.com/en/blogs/post/713938
The Powerful Expert Advisor Version
Automatin
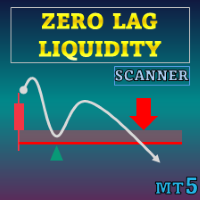
特别优惠 : ALL TOOLS ,每个仅 $35 ! 新工具 在 第一周 或 前 3 笔购买 期间为 $30 ! MQL5 上的 Trading Tools 频道 :加入我的 MQL5 频道以获取我的最新消息 Zero Lag Liquidity 基于较低时间框架的影线剖面和高成交量影线绘制流动性区域。对于每根异常K线,指标会在影线内部构建成交量直方图,找到局部控制点(POC),并将该价格渲染为水平。随后与这些水平的交互可触发标签、突破信号,以及基于价格对此等水平反应的简易趋势状态。
查看更多 MT5 版本: Zero Lag Liquidity MT5 Scanner 查看更多 MT4 版本: Zero Lag Liquidity MT4 Scanner 查看更多产品: All P roducts 概念 高成交量长影线:具有异常长的上/下影线且成交量激增的蜡烛,被选为潜在的对向流动性事件。 影线内直方图:在所选低时间框架上对影线进行分段;按分箱汇总成交量以定位 POC,该点成为流动性水平。 交互与状态:指标跟踪对水平的上破/下破与拒绝,随后相应

枢轴点斐波那契 RSJ 是一个指标,它使用斐波那契汇率追踪当天的支撑线和阻力线。
这个壮观的指标使用斐波那契汇率通过枢轴点创建多达 7 个支撑位和阻力位。 价格如何尊重该支撑和阻力的每个水平真是太棒了,在那里可以感知操作的可能进入/退出点。
特征 多达 7 个支撑位和 7 个阻力位 单独设置级别的颜色
输入 枢轴类型 Pivot Fibo RSJ1 = Fibo ratio 1 计算 Pivot Fibo RSJ2 = Fibo ratio 2 计算 Pivot Fibo RSJ3 = Fibo ratio 3 计算 Pivot Fibo Classic = 经典枢轴计算 最低枢轴级别 旋转 3 个级别 旋转 4 个级别 旋转 5 个级别 枢轴 6 个级别 旋转 7 个级别
如果您仍有疑问,请通过直接消息与我联系: https://www.mql5.com/zh/users/robsjunqueira/
FREE

This is the latest iteration of my famous indicator, Reversal Fractals, published for the first time almost a decade ago. It examines the price structure of fractals to determine possible reversal points in the market, providing timing to positional traders that already have a fundamental or technical valuation model. [ Installation Guide | Update Guide | Troubleshooting | FAQ | All Products ] Reversal fractals can start long trends The indicator is non repainting
It implements alerts of all ki
FREE

你想成为一个持续盈利的五星级外汇交易商吗? 1. 阅读我们简单的 交易系统 的基本描述 和 以及它在2020年的主要策略更新 2. 发送您的购买截图,以获得我们独家交易聊天的个人邀请
FX趋势 实时显示所有时间框架的趋势方向、持续时间、强度和由此产生的趋势评级。
您将一目了然地看到趋势在哪个方向运行,它们持续多长时间以及它们有多强大。
所有这些使它成为初学者、高级和专业交易者的易于使用的趋势交易系统 。
分析功能 所有时间框架的实时趋势分析 所有时间框架的计算结果完全相同 配置您个人的时间框架集 可定制的趋势计算参数 图形功能 在紧凑模式、细节模式和仪表板模式之间一键切换 紧凑模式在一个缩小的面板中提供基本的趋势信息 细节模式提供相关符号的深入趋势分析 仪表板模式涵盖了所有主要的或你最喜欢的交易符号 只需在面板内点击一下,就可以访问所有的时间框架和符号 可移动的外汇趋势显示(通过拖放)。 适用于高分辨率的QHD、UHD和4K显示器 不需要重新画图 一般特征 自动的终端配置 针对平板电脑和触摸屏的使用进行了优化 通过电子邮件、信息和手机通知发出警报 为EA请求提供可访问的缓冲区

Haven Bar Replay — 您的专属交易复盘训练模拟器 隆重推出 Haven Bar Replay – 这是一款专为手工交易和策略测试打造的专业模拟器。它能将您的 MT5 图表瞬间变身为历史播放器,让您在几分钟内体验数月的市场波动。 查看我的其他产品 -> 点击这里 。 您是否想学会稳定盈利,却不愿花费数小时苦等行情?这个工具专为您设计。像在实盘中一样,利用历史数据训练您的盘感,验证您的交易假设,并磨练您的技巧。 为什么 Haven Bar Replay 是每位交易者的必备工具? 完美的“图表右侧”体验
指标完全隐藏了“未来”数据(真实的K线),只显示模拟出来的部分。您将在完全诚实的环境下做决策,无法偷看未来行情。 完全掌控时间
您可以快速跳过无聊的震荡行情,或者在重要新闻发布时放慢速度。报价的推进速度完全由您掌控。 智能导航
只需拖动标记线或双击鼠标,即可瞬间穿越到历史的任何时间点。 平滑滚动
图表会跟随价格自动平滑移动,提供舒适的视觉体验,避免画面突兀跳动。 使用指南:如何操作模拟器 打开任意品种和周期的图表。 加载 Haven Bar Replay
FREE

Special offer : ALL TOOLS , just $35 each! New tools will be $30 for the first week or the first 3 purchases ! Trading Tools Channel on MQL5 : Join my MQL5 channel to update the latest news from me SMC 是一种交易方法,帮助交易者识别流动性区域、机构订单位置以及关键市场转折点。通过利用 SMC 原则,交易者可以更有效地驾驭市场,找到最佳的进场和出场点。 SMC System 指标将这些概念自动化,使您能够快速标记图表上的关键价格行为元素,例如: 实时市场结构 (内部结构与摆动结构的 BOS / CHoCH) 订单区块 (多头与空头) 溢价区与折扣区 等高与等低 公平价值缺口 (FVG) 检测 多个时间框架中的关键高点与低点 MT4 版本在此查看: SMC System MT4 查看更多产品: 所有 产品 主要功能 SMC System 为 SMC 交
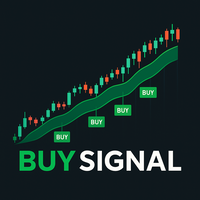
该指标是一款基于 指数移动平均线(EMA) 的分析工具,旨在帮助交易者更好地理解市场趋势并辅助交易决策。它结合了 两条指数移动平均线(EMA) 和 一条平滑指数移动平均线(SMMA) ,以提供对市场价格动态的更深层次分析。 该指标可以应用于 各种金融市场 ,包括股票、期货、外汇和加密货币等。用户可以根据自己的交易风格和策略选择适合的时间周期。一些交易者倾向于在 30秒图表 上使用该指标,并结合 2分钟图表 进行辅助分析,以获得更清晰的市场趋势信号。 指标的工作原理 该指标的核心概念是通过移动平均线的交叉、价格与均线的相对位置,以及均线的斜率变化,来评估市场趋势的方向。当价格突破某些关键均线时,可能意味着趋势的变化或延续。交易者可以根据这些信息做出进一步的市场分析。 该指标不仅适用于短线交易,还可以在 不同时间周期 上使用,例如 5分钟、15分钟、1小时甚至日线图 。在较长时间周期中,均线的作用更明显,有助于识别更长期的趋势变化。 此外,该指标可以与其他技术分析工具结合使用,例如支撑和阻力位、成交量分析、布林带或相对强弱指数(RSI)等,以提高市场分析的准确性。 主要特点 结合 指数移动
FREE

The Breakout Finder (BF) is a powerful MetaTrader 5 indicator designed to detect potential breakout and breakdown opportunities in price action. By analyzing pivot highs and lows over a user-defined period, it identifies consolidation zones where price has repeatedly tested resistance or support levels within a narrow channel. When price breaks out of these zones with sufficient confirmation (based on the minimum number of tests and channel width threshold), the indicator visually highlights th
FREE

蜡烛计数器 此指标计算蜡烛并 将数字显示在屏幕上 基于更长的时间框架 较大的时间范围 您可以将每日时间范围选择为“ Bigger Timeframe ”,并在具有较小时间范围的任何图表中运行它。计数器将根据 每日图表 计算条形。 如果您将时间帧“ H1 ”作为参数传递,那么该指标将知道如何计算 H1 图表内的柱线,您只需在具有较小时间帧的图表上运行它即可。 主要参数是“ Bigger Timeframe ”,它比您使用的时间范围更大,是蜡烛计数的基础。 显示数字 除了这个参数之外,还有一个显示数字的参数,因为你不一定需要在屏幕中间看到数字,你可以通过按 CTRL+来看到计数D 并观察指标“ BarIn(大体时间) ”。 鼠标 当您在屏幕上 移动鼠标 时,该区域也非常有用,因此您将能够看到鼠标光标经过的确切栏,在图像中查看如何这行得通。 可分 有一个参数叫做“ Divisible ”这个参数是用来让你只看到能被这个参数整除的条数,这样屏幕就不会那么脏了这么多数字。 总和 还有参数“ Sum ”,它与参数 Divisible 一起使用,在图像中我留下了一个使用 Divisible 5 和
FREE

符号: USDCHF、USDJPY、XAUUSD、GBPUSD、EURUSD、AUDUSD、GBPJPY(我最喜欢 USDCHF_H1)
时间周期: M15, H1, H4, D1
主要特点: 无重绘、无延迟、趋势信号、多重确认
安全性: 信号包含止损、止盈,并遵循风险回报规则
包含: 免费多周期扫描器(购买产品后,只需通过私信发送截图给我,我会亲自把扫描器文件发送给您。)
完整的交易系统概念: 阅读文章 (完整概念在本文中解释) 产品已升级到 1.5 版本 (我每天在真实账户手动交易,并持续改进这个指标) Break Out Explosion 的 MT4 版本现已上线: https://www.mql5.com/en/market/product/155132 展示我在 1000 美元账户上真实交易的实时信号 : https://www.mql5.com/en/signals/2348010
加入讨论 在 MQL5 社区聊天中有一个支持小组。 加入 支持小组 ,与其他用户分享想法、提问或讨论交易策略。 关于 Break Out Explosion Break Out E

EXTREME POI Indicator Join the telegram community for an exciting trading journey. https://t.me/automated_TLabs Professional Trading Indicator for MetaTrader 5/Metatrader 4
EXTREME POI is an advanced institutional-grade trading indicator designed to identify high-probability Points of Interest (POI) based on Smart Money Concepts. The indicator combines multiple sophisticated techniques to detect areas where institutional traders are likely to enter the market.
Working Pairs GOLD, EURUSD,
FREE

The SMC Market Structure indicator tracks key price action shifts using Smart Money Concepts (SMC), helping traders identify institutional behavior and overall trend direction.
It automatically detects and displays: Break of Structure (BOS) – Signals continuation of trend Change of Character (CHOCH) – Indicates potential reversal Swing Highs and Lows – Used to define market structure and directional bias
Each structural event is clearly marked on the chart, allowing traders to visualize momentu
FREE

Hull Moving Average (HMA) is well-deservedly popular among traders because of the effective averaging of market noise and a relatively small delay. The current MetaTrader 5 version changes its color when the movement direction changes. Sound and text signals are available. It also supports sending email and push messages. It is possible to trigger a signal on the current incomplete bar, although such a signal may be canceled before completion if conditions are no longer appropriate. One of the p
FREE
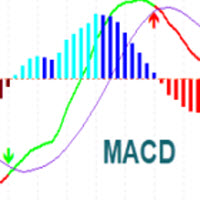
MACD Indicator It has MACD line, Signal line, and Histogram. The Histogram has 4 colors based on Direction Above and Below the Zero Line, showing its movement direction as simple as possible. Allows Show MACD & Signal Line, Show Change In color of MACD Line based on cross of Signal Line. Show Dots at Cross of MacD and Signal Line, Turn on and off Histogram. Enjoy your trading experience, and feel free to share your comments and reviews.
If you are interested in this indicator, you might be i
FREE

Overview The Smart Money Structure Markup Indicator for MetaTrader 5 is a powerful tool designed to help traders identify key market structures based on popular Smart Money Concepts (SMC) strategies. This indicator detects micro-market structures, providing insights into price movements and potential trend changes. It highlights important elements such as valid Break of Structure (BOS), Change of Character (CHoCH), and Inducement (IDM), helping traders to make informed decisions. Key Features Ma
FREE

当涉及到金融市场时,"SuperTrend"这一备受欢迎的指标是一款技术分析工具,有助于识别趋势的方向以及市场可能的入场或离场点。该指标基于平均真实波幅(ATR),它根据价格范围来衡量市场的波动性。在其他平台上,它是免费提供的,这里也不例外! 该指标通常以三种方式使用: 识别当前趋势:当价格位于该线的上方时,被视为上升趋势,当价格位于下方时,被视为下降趋势。 用作止损水平。 作为动态支撑/阻力:在上升趋势中,该线位于价格下方,充当动态支撑水平。在下降趋势中,该线位于价格上方,充当动态阻力水平。 此指标的独特之处在于,它不仅可以帮助交易者确定趋势,还可以提供有效的风险管理策略。它是一个多功能工具,适用于各种市场和交易风格,从而为交易者提供了更大的灵活性和可操作性。无论是趋势追踪还是反转交易,"SuperTrend"都为交易者提供了关键的视觉指引,使他们能够更好地做出决策并取得成功。
FREE

Quantum Heiken Ashi PRO 简介 Heiken Ashi 蜡烛旨在提供对市场趋势的清晰洞察,以其过滤噪音和消除虚假信号的能力而闻名。告别令人困惑的价格波动,迎接更流畅、更可靠的图表表示。 Quantum Heiken Ashi PRO 的真正独特之处在于其创新公式,它将传统烛台数据转换为易于阅读的彩色条。红色和绿色条分别优雅地突出了看跌和看涨趋势,让您能够以非凡的精度发现潜在的进入和退出点。
量子 EA 通道: 点击这里
MT4版本: 点击这里
这一卓越的指标具有以下几个关键优势: 增强清晰度:通过平滑价格波动,Heiken Ashi 金条可以更清晰地反映市场趋势,使您更容易识别有利的交易机会。 减少噪音:告别经常导致错误信号的不稳定价格变动。 Quantum Heiken Ashi 指标可过滤噪音,使您能够做出更明智的交易决策 无缝集成:Heiken Ashi 指标专为 MetaTrader 开发,可无缝集成到您的交易平台中。它用户友好、高度可定制,并且与您的其他交易指标和过滤器兼容 无论您是寻求新优势的经验丰富的交易者,还是寻求可

Candle Time CountDown By BokaroTraderFx The Candle Timer Countdown Indicator is a versatile tool designed for the MetaTrader 5 (MT5) trading platform. It provides traders with a visual countdown of the remaining time for the current candle on a chart. The key features include:
Customizable Position: Place the countdown timer in any corner of the chart for optimal visibility. Default Text Color: Set to red for clear visibility, with options for further customization. Minimal Display: Shows only
FREE
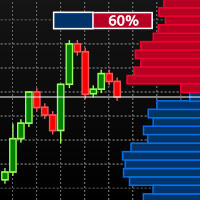
Visual Book on Chart is an indicator designed specially for stocks and futures market. To check if you can use the tool with your Broker open the MT5 Depth Of Market on your terminal and check if there are price and volume data available. Learn more about the MT5 Depth Of Market in the oficial page. The indicator shows the depth of market data on the chart window and use gradient based on the market data to colorize the histogram bars. The indicator is formed by two components: The panel, whic
FREE
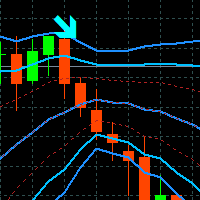
Tyr Bands Indicator
Tyr Band works with BB and 3 different deviations, plus the Stochastic confirmation. So when the price closes below/above the BB Reversal Band (Red) and the Stoch is in the confirmation zone, then the arrow (buy/sell) appears. This arrow indicates that we can entry to the market up/down on the next opening. Since it is only an indicator, it will not place SL or TP, we need to have them placed manually if you want to trade. The SL will lie on the external BB band (Blue), and
FREE

VM Heiken Ashi Pro
Heiken-Ashi 平滑处理(HMA 或 EMA)用于滤除噪声并生成清晰的 BUY/SELL 信号,非重绘(可选 ConfirmOnClosedBar)。在图表上显示 HA 蜡烛(可隐藏原始蜡烛),箭头位置可按 ATR 或固定偏移设置,发送提醒(弹窗、电子邮件、推送)并具备防垃圾信息处理。 主要用途
将原始蜡烛转换为平滑的 Heiken-Ashi 以检测颜色变化(空头到多头 / 多头到空头)并绘制入场箭头。选项 ConfirmOnClosedBar 使指标在蜡烛收盘后才确认信号以避免重绘。UseATRForArrowOffset 使箭头显示更合理。该指标轻量且在多个图表上稳定运行。 快速使用
附加指标,选择 Smoothing Method 和 Smoothing Period(默认 50),如需非重绘确认信号请启用 ConfirmOnClosedBar,按需启用提醒,并保存模板。 推荐时间框架
优先 H1-D1 以获得可靠信号。M5-M15 可用于剥头皮,但请小心并启用蜡烛收盘确认。 关键参数 Smoothing Period -

简体中文(Chinese – Simplified)
欢迎使用 EPo-CreW Forex Super ORB-H4 指标!
本指南将教您如何使用这一强大的工具,根据市场第一个 4 小时开盘区间来识别高概率交易机会。无论您是初学者还是经验丰富的交易者,该系统都将帮助您以更高的信心和一致性进行交易。
交易策略. 这是一个演示产品,将在安装之日起 30 天后到期。 注意:确保切换到 M5 时间框架。这是使用此指标的最佳时间框架
策略 1:突破与回调(主要策略)
SELL(卖出)设置:
价格向上突破蓝线(高点突破)
出现金色 BREAKOUT(突破)箭头
等待价格收盘回到蓝线下方
出现红色 SELL 箭头(回调入场)
在指示的入场价位卖出(SELL)
止损(SL) 设置在红点处(区间高点上方)
止盈(TP) 设置在蓝点处(TP1、TP2、TP3)
BUY(买入)设置:
价格向下突破红线(低点突破)
出现金色 BREAKOUT(突破)箭头
等待价格收盘回到红线上方
出现绿色 BUY 箭头(回调入场)
在指示的入场价位买入(BUY)
止损(SL) 设置在红点处(区间低点下方)
止盈(TP)
FREE

MACD divergence indicator finds divergences between price chart and MACD indicator and informs you with alerts (popup, mobile notification or email) . Its main use is to find trend reversals in the chart. Always use the divergence indicators with other technical assets like support resistance zones, candlestick patterns and price action to have a higher possibility to find trend reversals. Three confirmation type for MACD divergences: MACD line cross zero level Price returns to previous H/L Crea
FREE

Dark Breakout is an Indicator for intraday trading. This Indicator is based on Trend Following strategy, providing an entry signal on the breakout. The signal is provided by the arrow, which confirms the breaking of the level. We can enter in good price with this Indicator, in order to follow the main trend on the current instrument. It is advised to use low spread ECN brokers. This Indicator does Not repaint and N ot lag . Recommended timeframes are M5, M15 and H1. Recommended working pairs
MetaTrader 市场 - 在您的交易程序端可以直接使用为交易者提供的自动交易和技术指标。
MQL5.community 支付系统 提供给MQL5.com 网站所有已注册用户用于MetaTrade服务方面的事务。您可以使用WebMoney,PayPal 或银行卡进行存取款。
您错过了交易机会:
- 免费交易应用程序
- 8,000+信号可供复制
- 探索金融市场的经济新闻
注册
登录