Indicadores técnicos para MetaTrader 5 - 5

El indicador implementa el enfoque del autor para la construcción del popular indicador "Zig-Zag" .
Las ventajas del indicador " ZIgZag Level" es que filtra el ruido del mercado y muestra niveles.
"ZIg Zag Level" se basa en picos y valles, muestra niveles.
Estos niveles se pueden desactivar y configurar.
El indicador muestra el precio del nivel, la etiqueta del precio se puede desactivar.
La línea "zigzag" entre los puntos también se puede desactivar .
El indicador tiene un sistema de not

El indicador de reversión de ADR le muestra de un vistazo dónde se cotiza actualmente el precio en relación con su rango diario promedio normal. Recibirá alertas instantáneas a través de una ventana emergente, correo electrónico o push cuando el precio exceda su rango promedio y los niveles por encima de su elección para que pueda saltar rápidamente a retrocesos y reversiones. El indicador dibuja líneas horizontales en el gráfico en los extremos del rango promedio diario y también extensiones p

El indicador analiza la escala de volúmenes y la divide en dos componentes: volúmenes vendedores y volúmenes compradores, y también calcula el delta y el delta acumulativo. El indicador no parpadea ni se redibuja, su cálculo y trazado se realizan con bastante rapidez, al tiempo que utiliza los datos de los períodos más pequeños (en relación con el actual). Los modos de funcionamiento del indicador se pueden cambiar utilizando la variable de entrada Modo : Compra - muestra sólo los volúmenes comp
FREE

The Oracle es el compañero perfecto para traders que necesitan análisis de mercado precisos sin gestionar múltiples indicadores.
Mientras la mayoría de indicadores muestran señales de una sola perspectiva, The Oracle fusiona métodos científicamente probados con mejoras propietarias en un histograma de consenso. Siete modelos, incluyendo nuestro Ultimate Flow Index (UFI) con algoritmos de suavizado Ehlers, votan independientemente en cada vela.
Cuando suficientes modelos coinciden—según el umb
FREE

Este indicador dibuja zonas de oferta y demanda en el gráfico. Si lo combina con sus propias reglas y técnicas, este indicador le permitirá crear (o mejorar) su propio y potente sistema. Consulte también la versión de pago , que ofrece mucho más. Mi recomendación es buscar oportunidades de trading en las que la primera prueba de zona se produzca después de al menos 25 barras. Características Las zonas tienen 3 colores (ajustables por entrada). Color oscuro para zona no probada, medio para zo
FREE

40% de descuento. Precio original: $50
Advanced Bollinger Bands Scanner es un panel de control de las bandas de Bollinger con múltiples símbolos y marcos temporales que monitoriza y analiza el indicador de las bandas de Bollinger desde un gráfico. Este panel escanea el indicador de las Bandas de Bollinger en hasta 28 instrumentos configurables y 9 marcos temporales en busca de sobrecompra/sobreventa de precios, consolidación de precios (compresión de las Bandas de Bollinger), y ruptura de cons

También echa un vistazo a mi bot picos premium: https://www.mql5.com/en/market/product/142350 Comprueba también mi bot premium spikes: https://www.mql5.com/en/market/product/142350 Compruebe también mi prima picos bot: https://www.mql5.com/en/market/product/142350 MEGASPIKES BOOM Y CRASH v1.32 NB: los códigos fuente de este indicador están disponibles: PM me: https://t.me/Machofx POR FAVOR, ÚNASE AL CANAL DE ABAJO PARA TENER ACCESO A TODAS LAS VERSIONES ANTERIORES echa un vistazo a Spikes robot
FREE

El indicador identifica cuando ocurre una divergencia entre el precio y un oscilador / indicador. Identifica divergencias tanto regulares como ocultas. Tiene una opción de filtro RSI que permite filtrar solo las configuraciones más fuertes. El indicador también ofrece opciones para esperar una ruptura del canal de Donchian o que el precio cruce una media móvil (ver captura de pantalla n. 3) para confirmar la divergencia antes de señalar la oportunidad comercial. Combinado con sus propi

¿Conoce las Bandas VWAP? Es un indicador utilizado para identificar puntos de soporte y resistencia a partir del VWAP diario y puede utilizarlo para comprobar los mejores puntos de entrada y salida. Este indicador no utiliza el principio de las bandas de Bollinger. Hay una diferencia en el método de cálculo. Utilícelo según su estrategia. Vea las aplicaciones y los resultados que puede obtener. El indicador es gratuito y se puede utilizar en cualquier cuenta.
FREE

VM Indicador de Velas de Tendencia - Solución Completa de Trading de Tendencia El Indicador de Velas de Tendencia es un sistema de negociación Forex profesional, intuitivo y fácil de usar, diseñado para transformar complejos análisis de tendencias en señales de negociación claras y de alta probabilidad. Basado en principios probados de seguimiento de tendencias y mejorado con un filtrado inteligente del mercado, el indicador proporciona señales precisas de COMPRA/VENTA junto con niveles de Stop

Modificación multidivisa y multitemporal del indicador Índice de Fuerza Relativa (RSI). Puede especificar las monedas y plazos que desee en los parámetros. Además, el panel puede enviar notificaciones cuando se cruzan niveles de sobrecompra y sobreventa. Al hacer clic en una celda con un punto, se abrirá este símbolo y punto. Este es el escáner MTF.
La clave para ocultar el panel del gráfico es "D" de forma predeterminada.
De manera similar al medidor de fortaleza de la moneda, el Panel puede

COMPRA/VENTA DE PETRÓLEO CRUDO (3 Min) Resumen técnico El indicador CRUDE OIL BU Y/SELL está diseñado para operadores a corto plazo que se centran en los movimientos del precio del crudo.
Identifica oportunidades de compra y venta de alta probabilidad basadas en una combinación de niveles RSI , posicionamiento de tendencia SMA y análisis de estructura de velas .
Esta herramienta es particularmente eficaz en el marco temporal de 3 minutos , proporcionando señales visuales claras y alertas tanto p

¿Estás cansado de dibujar manualmente los niveles de Fibonacci en tus gráficos? ¿Está buscando una forma conveniente y eficiente de identificar los niveles clave de soporte y resistencia en sus operaciones? ¡No busque más! Presentamos DrawFib Pro, el último indicador de MetaTrader 5 que realiza niveles automáticos de F ibonacci basándose en sus gráficos y proporciona alertas oportunas cuando se superan estos niveles. Con DrawFib Pro, puede mejorar sus estrategias comerciales, ahorrar
FREE

Este indicador obedece a la máxima popular de que: "LA TENDENCIA ES TU AMIGA" Pinta una línea VERDE para la COMPRA y también pinta una línea ROJA para la VENTA. (puedes cambiar los colores). Da alarmas y alertas de todo tipo. NO SE REPITE y se puede utilizar para todos los pares de divisas y plazos. Sí, tan fácil y sencillo como eso. Incluso un novato puede utilizarlo para hacer grandes y fiables operaciones. NB: Para obtener mejores resultados, obtenga mis otros indicadores premium para señales
FREE

INDICADOR: GEN TriFactaX Desarrollador: gedeegi Descripción general GEN TriFactaX es un indicador técnico diseñado para identificar y visualizar automáticamente el patrón 1-2-3 o patrón de reversión de precios. Este patrón es una formación clásica de la acción del precio utilizada con frecuencia por los operadores para detectar posibles cambios de tendencia. Este indicador no sólo muestra el patrón 1-2-3 en el gráfico, sino que también identifica automáticamente la señal de ruptura desde el niv

Este indicador muestra líneas de tendencia de ruptura fractal y soportes y resistencias.
La Línea de Tendencia Fractal Ascendente y la Línea de Tendencia Fractal Descendente se trazan a partir de los últimos fractales válidos. Las rupturas pueden producirse por encima o por debajo de estas líneas de tendencia. Las líneas horizontales se trazan a partir del último fractal superior y del último fractal inferior para mostrar los niveles de soporte y resistencia. Las líneas horizontales de interse
FREE
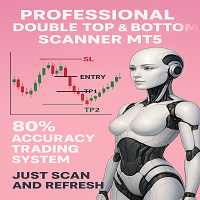
N/B : Todos nuestros productos vienen con nuestra compra gratuita ''DAILY SCALPER EA'' - bit .ly/4qlFLNh Whatsapp Desarrollador para el suyo después de la compra exitosa
ESCÁNER PROFESIONAL DE PATRONES DE DOBLE TECHO/FONDO
El mejor sistema de inversión para operadores de Forex y criptomonedas
TRANSFORME SUS OPERACIONES CON EL RECONOCIMIENTO INSTANTÁNEO DE PATRONES
¿Está cansado de perder rentables configuraciones de inversión? ¿Cansado de mirar gráficos durante horas, tratando de detectar d
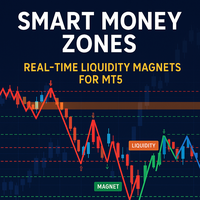
Desarrollado según los principios de las estrategias de gestión inteligente del dinero, el indicador SM Zones es una herramienta muy práctica para los operadores de la plataforma MetaTrader 5 (MT5). Muestra gráficamente en el gráfico todas las zonas significativas utilizadas en la estrategia SM: estructura del mercado, niveles de precios de mayor liquidez, zonas "imán de precios" - desequilibrios, bloques de órdenes, fvg, bloques de ruptura y bloques de mitigación - hacia las que se mueve el pr
FREE

Adéntrese en el mundo de las operaciones de divisas con confianza, claridad y precisión utilizando el Indicador Oro , una herramienta de última generación diseñada para llevar su rendimiento en las operaciones al siguiente nivel. Tanto si es un profesional experimentado como si acaba de comenzar su andadura en los mercados de divisas, el Indicador Oro le proporciona una visión poderosa y le ayuda a operar de forma más inteligente, no más difícil. Basado en la sinergia probada de tres indicadore

Este indicador encuentra los patrones de retroceso AB = CD. El patrón de retroceso AB = CD es una estructura de precios de 4 puntos en la que el segmento de precios inicial está parcialmente retrocedido y seguido de un movimiento equidistante desde la finalización del retroceso, y es la base básica de todos los patrones armónicos. [ Guía de instalación | Guía de actualización | Solución de problemas | FAQ | Todos los productos ]
Tamaños de patrones personalizables
Relaciones de CA y BD perso

Smart Trendlines - Indicador de líneas de tendencia nº1 Smart Trendlines es una herramienta de precisión que dibuja automáticamente líneas de tendencia basadas en cada punto pivote válido, ayudando a los operadores a identificar zonas clave de soporte y resistencia. Se ajusta continuamente a medida que se forman nuevos pivotes de mercado, proporcionando un reflejo vivo y preciso de la estructura de precios. Tanto si está siguiendo tendencias, preparándose para retrocesos o anticipando rupturas,

El indicador Clean Trading Sessions muestra las sesiones de negociación más importantes del mercado Forex, como Londres, Nueva York o Tokio. El indicador Clean Trading Sessions es un indicador de sesiones de Forex sencillo y, al mismo tiempo, bastante funcional, desarrollado para el terminal MT5. Se puede descargar de forma gratuita.
¿Cómo se utiliza este indicador de sesiones de mercado Forex? Normalmente, los operadores utilizan las sesiones bursátiles para determinar las horas de volatilidad
FREE

Indicador de perfil de volumen del mercado + oscilador inteligente. Funciona en prácticamente todos los instrumentos: pares de divisas, acciones, futuros, criptomonedas, tanto con volúmenes reales como de ticks. Es posible configurar la definición automática del rango de construcción del perfil (por ejemplo, por una semana o un mes, etc.), así como establecer el rango manualmente moviendo los límites (dos líneas verticales: roja y azul). Se muestra en forma de histograma. El ancho del histograma

Indicador EXTREME POI Join the telegram community for an exciting trading journey. https://t.me/automated_TLabs Indicador comercial profesional para MetaTrader 5/Metatrader 4
EXTREME POI es un indicador avanzado de trading de nivel institucional diseñado para identificar Puntos de Interés (POI) de alta probabilidad basados en conceptos de Smart Money. El indicador combina múltiples técnicas sofisticadas para detectar áreas en las que es probable que los operadores institucionales entren en e
FREE
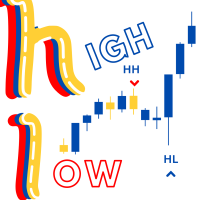
Swing High/Low Identifier El Swing High/Low Identifier es un indicador personalizado para MetaTrader 5 (MT5) diseñado para resaltar puntos de oscilación significativos en tu gráfico. Este indicador identifica y marca altos y bajos de oscilación basándose en un rango configurable de barras. Los altos de oscilación se marcan con flechas rojas sobre las velas correspondientes. Los bajos de oscilación se marcan con flechas azules debajo de las velas correspondientes. Esta herramienta ayuda a los tra
FREE

Haven Bar Replay — Su Simulador Personal de Trading Presentamos Haven Bar Replay – un simulador profesional para el trading manual y pruebas de estrategias. Esta herramienta transforma su gráfico de MT5 en un reproductor histórico, permitiéndole vivir meses de movimientos del mercado en solo unos minutos. Vea mis otros productos -> AQUÍ . ¿Quiere aprender a operar de manera rentable pero no está dispuesto a esperar horas para que se formen los patrones? Esta herramienta está diseñada para
FREE

Contador de velas Este indicador cuenta las velas y pone los números en la pantalla de las velas en función de un marco de tiempo más largo Largo período de tiempo Puede elegir el marco de tiempo diario como " Bigger Timeframe " y ejecutarlo dentro de cualquier gráfico que tenga el marco de tiempo más pequeño. que el contador contará las barras según el gráfico diario . Si pasa el marco de tiempo " H1 " como parámetro, entonces el indicador sabrá cómo contar las barras dentro del gráfico H1, sol
FREE

Este indicador está destinado para reconocer y marcar en el gráfico 1-2-3 patrones de compra y de venta. El indicador ayudará al trader a detectar los fractales de inicio y de señal, indicar los posibles puntos de entrada en el mercado en todos los períodos de tiempo del programa МetaTrader 5. En el gráfico se dibujan las líneas de Fibonachi que indican supuestos objetivos del movimiento partiendo de la teoría de ondas. Las formaciones 1-2-3 adquieren una especial importancia después de la forma
FREE
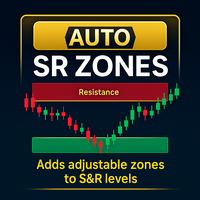
Zona S/R - Resumen del Producto para MetaTrader 5 Resumen La Zona de Soporte/Resistencia es un indicador intuitivo para MetaTrader 5 (MT5) que mejora el análisis técnico al crear automáticamente zonas personalizables alrededor de líneas horizontales en tu gráfico. Estas zonas, definidas por una distancia en pips especificada por el usuario, resaltan visualmente áreas clave de soporte y resistencia, ayudando a los traders a identificar rápidamente rangos de precios importantes y posibles puntos d
FREE

Pivot Point Fibo RSJ es un indicador que rastrea las líneas de soporte y resistencia del día utilizando las tasas de Fibonacci.
Este espectacular indicador crea hasta 7 niveles de soporte y resistencia a través del Pivot Point utilizando las tasas de Fibonacci. Es fantástico cómo los precios respetan cada nivel de este soporte y resistencia, donde es posible percibir posibles puntos de entrada / salida de una operación.
Características Hasta 7 niveles de soporte y 7 niveles de resistencia Es
FREE
Descripción del indicador Range Filter Pro es una sofisticada herramienta de negociación para XAUUSD (Oro) que combina el filtrado adaptativo de precios con el análisis de volumen y el seguimiento del mercado en tiempo real. Diseñado tanto para operadores principiantes como profesionales, este indicador ayuda a identificar la dirección de la tendencia, posibles retrocesos y movimientos significativos del mercado a través de su enfoque multicapa.
Componentes clave 1.Filtro de rango dinámico 2.B
FREE

El popular indicador "SuperTrend" es una herramienta de análisis técnico que ayuda a identificar la dirección de una tendencia y posibles puntos de entrada o salida en los mercados financieros. El indicador se basa en el Average True Range (ATR), que mide la volatilidad del mercado en función de los rangos de precios. !Es gratuito en otras plataformas y aquí no tiene por que ser la excepción! Se utiliza comúnmente de tres maneras: Para identificar la Tendencia Actual: Cuando el precio está por e
FREE

Currency RSI Scalper MT5 es un indicador profesional basado en el popular indicador Relative Strength Index (RSI). Aunque el indicador RSI funciona bien para un intervalo del mercado, no genera señales rentables cuando cambian las condiciones del mercado y, por lo tanto, produce señales incorrectas que resultan en grandes pérdidas. ¿Ha pensado alguna vez en un indicador RSI adaptativo que se adapte a las condiciones del mercado? El indicador presentado implementa un algoritmo de optimización qu

Este indicador de trading todo en uno reúne señales de ruptura, niveles de máximos y mínimos, y un trailing stop con alertas en una única herramienta poderosa. Si alguna vez te has sentido abrumado por superponer demasiados indicadores en tu gráfico, este simplifica todo al tiempo que te da una ventaja clara en los mercados. Combina tres elementos esenciales en una visualización limpia y directa que te ayuda a detectar oportunidades de entrada, gestionar el riesgo y captar el flujo general del m
FREE

INSTRUCCIONES RUS / INSTRUCCIONES ENG / Versión MT4 Funciones principales: ¡Muestra zonas activas de vendedores y compradores! El indicador muestra todos los niveles/zonas de primer impulso correctos para compras y ventas. Cuando se activan estos niveles/zonas, donde comienza la búsqueda de puntos de entrada, cambian de color y se rellenan con ciertos colores. También aparecen flechas para una percepción más intuitiva de la situación. LOGIC AI - Visualización de zonas (círculos) para busc

M5 Scalp Flechas de Entrada de Mecha Este indicador muestra dos tipos independientes de flechas directamente en el gráfico. Ambos tipos de flechas se calculan estrictamente a partir de los datos de M5, mientras que el indicador puede adjuntarse a cualquier marco temporal para una cómoda visualización y análisis. Las flechas ayudan a marcar visualmente los posibles momentos de interés sin sobrecargar el gráfico. Puede ajustar el tamaño de la flecha y los colores en la configuración para que coinc
FREE

Fibonacci automático gratuito es un indicador que traza automáticamente un retroceso de Fibonacci en función del número de barras que seleccione en la configuración BarsToScan del indicador. El Fibonacci se actualiza automáticamente en tiempo real a medida que aparecen nuevos valores máximos y mínimos entre las barras seleccionadas. Puede seleccionar qué valores de nivel se mostrarán en la configuración del indicador. También puede seleccionar el color de los niveles, permitiendo así que el oper
FREE
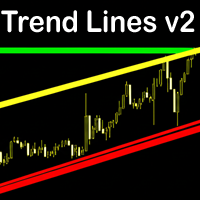
Trend Lines v2 MT5 es un indicador automático inteligente de líneas de tendencia que detecta al instante zonas dinámicas clave de soporte y resistencia. Construido sobre la estructura de pivote alto/bajo, ofrece una visión clara y precisa de las tendencias del mercado en todos los plazos. Características Trazado de líneas de tendencia totalmente automático basado en puntos pivote precisos. Filtra el ruido: sólo se muestran las líneas de tendencia limpias y fiables . Controle el número de líneas
FREE
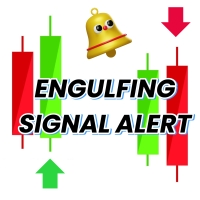
Alerta de Señal de Vela Envolvente: Eleve su Estrategia de Trading Libere todo el potencial de sus operaciones con la Alerta de Señal de Vela Envolvente, la herramienta definitiva para identificar los retrocesos del mercado y mejorar la precisión de sus operaciones. Diseñado específicamente para los operadores que valoran la precisión y las alertas oportunas, este potente indicador detecta patrones de velas envolventes, una señal clave en el análisis técnico que a menudo indica un cambio potenci
FREE
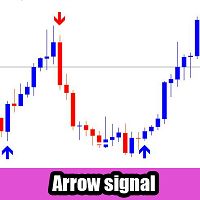
Este indicador está diseñado para ayudar a los operadores proporcionando señales de flecha sin repintado combinadas con tecnología de ajuste dinámico del periodo .
Se centra en la coherencia, la claridad y la flexibilidad, por lo que es adecuado para diferentes marcos temporales y estilos de negociación. Una vez que se genera una señal, no se vuelve a pintar, no se desplaza ni desaparece, lo que garantiza que las señales de los gráficos históricos sigan siendo idénticas al uso en tiempo real.
Re
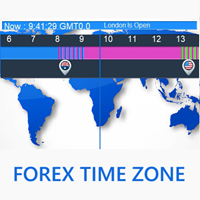
Introducción breve a Forex Time Zone ¡Bienvenido a una nueva herramienta profesional gratuita: Forex Time Zone ! Los traders profesionales saben lo importante que es el tiempo en el mercado de divisas. Cada segundo, algunos mercados del mundo abren mientras otros cierran, lo que impacta en la volatilidad del mercado y en el movimiento de monedas específicas. Esta herramienta ayuda a los traders a identificar fácilmente qué mercado está abierto en este momento y en qué zona horaria se encuentran.
FREE
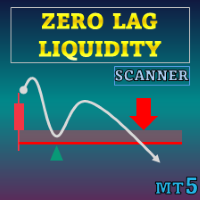
Oferta especial : ALL TOOLS , ¡solo $35 cada uno! Nuevas herramientas costarán $30 durante la primera semana o para las primeras 3 compras ! Canal de Trading Tools en MQL5 : Únete a mi canal de MQL5 para recibir mis últimas novedades Zero Lag Liquidity traza zonas de liquidez a partir de perfiles de mechas en marcos temporales inferiores y mechas de alto volumen. Para cada vela anómala, el indicador construye un histograma de volumen dentro de la mecha, encuentra un Punto de Contro
Acerca de Range Explosion Range Explosion es una herramienta de trading poderosa y gratuita, diseñada para detectar rangos del mercado, dibujar zonas precisas de soporte y resistencia, e identificar oportunidades de ruptura con precisión y estilo.
Forma parte del proyecto Break Out Explosion, ofreciendo una solución confiable y visualmente avanzada tanto para principiantes como para traders profesionales. Si estás interesado en estrategias de ruptura, consulta la herramienta avanzada diseñada pa
FREE

Indicador avanzado SMC & Volumetric Order Block Visión general
Este indicador mejorado para MetaTrader 5 está diseñado para decodificar el comportamiento del mercado utilizando el método Smart Money Concepts (SMC) . Va más allá del análisis estándar de la acción del precio mediante la integración de datos volumétricos directamente en la estructura del mercado, ayudando a los operadores a identificar con precisión las zonas de reversión y continuación de alta probabilidad. Características princi
FREE
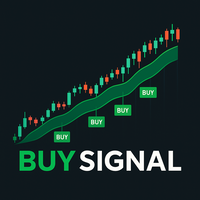
Este indicador ha sido desarrollado como una herramienta de análisis basada en medias móviles exponenciales . Su función es proporcionar información adicional sobre la dinámica del mercado mediante el uso de dos medias móviles exponenciales (EMA) y una media móvil exponencial suavizada (SMMA) . El indicador puede aplicarse en distintos activos financieros y marcos temporales, según las preferencias del usuario. Algunos operadores lo utilizan en gráficos de 30 segundos , complementándolo con un g
FREE
Special offer : ALL TOOLS , just $35 each! New tools will be $30 for the first week or the first 3 purchases ! Trading Tools Channel on MQL5 : Join my MQL5 channel to update the latest news from me Descripción general
OA SnR Power es una herramienta poderosa diseñada para ayudar a los traders a identificar y evaluar la fortaleza de los niveles de soporte y resistencia. Al incorporar factores clave como el volumen de operaciones, la frecuencia de rebote y el recuento de pruebas, es
FREE
GRATIS Heiken Ashi Smoothed indicador es totalmente ajustable, fácil de usar y viene con la posibilidad de acceder al indicador a través de la función iCustom para que pueda utilizarlo en su propio software de comercio. El indicador también puede mostrar alertas cuando la señal cambia o enviar notificaciones push. Para la versión Metatrader 4 haga clic aquí: https: //www.mql5.com/en/market/product/70824 Para obtener información detallada, haga clic: >>AQUÍ<< Características
Fácil de usar Accesi
FREE

El indicador muestra ganancias (pérdidas) en el símbolo actual. Puede arrastrar y soltar libremente la línea para mostrar la ganancia o pérdida actual.
Puedes encontrar mis productos aquí
Parámetros Calculation in money or in points — calcula la ganancia/pérdida en puntos o en dinero. Add pending orders to calculate — tenga en cuenta las órdenes pendientes en los cálculos. Magic Number (0 - all orders on symbol) — número mágico, si es necesario evaluar órdenes específicas. Offset for first
FREE

¿Quieres convertirte en un trader de 5 estrellas constantemente rentable? 1. Lee la descripción básica de nuestro sencillo trading sistema y y su mayor actualización de estrategia en 2020 2. Envíe una captura de pantalla de su compra para obtener su invitación personal a nuestro exclusivo chat de trading
Tendencia Forex Muestra la dirección de la tendencia, la duración, la intensidad y la calificación de la tendencia resultante para todos los marcos temporales en tiempo real.
De un solo vistaz

El indicador funciona para convertir el volumen normal en niveles y determinar los puntos de control de la liquidez financiera.
Su funcionamiento es muy similar al del Perfil de Volumen Fijo.
Pero se considera más preciso y fácil de usar que el que se encuentra en Trading View porque calcula los volúmenes de negociación completos en cada vela y en todos los brokers presentes en MetaTrade, a diferencia de lo que se encuentra en Trading View, ya que sólo mide los precios mostrados del broker.
FREE

Esta es la última iteración de mi famoso indicador, Reversal Fractals, publicado por primera vez hace casi una década. Examina la estructura de precios de los fractales para determinar posibles puntos de reversión en el mercado, proporcionando sincronización a los operadores posicionales que ya tienen un modelo de valoración fundamental o técnico. [ Guía de instalación | Guía de actualización | Solución de problemas | FAQ | Todos los productos ] Los fractales de reversión pueden iniciar tendenc
FREE

Símbolos: USDCHF, USDJPY, XAUUSD, GBPUSD, EURUSD, AUDUSD, GBPJPY ( Amo USDCHF_H1 )
Marcos de tiempo: M15, H1, H4, D1
Características importantes: Sin repintado, sin retraso, señal direccional, múltiples confirmaciones
Seguridad: Las señales incluyen stop loss, take profit y respetan la regla de riesgo-beneficio
Incluye: Escáner de múltiples marcos de tiempo gratuito (Después de comprar este producto, simplemente envíeme una captura de pantalla por mensaje privado y le enviaré personalmente e

El indicador Quantum VPOC se ha desarrollado para ampliar el estudio bidimensional del volumen y el precio a uno tridimensional que abarca el tiempo. La relación volumen/precio/tiempo proporciona entonces una visión real del funcionamiento interno del mercado y el latido del sentimiento y el riesgo que impulsa la acción del precio en consecuencia. El indicador Quantum VPOC muestra la siguiente información clave en el gráfico: Perfil de volumen: aparece como un histograma de volumen en el eje ver

Indicador Crypto_Forex HTF Oscilador RVI para MT5, sin repintado.
- Mejore sus métodos de trading con el oscilador profesional HTF RVI para MT5. HTF significa - Marco temporal superior. - RVI es uno de los mejores osciladores para la detección de cambios de tendencia y la entrada desde áreas de sobrecompra/sobreventa. - Este indicador es excelente para sistemas de trading de marco temporal múltiple con entradas de acción del precio desde áreas de sobrecompra/sobreventa. - El indicador HTF RVI

Ultimate SMC: Indicador Profesional Smart Money Concepts Descubra los movimientos ocultos del mercado. Opere con las instituciones, no contra ellas. El indicador Ultimate SMC está diseñado para operadores serios que desean aplicar los Conceptos de Dinero Inteligente (SMC) a sus gráficos de forma automática. El análisis SMC manual requiere mucho tiempo y es propenso a errores subjetivos. Esta herramienta elimina las conjeturas detectando algorítmicamente Bloqueos de Órdenes, Gaps de Valor Justo y
FREE
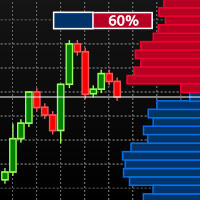
Visual Book on Chart es un indicador diseñado especialmente para los mercados de acciones y futuros. Para comprobar si puedes utilizar la herramienta con tu bróker, abre la Profundidad de Mercado (Depth of Market) en tu terminal MT5 y verifica si hay datos de precios y volúmenes disponibles. Aprende más sobre la Profundidad de Mercado de MT5 en la página oficial. El indicador muestra los datos de profundidad de mercado en la ventana del gráfico y utiliza un degradado basado en esos datos para c
FREE

Smart Structure Concepts MT5 es un indicador de Smart Money Concepts todo en uno, creado para ayudar a los traders a identificar la estructura institucional del mercado y comprender por qué ocurre cada movimiento. A diferencia de la mayoría de indicadores del Market, este sistema no solo dibuja patrones o zonas. Enseña.
Cada elemento visual (BOS, CHoCH, OB, FVG, EQH, EQL, PDH, PDL, etc.) incluye tooltips educativos que explican el concepto y la acción sugerida para el operador (comprar, vender
FREE

Hull Moving Average (HMA) es merecidamente popular entre los comerciantes debido a la media eficaz del ruido del mercado y un retraso relativamente pequeño. La versión actual de MetaTrader 5 cambia de color cuando cambia la dirección del movimiento. Dispone de señales sonoras y de texto. También soporta el envío de correo electrónico y mensajes push. Es posible activar una señal en la barra incompleta actual, aunque dicha señal puede cancelarse antes de completarse si las condiciones ya no son a
FREE

Tendencia del oro : se trata de un buen indicador técnico bursátil. El algoritmo del indicador analiza el movimiento del precio de un activo y refleja la volatilidad y las posibles zonas de entrada.
Las mejores señales del indicador:
- Para VENTA = histograma rojo + puntero rojo CORTO + flecha amarilla de señal en la misma dirección + flecha roja de dirección de tendencia . - Para COMPRA = histograma azul + puntero azul LARGO + flecha de señal aqua en la misma dirección + flecha azul de dire

Bandas de gravedad
Una poderosa estructura de mercado, impulso y tendencia todo en uno para cualquier trader intradía. ¡Atención sólo se venden 10 copias a 79 USD! Próximo precio 99 USD. Con el indicador obtendrá un plan de trading mecánico completo y un código EA gratuito para automatizar su trading ¡Contáctenos después de comprar el indicador! El indicador de bandas de gravedad está diseñado para los comerciantes que quieren claridad - no ruido.
Tanto si hace scalping como day-trade, esta herr
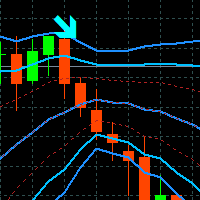
Indicador Tyr Bands
Tyr Band funciona con BB y 3 desviaciones diferentes, más la confirmación del Estocástico. Así, cuando el precio cierra por debajo/por encima de la BB Reversal Band (Roja) y el Estocástico está en la zona de confirmación, entonces aparece la flecha (compra/venta). Esta flecha indica que podemos entrar al mercado al alza/baja en la próxima apertura. Como es sólo un indicador, no colocará SL o TP, necesitamos tenerlos colocados manualmente si queremos operar. El SL se situará
FREE

Presentamos el Quantum Heiken Ashi PRO Diseñadas para brindar información clara sobre las tendencias del mercado, las velas Heiken Ashi son reconocidas por su capacidad para filtrar el ruido y eliminar las señales falsas. Diga adiós a las confusas fluctuaciones de precios y dé la bienvenida a una representación gráfica más fluida y confiable. Lo que hace que Quantum Heiken Ashi PRO sea realmente único es su fórmula innovadora, que transforma los datos de velas tradicionales en barras de colore

El indicador de divergencia MACD encuentra divergencias entre el gráfico de precios y el indicador MACD y le informa con alertas (popup, notificación móvil o correo electrónico) . Su uso principal es encontrar cambios de tendencia en el gráfico. Utilice siempre los indicadores de divergencia con otros activos técnicos como zonas de resistencia de soporte, patrones de velas y la acción del precio para tener una mayor posibilidad de encontrar cambios de tendencia. Tres tipos de confirmación para l
FREE

Cuenta atrás de la hora de las velas Por BokaroTraderFx El Indicador de Cuenta Atrás del Tiempo de Velas es una herramienta versátil diseñada para la plataforma de operaciones MetaTrader 5 (MT5). Proporciona a los operadores una cuenta atrás visual del tiempo restante para la vela actual en un gráfico. Las características clave incluyen:
Posición personalizable: Coloque el temporizador de cuenta atrás en cualquier esquina del gráfico para una visibilidad óptima. Color del texto por defecto: Se
FREE

VM Heiken Ashi Pro
Heiken-Ashi suavizado (HMA o EMA) para filtrar el ruido y generar señales claras de BUY/SELL, no repinta (opcional ConfirmOnClosedBar). Muestra velas HA en el gráfico (las velas originales se pueden ocultar), colocación de flechas por ATR o desplazamiento fijo, envía alertas (popup, email, push) con manejo anti-spam. Propósito principal
Convertir velas crudas en Heiken-Ashi suavizadas para detectar cambios de color (bear a bull / bull a bear) y dibujar flechas para las entr

El indicador SMC Market Structure rastrea los cambios clave en la acción del precio utilizando Smart Money Concepts (SMC), ayudando a los operadores a identificar el comportamiento institucional y la dirección general de la tendencia.
Detecta y muestra automáticamente: Ruptura de Estructura (BOS) - Señala la continuación de la tendencia Cambio de Carácter (CHOCH) - Indica una potencial reversión Swing Highs and Lows - Se utiliza para definir la estructura del mercado y el sesgo direccional
Cada
FREE

Institutional Tick Engine Lite: Herramienta de Velocidad de Ticks y Reversión Institutional Tick Engine Lite es un indicador técnico diseñado para analizar la velocidad del mercado y la lógica de la microestructura utilizando datos de ticks en bruto. Como versión de entrada de la suite profesional, procesa datos en tiempo real para proporcionar métricas para scalping y trading intradía. Características Incluidas Monitor de Velocidad de Ticks: Histograma en tiempo real que muestra "Ticks Por Segu
FREE

Dark Breakout es un indicador para operaciones intradía. Este indicador se basa en la estrategia de seguimiento de la tendencia , proporcionando una señal de entrada en la ruptura. La señal es proporcionada por la flecha, que confirma la ruptura del nivel. Podemos entrar en buen precio con este indicador, con el fin de seguir la tendencia principal en el instrumento actual. Se aconseja utilizar brokers ECN de bajo spread. Este Indicador no repinta y no tiene lag . Los plazos recomendados son M5
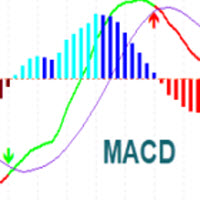
Indicador MACD Tiene una línea MACD, una línea de señal y un histograma. El Histograma tiene 4 colores basados en la Dirección Por Encima y Por Debajo de la Línea Cero, mostrando su dirección de movimiento lo más simple posible. Permite mostrar la línea MACD y la línea de señal, mostrar el cambio de color de la línea MACD basado en el cruce de la línea de señal. Mostrar puntos en el cruce del MACD y la línea de señal, activar y desactivar el histograma. Disfrute de su experiencia comercial, y n
FREE

Bienvenido a nuestro patrón de onda de precios MT5 --(Patrón ABCD)-- El patrón ABCD es un patrón comercial poderoso y ampliamente utilizado en el mundo del análisis técnico.
Es un patrón de precio armónico que los comerciantes utilizan para identificar oportunidades potenciales de compra y venta en el mercado.
Con el patrón ABCD, los operadores pueden anticipar posibles movimientos de precios y tomar decisiones informadas sobre cuándo ingresar y salir de las operaciones. Versión EA: Pri
FREE
El Mercado MetaTrader es una plataforma única y sin análogos en la venta de robots e indicadores técnicos para traders.
Las instrucciones de usuario MQL5.community le darán información sobre otras posibilidades que están al alcance de los traders sólo en nuestro caso: como la copia de señales comerciales, el encargo de programas para freelance, cuentas y cálculos automáticos a través del sistema de pago, el alquiler de la potencia de cálculo de la MQL5 Cloud Network.
Está perdiendo oportunidades comerciales:
- Aplicaciones de trading gratuitas
- 8 000+ señales para copiar
- Noticias económicas para analizar los mercados financieros
Registro
Entrada
Si no tiene cuenta de usuario, regístrese
Para iniciar sesión y usar el sitio web MQL5.com es necesario permitir el uso de Сookies.
Por favor, active este ajuste en su navegador, de lo contrario, no podrá iniciar sesión.