MetaTrader 5용 기술 지표 - 5
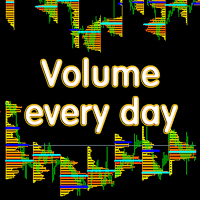
Основные отличия и преимущества индикатора Volume every day от похожего продукта Volume Profile V6 В Volume every day можно параметром Range period задать временной диапазон построения профиля, а параметром Range count задать количество профилей данных диапазонов. Например, на втором скрине Range period=1Day, а Range count=10 - это значит, что профиль будет строиться на периоде один день, десять последних дней. Важно, что переключение тайм фрейма графика не влияет на построение профиля, что т

KT Custom High Low shows the most recent highs/lows by fetching the data points from multi-timeframes and then projecting them on a single chart. If two or more highs/lows are found at the same price, they are merged into a single level to declutter the charts.
Features
It is built with a sorting algorithm that declutters the charts by merging the duplicate values into a single value. Get Highs/Lows from multiple timeframes on a single chart without any fuss. Provide alerts when the current pri

This indicator obeys the popular maxim that: "THE TREND IS YOUR FRIEND" It paints a GREEN line for BUY and also paints a RED line for SELL. (you can change the colors). It gives alarms and alerts of all kinds. IT DOES NOT REPAINT and can be used for all currency pairs and timeframes. Yes, as easy and simple as that. Even a newbie can use it to make great and reliable trades. NB: For best results, get my other premium indicators for more powerful and reliable signals. Get them here: https://www.m
FREE

초보자 또는 전문가 트레이더를 위한 최고의 솔루션!
이 지표는 우리가 독점 기능과 새로운 공식을 통합했기 때문에 독특하고 고품질이며 저렴한 거래 도구입니다. 단 하나의 차트로 28 Forex 쌍의 통화 강도를 읽을 수 있습니다! 새로운 추세 또는 스캘핑 기회의 정확한 트리거 포인트를 정확히 찾아낼 수 있기 때문에 거래가 어떻게 개선될지 상상해 보십시오.
사용 설명서: 여기를 클릭 https://www.mql5.com/en/blogs/post/697384
그것이 첫 번째, 원본입니다! 쓸모없는 지망생 클론을 사지 마십시오.
더 스페셜 강력한 통화 모멘텀을 보여주는 하위 창의 화살표 GAP가 거래를 안내합니다! 기본 또는 호가 통화가 과매도/과매도 영역(외부 시장 피보나치 수준)에 있을 때 개별 차트의 기본 창에 경고 표시가 나타납니다. 통화 강도가 외부 범위에서 떨어질 때 풀백/반전 경고. 교차 패턴의 특별 경고
추세를 빠르게 볼 수 있는 다중 시간 프레임 선택이 가능합
The SyntheticaFX Pain & Gain Spike Indicator is a specialized tool designed to identify potential spike opportunities in the market, exclusively for traders focusing on Weltrade Pain and Gain pairs. This indicator is optimized to operate on the 1-minute (M1), 2-minute (M2), 3-minute (M3), and 5-minute (M5) timeframes and supports only the following pairs: PainX 1200, PainX 999, PainX 800, PainX 600, PainX 400, GainX 1200, GainX 999, GainX 800, GainX 600, and GainX 400. It will not display signal

기능
피보나치 리트레이스먼트 트레이딩을 위한 지표 1H, 4H, 1D 및 1W 중에서 선택한 이전 바를 기반으로 피보나치 차트가 그려집니다. 시장 가격이 피보나치 레벨에 닿으면 색상이 변경되고 닿은 시간이 표시됩니다. -23.6, 0, 23.6, 38.2, 50, 61.8, 76.4, 100 및 123.6 레벨에 피보나치 그래프가 그려지며, 바가 업데이트될 때마다 차트가 새로 고침됩니다.
변수
타임프레임: 1H, 4H, 1D 및 1W 중에서 선택한 타임프레임으로 피보나치 차트가 그려집니다. FiboWidth: 레벨의 두께를 결정합니다. FiboStyle: 피봇 레벨의 스타일을 설정합니다. TouchedColor: 닿았을 때 변경되는 색상입니다.
오류가 있거나 개선 사항이 있다면 의견을 남겨주세요. 평가는 개발자에게 큰 도움이 됩니다. 만족하셨다면 5성을 부여해 주시기 바랍니다.
FREE

N/B: All our product purchase comes with our free ‘’DAILY SCALPER EA’’ - bit.ly/4qlFLNh Whatsapp Developer for yours after successful purchase SUPREME PRECISION TRADER SCANNER
Your All-in-One Market Scanner for High-Probability Trades Across All Timeframes (M5–H4)
---
WHY THIS SCANNER IS A GAME-CHANGER
Most traders spend hours analyzing charts, hunting for setups, and still miss high-probability trades.
The Supreme Precision Trader Scanner does all the heavy lifting for you — scann
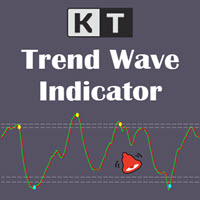
KT Trend Wave is an oscillator based on the combination of Price, Exponential, and Simple moving averages. It usually works great to catch the short term price reversals during the ongoing trending market. The bullish and bearish crossovers of the main and signal lines can be used as buy/sell signals (blue and yellow dot). It can also be used to find the overbought and oversold market. The buy and sell signals that appear within the overbought and oversold region are usually stronger.
Features

KT CCI Divergence shows the regular and hidden divergence created between the price and CCI oscillator. Divergence is one of the vital signals that depicts the upcoming price reversal in the market. Manually spotting the divergence between price and CCI can be a hectic and ambiguous task.
Limitations of KT CCI Divergence
Using the CCI divergence as a standalone entry signal can be risky. Every divergence can't be interpreted as a strong reversal signal. For better results, try to combine it w
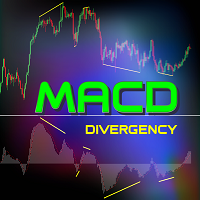
이 지표는 지수이동평균(EMA) 기간을 5(빠름)와 34(느림), 신호선 기간을 5로 설정하여 가격 움직임과 MACD 히스토그램 간의 강세 및 약세 다이버전스를 정확하게 식별합니다. 지표는 모멘텀이 약화되는 지점을 강조 표시하여 잠재적 추세 반전을 알립니다. 올바른 다이버전스 식별 규칙: 강세 다이버전스는 가격이 더 낮은 저점을 형성하면서 MACD 히스토그램이 동시에 0선 위에서 더 높은 저점을 형성할 때 유효합니다. 약세 다이버전스는 가격이 더 높은 고점을 형성하면서 MACD 히스토그램이 동시에 0선 아래에서 더 낮은 고점을 형성할 때 유효합니다. 히스토그램의 극값과 가격의 극값이 0선의 같은 쪽에 있지 않으면 다이버전스 신호는 무효로 간주되며, 이는 잘못된 신호를 초래할 수 있습니다. 이 접근법은 MACD 다이버전스 분석을 적용하는 가장 정확하고 신뢰할 수 있는 방법을 제시합니다. 지표 특징: 확인된 강세 및 약세 다이버전스를 명확하게 표시합니다. 신뢰성을 높이기 위해 MACD
FREE

Also check my premium spikes bot: https://www.mql5.com/en/market/product/142350 Also check my premium spikes bot: https://www.mql5.com/en/market/product/142350 Also check my premium spikes bot: https://www.mql5.com/en/market/product/142350 MEGASPIKES BOOM AND CRASH v1.32 NB: source codes of this indicator are available: PM me: https://t.me/Machofx PLEASE JOIN THE CHANNEL BELOW TO HAVE ACCESS TO ALL PREVIOUS VERSIONS check out Spikes robot
BoomCrash Cheatcode EA : https://www.mql5.com/en/ma
FREE

40% off. Original price: $50
Advanced Bollinger Bands Scanner is a multi symbol multi timeframe Bollinger bands dashboard that monitors and analyzes the Bollinger Bands indicator from one chart. This panel scans the Bollinger bands indicator in up to 28 configurable instruments and 9 timeframes for price overbought/oversold, price consolidation (Bollinger bands squeeze), and consolidation breakout (squeeze break) with a deep scan feature to scan all market watch symbols (up to 1000 instrument

The Oracle is the perfect companion for traders who need accurate market analysis without managing multiple indicators.
While most indicators show single-perspective signals, The Oracle merges scientifically proven methods with proprietary enhancements into one consensus histogram. Seven models, including our Ultimate Flow Index (UFI) with Ehlers smoothing algorithms, vote independently every bar.
When enough models agree threshold you set from 4/7 aggressive to 7/7 conservative—direction be
FREE

ATR Progress Control
Trading is all about probability, and if you don't know how much range the price has left today, you're trading blind.
This indicator is your dashboard that answers the most important question before a trade: does it make mathematical sense to enter the market right now? It's a tool for professional volatility analysis that helps filter out false entries and avoid trades when the move is already exhausted.
What's the problem?
Imagine that the average daily movement (ATR

Advanced ideas of the popular MACD indicator: It detects and displays classic and reverse divergences (two methods of detecting divergences). It uses different color to highlight an uptrend and a downtrend. Two methods of determining a trend: а) MACD crosses the 0 level (classic signal); б) MACD crosses its own average (early signal). This is a multi-timeframe indicator: it can display MACD data from other timeframes. Two methods of drawing: classic histogram and line. It generates sound and vis

Auto Fibo 는 수동 거래를 향상시키기 위해 개발된 지표입니다. 자동으로 황금 비율을 그려 시간을 절약하고 거래를 촉진합니다. 지표를 그래프에 부착하면 정확한 황금 비율이 자동으로 그려지므로 임계점을 찾아야 하는 수고를 덜 수 있습니다. 인터페이스는 컴퓨터에 따라 밴드의 대략적인 고점과 저점으로 조정됩니다. 이 표시기는 대부분의 시작 및 끝 지점 선택 오류를 수정합니다. 각 밴드에 대해 정확한 가격이 표시됩니다. 警告 私はMQL5.com으로 私のEAを販売するだけ입니다.もし誰かが私のEAを売ってくれと連絡してきたら、それはああにの金が また、もしあなたが私のEAを 外部のウェブサイトから購入した場合、それ는 偽의 바 죤으로 あ り, original의 ゝ と 同じ よ に は 動作 ないこ
FREE

VM Trend Candles Indicator - Complete Trend Trading Solution Trend Candles Indicator is a professional, intuitive, and easy-to-use Forex trading system designed to transform complex trend analysis into clear, high-probability trading signals. Based on proven trend-following principles and enhanced with intelligent market filtering, the indicator provides accurate BUY/SELL signals together with automatically calculated Stop Loss and Take Profit levels according to market volatility. The system su

RSI(상대강도지수) 지표의 다중 통화 및 다중 시간대 수정. 매개변수에서 원하는 통화와 기간을 지정할 수 있습니다. 또한 패널은 과매수 및 과매도 수준을 넘을 때 알림을 보낼 수 있습니다. 마침표가 있는 셀을 클릭하면 해당 기호와 마침표가 열립니다. MTF 스캐너입니다.
차트에서 대시보드를 숨기는 키는 기본적으로 "D"입니다.
통화 강도 측정기(CSM)와 마찬가지로 대시보드는 지정된 통화가 포함된 쌍 또는 해당 통화가 기본 통화로 포함된 쌍을 자동으로 선택할 수 있습니다. 표시기는 "쌍 집합"에 지정된 모든 쌍에서 통화를 검색합니다. 다른 쌍은 무시됩니다. 그리고 이 쌍을 기반으로 이 통화의 총 RSI가 계산됩니다. 그리고 그 통화가 얼마나 강하거나 약한지 알 수 있습니다.
매개변수 RSI Period — 평균 기간. RSI Applied price — 가격 유형. Clear the chart at startup — 시작 시 차트를 지웁니다 Set of Pairs — 기

Real Trend Zigzag PRO shows the real trend of a market, u nlike the default Zigzag indicator. It calculates the trend in real time and shows green lines for upwards trends, red lines for downward trends and blue lines for no trends. Regarding the old slogan "the trend is your friend" it helps you to decide if should open a buy or sell position. The PRO version is a multi timeframe zigzag (MTF). Means, it shows the trend of the current timeframe as well as the trend of a higher or lower time.

CRUDE OIL BUY/SELL (3 Min) Technical Overview The CRUDE OIL BUY/SELL indicator is designed for short-term traders focusing on crude oil price movements.
It identifies high-probability buying and selling opportunities based on a combination of RSI levels , SMA trend positioning , and candle structure analysis .
This tool is particularly effective on the 3-minute timeframe , providing clear visual signals and alerts for both momentum continuation and potential reversals. How It Works The indicator

The Golden PainX and GainX Spike Indicator is a cutting-edge, AI-powered trading tool engineered exclusively for the synthetic indices market. It masterfully combines proprietary spike detection algorithms and real-time price action analysis to generate high-probability, non-repainting trade signals with exceptional accuracy. Important( Use only on PainX 400and GainX 400 (M1 one minute timeframe) Identifies high-probability spikes with non-repainting buy/sell arrows. Automatically sets profit t

INDICATOR: GEN TriFactaX Developer: gedeegi General Description GEN TriFactaX is a technical indicator designed to automatically identify and visualize the 1-2-3 Pattern or price reversal pattern. This pattern is a classic price action formation frequently used by traders to detect potential trend reversals. This indicator not only displays the 1-2-3 pattern on the chart but also automatically identifies the breakout signal from the critical level (point 2) and projects Entry, Stop Loss (SL), a

FREE Heiken Ashi Smoothed indicator is fully adjustable, easy to use and comes with possibility to access the indicator via iCustom function so you can use it in your own trading software. Indicator can also pop up alerts when signal changes or send push notifications. For Metatrader 4 version click here: https://www.mql5.com/en/market/product/70824 For detailed information click: >>HERE<< Features
Easy to use Accessible via iCustom Fully adjustable Alerts and Push notifications Possib
FREE

차트에 수동으로 피보나치 레벨을 그리는 데 지쳤습니까? 거래에서 주요 지지선과 저항선을 식별할 수 있는 편리하고 효율적인 방법을 찾고 계십니까? 더 이상 보지 마세요! 자동 피보나치 수준 을 수행하는 최고의 MetaTrader 5 지표인 DrawFib Pro를 소개합니다. 차트에 그림을 그리고 이러한 수준이 위반되면 적시에 경고를 제공합니다. DrawFib Pro를 사용하면 거래 전략을 강화하고 시간을 절약하며 정보에 입각한 결정을 내릴 수 있습니다. 내 피보나치 기반 지표 : Advanced Gartley Pattern MT5 || Price Wave Pattern MT5 주요 특징들:
자동화된 피보나치 그리기. 사용자 지정 가능한 매개변수. 정확 하고 신뢰할 수 있음. 실시간 알림. 사용자 친화적인 인터페이스. DrawFib Pro는 효율적이고 신뢰할 수 있으며 사용자 친화적인 방식으로 차트에 피보나치를 자동으로 그리
FREE
Indicator Description Range Filter Pro is a sophisticated trading tool for XAUUSD (Gold) that combines adaptive price filtering with volume analysis and real-time market monitoring. Designed for both novice and professional traders, this indicator helps identify trend direction, potential reversals, and significant market movements through its multi-layered approach.
Key Components 1.Dynamic Range Filter 2.Volatility-Adjusted Bands 3.Volume-Enhanced Candles 4.Professional Trading Dashboard 5.M
FREE

This indicator shows Fractal Breakout Trendlines and Support and Resistance
The Fractal Ascending Trendline and Fractal Descending Trendline are drawn from the last valid fractals. Breakouts can be taken above or below these trendlines. Horizontal lines are drawn from the Last upper and Last lower fractal to show support and resistance levels. Horizontal Upper and Lower Intersection lines are drawn where a fractal trendline has been last intersected, to show where to place a buy or sell order
FREE

Step into the world of Forex trading with confidence, clarity, and precision using Gold Indicator a next-generation tool engineered to take your trading performance to the next level. Whether you’re a seasoned professional or just beginning your journey in the currency markets, Gold Indicator equips you with powerful insights and help you trade smarter, not harder. Built on the proven synergy of three advanced indicators, Gold Indicator focuses exclusively on medium and long-term trends elimina

Identify precise entry and exit points with AB=CD patterns
This indicator finds AB=CD retracement patterns. The AB=CD Retracement pattern is a 4-point price structure where the initial price segment is partially retraced and followed by an equidistant move from the completion of the pullback, and is the basic foundation for all harmonic patterns. [ Installation Guide | Update Guide | Troubleshooting | FAQ | All Products ]
Customizable pattern sizes
Customizable AC and BD ratios Customizable b

Advanced SMC & Volumetric Order Block Indicator Overview
This enhanced-grade for MetaTrader 5 indicator is designed to decode market behavior using Smart Money Concepts (SMC) method . It goes beyond standard price action analysis by integrating Volumetric Data directly into market structure, helping traders identify high-probability reversal and continuation zones with precision. Key Features Volumetric Order Blocks: A unique, split-gauge visualization within Order Block zones that disp
FREE
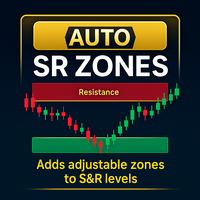
S/R 존 - MetaTrader 5용 제품 개요 개요 지지/저항 존 은 MetaTrader 5(MT5)용 직관적인 인디케이터로, 차트의 수평선 주위에 사용자 지정 pip 거리로 정의된 커스터마이징 가능한 존을 자동으로 생성하여 기술적 분석을 향상시킵니다. 이 존은 주요 지지와 저항 영역을 시각적으로 강조하여 트레이더가 주요 가격 범위와 잠재적 반전 지점을 빠르게 식별할 수 있도록 돕습니다. 주요 기능 동적 존 생성 : 수평선 주위에 존을 자동으로 생성하며, 존의 너비를 정의하는 pip 거리(기본값: 10 pip)를 조정할 수 있습니다. 지지 및 저항 식별 : 현재 가격과 선의 상대적 위치에 따라 존을 색상으로 구분(지지: 라임그린, 저항: 토마토)하여 빠른 시각적 인식을 제공합니다. 커스터마이징 가능한 외관 : 존의 투명도(0-255), 색상, 선택적 지지/저항 라벨의 폰트 크기 및 색상을 조정할 수 있습니다. 라인 필터링 : 사용자 정의 접두사를 통해 수평선을 선택적으로 필터링하
FREE

Dark Power is an Indicator for intraday trading. This Indicator is based on Trend Following strategy, also adopting the use of an histogram to determine the right power . We can enter in good price with this Indicator, in order to follow the strong trend on the current instrument. The histogram is calculated based on the size of the bars and two moving averages calculated on the histogram determine the direction of the signal
Key benefits
Easily visible take profit/stop loss lines Intui

The indicator is intended for recognition and marking 1-2-3 buy and sell patterns on a chart. The indicator will help a trade to determine the starting and signal fractals, and to specify the possible entry points on all timeframes in МetaTrader 5. Fibonacci lines are drawn on the chart to indicate supposed targets of moving on the basis of the wave theory. The 1-2-3 formations appear to be especially important as divergences (convergences) are formed on price tops and bottoms. The indicator has
FREE
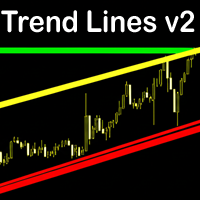
Trend Lines v2 MT5 is an intelligent auto trendline indicator that instantly detects key dynamic support and resistance zones. Built on pivot high/low structure, it delivers a clear and accurate view of market trends across all timeframes. Features Fully automatic trendline drawing based on precise pivot points. Filters out noise – only clean and reliable trendlines are shown. Control the number of lines to keep your chart neat and easy to read. Flexible customization: colors, line thickness, ra
FREE
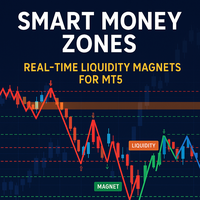
Developed according to the principles of smart money management strategies, the SM Zones indicator is a very convenient tool for traders on the MetaTrader 5 (MT5) platform. It graphically displays on the chart all the significant zones used in the SM strategy: market structure, price levels of increased liquidity, "price magnet" zones - imbalances, order blocks, fvg, breaker blocks and mitigation blocks - towards which the instrument's price moves. The zones influencing the bull market are high
FREE

Do you know VWAP Bands? It is an indicator used to identify support and resistance points from the daily VWAP and you can use it to check the best entry and exit points. This indicator does not use the principle of bollinger bands. There is a difference in the calculation method. Use it according to your strategy. See the applications and what results you can get. The indicator is free and can be used on any account.
FREE

The indicator works to convert normal volume into levels and determine financial liquidity control points.
It is very similar in function to Fixed Volume Profile.
But it is considered more accurate and easier to use than the one found on Trading View because it calculates the full trading volumes in each candle and in all the brokers present in MetaTrade, unlike what is found in Trading View, as it only measures the broker’s displayed prices.
To follow us on social media platforms:
telegram
FREE

표시기는 현재 기호에 이익(손실)을 표시합니다. 라인을 자유롭게 드래그 앤 드롭하여 현재 손익을 표시할 수 있습니다.
You can find my products here
매개변수 Calculation in money or in points — 포인트나 돈으로 이익/손실을 계산합니다. Add pending orders to calculate — 계산 시 지정가 주문을 고려하세요. Magic Number (0 - all orders on symbol) — 기호의 모든 주문) — 특정 주문을 평가하는 데 필요한 경우 매직 넘버입니다. Offset for first drawing (points from the average price) — 첫 번째 시작 시 평균 가격의 라인 오프셋입니다. Decimal places for calculating the Sum — 합계를 표시하기 위한 소수점 뒤의 자릿수입니다. Decimal places for calculating the Perc
FREE

The Clean Trading Sessions indicator shows the most significant trading sessions for the Forex market, such as London, New York, Tokyo. The Clean Trading Sessions indicator is a simple and, at the same time, quite functional Forex sessions indicator, developed for the MT5 terminal. It is available to download for free.
How is this Forex market session indicator used? Traders normally use trading sessions to determine the volatile hours throughout the day, since the trading activities vary
FREE
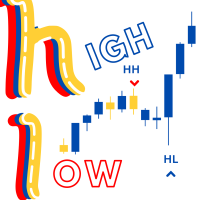
Swing High/Low Identifier
The Swing High/Low Identifier is a custom MetaTrader 5 (MT5) indicator designed to highlight significant swing points on your chart. This indicator identifies and marks swing highs and swing lows based on a configurable range of bars.
- Swing Highs are marked with red arrows above the respective candles. - Swing Lows are marked with blue arrows below the respective candles.
This tool helps traders quickly spot important price levels and patterns, which c
FREE

Currency RSI Scalper MT5는 널리 사용되는 RSI(Relative Strength Index) 지표를 기반으로 하는 전문 지표입니다. RSI 지표는 시장의 간격에 대해 잘 작동하지만 시장 상황이 변할 때 수익성있는 신호를 생성하지 못하므로 큰 손실을 초래하는 잘못된 신호를 생성합니다. 시장 상황에 따라 적응하는 적응형 RSI 지표에 대해 생각해 본 적이 있습니까? 제시된 지표는 최고의 과매수 및 과매도 수준을 찾는 최적화 알고리즘을 구현합니다. 이를 통해 Currency RSI Scalper는 끊임없이 변화하는 시장에 적응할 수 있습니다. 매수 또는 매도 신호가 나타나면 차트에 화살표가 그려지고 경고가 발생하여 적시에 포지션을 열고 항상 PC에 앉아 있는 것을 피할 수 있습니다. Currency RSI Scalper는 통화(암호화폐 포함) 및 바이너리 옵션 거래에 적합합니다.
Currency RSI Scalper를 선택하는 이유 지표는 스캘핑 및 일중 거래에 적

Free automatic Fibonacci is an indicator that automatically plots a Fibonacci retracement based on the number of bars you select on the BarsToScan setting in the indicator. The Fibonacci is automatically updated in real time as new highest and lowest values appears amongst the selected bars. You can select which level values to be displayed in the indicator settings. You can also select the color of the levels thus enabling the trader to be able to attach the indicator several times with differe
FREE

러시아어 설명서 / 영어 설명서 / MT4 버전 주요 기능: 판매자와 구매자의 활동 영역을 표시합니다! 이 지표는 매수 및 매도에 대한 모든 올바른 첫 번째 임펄스 레벨/존을 표시합니다. 진입점 검색이 시작되는 이러한 레벨/존이 활성화되면 레벨의 색상이 바뀌고 특정 색상으로 채워집니다. 상황을 더욱 직관적으로 파악할 수 있도록 화살표도 표시됩니다. LOGIC AI - 템플릿 활성화 시 진입점 검색을 위한 영역(원) 표시 시각적 명확성을 개선하기 위해 인공지능을 사용하여 진입점을 검색한 영역을 표시하는 기능이 추가되었습니다. 더 높은 시간대의 레벨/존 표시(MTF 모드) 더 높은 시간 간격을 사용하여 레벨/존을 표시하는 기능이 추가되었습니다. 또한, 이 지표는 자동 추세 감지 기능( TPSproTREND PRO )을 구현했습니다. 거래를 위한 별도의 전문적인 단계별 알고리즘 이 알고리즘은 추세 방향과 반대 방향으로의 당일 거래 모두에 적합하도록 설계되었습니다. 각

Range Explosion 소개 Range Explosion은 시장 범위를 감지하고, 정확한 지지선과 저항선을 그리며, 돌파 기회를 정확하게 식별하는 강력하고 무료인 트레이딩 도구입니다.
Break Out Explosion 프로젝트의 일부로서, 초보자와 전문가 모두에게 신뢰할 수 있는 고급 시각적 솔루션을 제공합니다. 추세선 돌파 개념에 관심이 있다면, 주요 추세 방향의 돌파를 감지하는 고급 도구를 확인해 보세요:
https://www.mql5.com/en/market/product/152676 이 지표의 화살표를 기반으로 거래하는 EA를 원하시나요? 아래 링크를 통해 $30 에 직접 작업을 생성하시면 제가 만들어드리겠습니다:
https://www.mql5.com/en/job/new?prefered=eeecad Break Out Explosion 프로젝트 의 최신 소식과 업데이트를 받으려면 이 채널을 구독하세요:
https://www.mql5.com/en/channels/brea
FREE
Haven Trend Tracker PRO - 트렌드 세계의 내비게이터 시장에 맞춰 조화롭게 거래하고자 하는 트레이더를 위해 설계된 강력한 멀티 타임프레임 인디케이터, Haven Trend Tracker PRO 를 소개합니다. 이 인디케이터의 주요 목표는 현재 작업 중인 타임프레임(LTF)과 상위 타임프레임(HTF)의 추세 방향을 동시에 보여줌으로써 여러분의 의심을 없애는 것입니다. 저의 다른 제품 보기 -> 여기 . 추세 추종 매매는 가장 신뢰할 수 있는 전략입니다. 이 인디케이터는 시장의 지배적인 힘을 파악하고, 지역적 추세와 글로벌 추세가 일치할 때 최적의 진입 시점을 찾아 성공 확률을 크게 높여줍니다. 핵심 아이디어 – 두 타임프레임의 힘 LTF (Lower Timeframe / 하위 타임프레임) – 현재 차트의 추세입니다. 얇은 점선과 화살표로 표시되며 단기적인 가격 움직임을 보여줍니다. 정확한 진입 시점을 찾는 데 이상적입니다. HTF (Higher Time
Engulfing Candle Signal Alert: Elevate Your Trading Strategy Unlock the full potential of your trading with the Engulfing Candle Signal Alert, the ultimate tool for identifying market reversals and enhancing your trading precision. Designed specifically for traders who value accuracy and timely alerts, this powerful indicator detects engulfing candle patterns, a key signal in technical analysis that often indicates a potential shift in market direction. What is an Engulfing Candle? An engu
FREE

Breakthrough Solution For Trend Trading And Filtering With All Important Features Built Inside One Tool! Trend PRO's smart algorithm detects the trend, filters out market noise and gives entry signals with exit levels. The new features with enhanced rules for statistical calculation improved the overall performance of this indicator.
Important Information Revealed Maximize the potential of Trend Pro, please visit www.mql5.com/en/blogs/post/713938
The Powerful Expert Advisor Version
Automatin
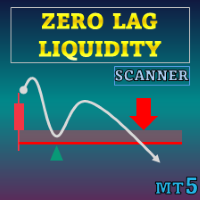
특별 할인 : ALL TOOLS , 개당 $35 ! 신규 도구 는 첫 주 또는 처음 3회 구매 까지 $30 ! MQL5의 Trading Tools 채널 : 최신 소식을 받기 위해 제 MQL5 채널에 가입하세요 Zero Lag Liquidity 는 하위 타임프레임의 꼬리 프로파일과 고거래량 꼬리를 이용해 유동성 구역을 표시합니다. 각 비정상 캔들에 대해, 지표는 꼬리 내부의 거래량 히스토그램을 구축하고 로컬 POC(Point of Control)를 찾아 그 가격을 레벨로 렌더링합니다. 이후의 상호작용은 가격이 이 레벨들에 어떻게 반응하는지에 따라 라벨, 돌파 신호, 그리고 단순한 추세 상태를 트리거할 수 있습니다.
MT5 버전 더 보기: Zero Lag Liquidity MT5 Scanner MT4 버전 더 보기: Zero Lag Liquidity MT4 Scanner 더 많은 제품 보기: All P roducts 개념 고거래량의 긴 꼬리: 비정상적으로

피봇 포인트 Fibo RSJ는 피보나치 비율을 사용하여 당일의 지지선과 저항선을 추적하는 지표입니다.
이 멋진 지표는 피보나치 비율을 사용하여 피벗 포인트를 통해 최대 7단계의 지지와 저항을 생성합니다. 가격이 작업의 가능한 진입/종료 지점을 인식할 수 있는 이 지원 및 저항의 각 수준을 어떻게 존중하는지 환상적입니다.
특징 최대 7단계 지원 및 7단계 저항 레벨의 색상을 개별적으로 설정
입력 피벗 유형 피벗 피보 RSJ1 = 피보 비율 1 계산 피벗 피보 RSJ2 = 피보 비율 2 계산 피벗 Fibo RSJ3 = Fibo 비율 3 계산 피벗 피보 클래식 = 클래식 피벗 계산 최소 피벗 수준 피벗 3 레벨 피벗 4 레벨 피벗 5 레벨 6단계 피벗 피벗 7 레벨
여전히 질문이 있는 경우 다이렉트 메시지로 저에게 연락하십시오: https://www.mql5.com/ko/users/robsjunqueira/
FREE

This is the latest iteration of my famous indicator, Reversal Fractals, published for the first time almost a decade ago. It examines the price structure of fractals to determine possible reversal points in the market, providing timing to positional traders that already have a fundamental or technical valuation model. [ Installation Guide | Update Guide | Troubleshooting | FAQ | All Products ] Reversal fractals can start long trends The indicator is non repainting
It implements alerts of all ki
FREE

Visit our all-new Stein Investments Welcome Page to get the latest information, updates and trading strategies. Do you want to become a constantly profitable 5-star forex trader? Then get our Stein Investments trading tools and send us a screenshot to get your personal invitation to our exclusive trading chat with 500+ members.
FX Trend displays the trend direction, duration, intensity and the resulting trend rating for all time frames in real time.
You'll see at a glance at which direct

Haven Bar Replay — 당신만의 개인 트레이딩 시뮬레이터 소개합니다. Haven Bar Replay 는 수동 매매 연습과 전략 테스트를 위한 전문 시뮬레이터입니다. 이 도구는 MT5 차트를 과거 데이터 플레이어로 변환하여, 수개월 분량의 시장 움직임을 단 몇 분 만에 경험하게 해줍니다. 저의 다른 제품 확인하기 -> 여기를 클릭하세요 . 수익 내는 트레이딩을 배우고 싶지만, 진입 패턴(셋업)이 형성될 때까지 몇 시간씩 기다리기 힘드신가요? 이 도구는 바로 당신을 위해 설계되었습니다. 실제 시장처럼 과거 데이터를 사용하여 안목을 기르고, 가설을 검증하며, 실력을 연마하세요. 왜 Haven Bar Replay가 모든 트레이더에게 필수일까요? '차트 우측 가리기' 효과
지표가 '미래(실제 캔들)'를 완전히 숨기고 시뮬레이션된 부분만 보여줍니다. 당신은 미래의 움직임을 미리 보지 않고 정직하게 의사결정을 내릴 수 있습니다. 완벽한 시간 통제
지루한 횡보 구간은 빨리
FREE

Special offer : ALL TOOLS , just $35 each! New tools will be $30 for the first week or the first 3 purchases ! Trading Tools Channel on MQL5 : Join my MQL5 channel to update the latest news from me SMC 는 유동성 영역, 기관 주문 위치, 그리고 시장의 주요 전환점을 식별하는 데 도움을 주는 거래 접근 방식입니다. SMC 원칙을 활용하면 트레이더는 시장을 더 효과적으로 탐색하고 최적의 진입 및 종료 지점을 찾을 수 있습니다. SMC System 지표는 이러한 개념을 자동화하여 아래와 같은 주요 가격 행동 요소로 차트를 빠르게 표시할 수 있게 해줍니다: 실시간 시장 구조 (내부 및 스윙 BOS / CHoCH) 주문 블록 (강세 및 약세) 프리미엄 및 할인 영역 동일 고점 및 동일 저점 공정 가치 갭(
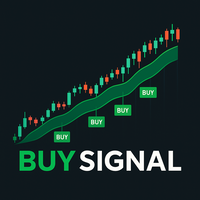
This indicator has been developed as an analytical tool based on exponential moving averages (EMA) . Its purpose is to provide additional insights into market dynamics using two exponential moving averages (EMA) and one smoothed exponential moving average (SMMA) . The indicator can be applied to different financial instruments and timeframes, depending on user preferences. Some traders use it on 30-second charts , complementing it with a 2-minute chart . How the Indicator Works The analysis is b
FREE

The Breakout Finder (BF) is a powerful MetaTrader 5 indicator designed to detect potential breakout and breakdown opportunities in price action. By analyzing pivot highs and lows over a user-defined period, it identifies consolidation zones where price has repeatedly tested resistance or support levels within a narrow channel. When price breaks out of these zones with sufficient confirmation (based on the minimum number of tests and channel width threshold), the indicator visually highlights th
FREE

촛불 카운터 이 표시기는 양초를 세고 더 긴 기간에 따라 숫자를 표시합니다. 오랜 기간 일일 기간을 " Bigger Timeframe "으로 선택하고 기간이 가장 짧은 차트에서 실행할 수 있습니다. 카운터는 일일 차트 에 따라 막대를 계산합니다. 시간 프레임 " H1 "을 매개변수로 전달하면 표시기가 H1 차트 내의 막대를 계산하는 방법을 알게 되며 더 작은 시간 프레임의 차트에서 실행하기만 하면 됩니다. 주요 매개변수는 "BIgger Timeframe"이며 현재 차트의 기간보다 길어야 합니다. 숫자 표시 이 매개변수 외에 숫자를 표시할지 여부를 지정하는 매개변수가 있습니다. 숫자는 화면 중앙에 있을 필요가 없으므로 "CTRL+D" 를 누르면 막대 번호가 "BarIn( 기간 )" 의 오른쪽에 나타납니다 마우스 이 영역은 화면에서 마우스 움직임 에도 매우 유용하므로 마우스 커서가 어느 막대에 있는지 정확히 알 수 있습니다. 나누기 “ Divisivel ”이라는 매개변수가 있는데 이 매
FREE

심볼: USDCHF, USDJPY, XAUUSD, GBPUSD, EURUSD, AUDUSD, GBPJPY ( 저는 USDCHF_H1을 좋아합니다 )
시간 프레임: M15, H1, H4, D1
주요 특징: 리페인트 없음, 지연 없음, 방향 신호, 다중 확인
안전성: 신호에는 손절매, 이익실현이 포함되어 있으며, 위험 대비 보상 규칙을 준수함
포함: 무료 멀티 타임프레임 스캐너 (이 제품 구매 후, 개인 메시지로 스크린샷만 보내주시면 제가 직접 스캐너 파일을 보내드립니다.)
완전한 거래 시스템 개념: 기사 읽기 (전체 개념은 이 기사에서 설명됩니다) 제품이 1.5 버전으로 업그레이드되었습니다 (저는 매일 실계좌에서 수동으로 거래하며 이 인디케이터를 계속 개선하고 있습니다) Break Out Explosion의 MT4 버전이 제공됩니다: https://www.mql5.com/en/market/product/155132 1000달러 계좌에서 진행되는 제 실제 거래를 보여주는 라이브

EXTREME POI Indicator Join the telegram community for an exciting trading journey. https://t.me/automated_TLabs Professional Trading Indicator for MetaTrader 5/Metatrader 4
EXTREME POI is an advanced institutional-grade trading indicator designed to identify high-probability Points of Interest (POI) based on Smart Money Concepts. The indicator combines multiple sophisticated techniques to detect areas where institutional traders are likely to enter the market.
Working Pairs GOLD, EURUSD,
FREE

The SMC Market Structure indicator tracks key price action shifts using Smart Money Concepts (SMC), helping traders identify institutional behavior and overall trend direction.
It automatically detects and displays: Break of Structure (BOS) – Signals continuation of trend Change of Character (CHOCH) – Indicates potential reversal Swing Highs and Lows – Used to define market structure and directional bias
Each structural event is clearly marked on the chart, allowing traders to visualize momentu
FREE

Hull Moving Average (HMA) is well-deservedly popular among traders because of the effective averaging of market noise and a relatively small delay. The current MetaTrader 5 version changes its color when the movement direction changes. Sound and text signals are available. It also supports sending email and push messages. It is possible to trigger a signal on the current incomplete bar, although such a signal may be canceled before completion if conditions are no longer appropriate. One of the p
FREE
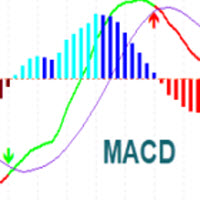
MACD Indicator It has MACD line, Signal line, and Histogram. The Histogram has 4 colors based on Direction Above and Below the Zero Line, showing its movement direction as simple as possible. Allows Show MACD & Signal Line, Show Change In color of MACD Line based on cross of Signal Line. Show Dots at Cross of MacD and Signal Line, Turn on and off Histogram. Enjoy your trading experience, and feel free to share your comments and reviews.
If you are interested in this indicator, you might be i
FREE

Overview The Smart Money Structure Markup Indicator for MetaTrader 5 is a powerful tool designed to help traders identify key market structures based on popular Smart Money Concepts (SMC) strategies. This indicator detects micro-market structures, providing insights into price movements and potential trend changes. It highlights important elements such as valid Break of Structure (BOS), Change of Character (CHoCH), and Inducement (IDM), helping traders to make informed decisions. Key Features Ma
FREE

인기 있는 "슈퍼트렌드" 지표는 테크니컬 분석 도구로, 금융 시장에서의 트렌드 방향과 가능한 진입 또는 청산 지점을 식별하는 데 도움을 줍니다. 이 지표는 평균 실 범위 (ATR)를 기반으로 하며, 이는 가격 범위를 기반으로 시장 변동성을 측정합니다. 다른 플랫폼에서는 무료로 제공되며, 여기서도 마찬가지입니다! 일반적으로 세 가지 방법으로 사용됩니다: 현재 트렌드 식별: 가격이 이 라인 위에 있는 경우 상승 트렌드로 간주되며, 가격이 이 라인 아래에 있는 경우 하락 트렌드로 간주됩니다. 손실 제한 수준으로 사용됩니다. 동적 지지/저항으로: 상승 트렌드에서 이 라인은 가격 아래에 위치하며 동적 지지 수준으로 작용합니다. 하락 트렌드에서는 이 라인이 가격 위에 위치하며 동적 저항 수준으로 작용합니다.
FREE

시장 동향에 대한 명확한 통찰력을 제공하도록 설계된 Heiken Ashi 양초는 노이즈를 필터링하고 잘못된 신호를 제거하는 기능으로 유명합니다. 혼란스러운 가격 변동에 작별을 고하고 더 매끄럽고 신뢰할 수 있는 차트 표현을 만나보세요. Quantum Heiken Ashi PRO를 정말 독특하게 만드는 것은 전통적인 촛대 데이터를 읽기 쉬운 색상 막대로 변환하는 혁신적인 공식입니다. 빨간색과 녹색 막대는 각각 약세와 강세 추세를 우아하게 강조하여 잠재적 진입점과 퇴장점을 매우 정확하게 파악할 수 있습니다.
Quantum EA 채널: 여기를 클릭하세요
MT4 버전: 여기를 클릭하세요
이 놀라운 지표는 다음과 같은 몇 가지 주요 이점을 제공합니다. 선명도 향상: Heiken Ashi 바는 가격 변동을 완화하여 시장 추세를 보다 명확하게 나타내므로 유리한 거래 기회를 쉽게 식별할 수 있습니다. 소음 감소: 종종 잘못된 신호로 이어지는 불규칙한 가격 변동에 작별을

Candle Time CountDown By BokaroTraderFx The Candle Timer Countdown Indicator is a versatile tool designed for the MetaTrader 5 (MT5) trading platform. It provides traders with a visual countdown of the remaining time for the current candle on a chart. The key features include:
Customizable Position: Place the countdown timer in any corner of the chart for optimal visibility. Default Text Color: Set to red for clear visibility, with options for further customization. Minimal Display: Shows only
FREE
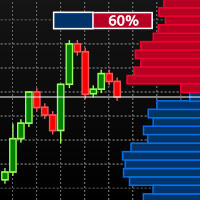
Visual Book on Chart is an indicator designed specially for stocks and futures market. To check if you can use the tool with your Broker open the MT5 Depth Of Market on your terminal and check if there are price and volume data available. Learn more about the MT5 Depth Of Market in the oficial page. The indicator shows the depth of market data on the chart window and use gradient based on the market data to colorize the histogram bars. The indicator is formed by two components: The panel, whic
FREE
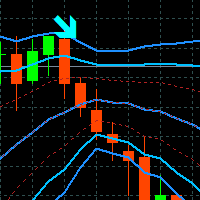
Tyr Bands Indicator
Tyr Band works with BB and 3 different deviations, plus the Stochastic confirmation. So when the price closes below/above the BB Reversal Band (Red) and the Stoch is in the confirmation zone, then the arrow (buy/sell) appears. This arrow indicates that we can entry to the market up/down on the next opening. Since it is only an indicator, it will not place SL or TP, we need to have them placed manually if you want to trade. The SL will lie on the external BB band (Blue), and
FREE

VM Heiken Ashi Pro
노이즈를 필터링하고 명확한 BUY/SELL 신호를 생성하기 위한 평활화된 Heiken-Ashi (HMA 또는 EMA), 비리페인트(선택적 ConfirmOnClosedBar). 차트에 HA 캔들 표시(원본 캔들 숨김 가능), 화살표 배치는 ATR 또는 고정 오프셋으로 설정, 알림 전송(popup, email, push) 및 스팸 방지 처리 포함. 주요 목적
원시 캔들을 평활화된 Heiken-Ashi로 변환하여 색상 변화(약세에서 강세로 / 강세에서 약세로)를 감지하고 진입 화살표를 그립니다. ConfirmOnClosedBar 옵션은 리페인트를 피하기 위해 캔들이 닫힐 때까지 기다리도록 합니다. UseATRForArrowOffset는 화살표를 시각적으로 더 자연스럽게 만듭니다. 이 인디케이터는 가볍고 많은 차트에서 안정적입니다. 빠른 사용법
인디케이터를 부착하고 Smoothing Method 및 Smoothing Period(기본 50)를 선택합

EPo-CreW Forex Super ORB-H4 지표에 오신 것을 환영합니다!
이 가이드는 시장의 첫 번째 4시간 오프닝 레인지를 기반으로 높은 확률의 거래 기회를 식별하는 이 강력한 도구의 사용 방법을 설명합니다.
초보자든 숙련된 트레이더든, 이 시스템은 보다 자신감 있고 일관된 트레이딩을 할 수 있도록 도와줍니다. 이 제품은 데모 제품이며, 설치일로부터 30일 후에 만료됩니다. NB: M5 타임프레임으로 전환했는지 확인하세요. 이 인디케이터를 사용하는 데 최적의 타임프레임입니다
트레이딩 전략
전략 1: 브레이크아웃 & 되돌림 (메인 전략)
SELL(매도) 설정:
가격이 파란색 라인을 상향 돌파한다 (고점 돌파)
금색 BREAKOUT 화살표가 나타난다
가격이 다시 파란색 라인 아래에서 마감될 때까지 기다린다
빨간색 SELL 화살표가 나타난다 (되돌림 진입)
표시된 가격에서 SELL 진입
SL 은 빨간 점 (레인지 고점 위)
TP 는 파란 점 (TP1, TP2, TP3)
BUY(
FREE

MACD divergence indicator finds divergences between price chart and MACD indicator and informs you with alerts (popup, mobile notification or email) . Its main use is to find trend reversals in the chart. Always use the divergence indicators with other technical assets like support resistance zones, candlestick patterns and price action to have a higher possibility to find trend reversals. Three confirmation type for MACD divergences: MACD line cross zero level Price returns to previous H/L Crea
FREE

Dark Breakout is an Indicator for intraday trading. This Indicator is based on Trend Following strategy, providing an entry signal on the breakout. The signal is provided by the arrow, which confirms the breaking of the level. We can enter in good price with this Indicator, in order to follow the main trend on the current instrument. It is advised to use low spread ECN brokers. This Indicator does Not repaint and N ot lag . Recommended timeframes are M5, M15 and H1. Recommended working pairs
MetaTrader 마켓은 거래 로봇과 기술 지표들의 독특한 스토어입니다.
MQL5.community 사용자 메모를 읽어보셔서 트레이더들에게 제공하는 고유한 서비스(거래 시그널 복사, 프리랜서가 개발한 맞춤형 애플리케이션, 결제 시스템 및 MQL5 클라우드 네트워크를 통한 자동 결제)에 대해 자세히 알아보십시오.
트레이딩 기회를 놓치고 있어요:
- 무료 트레이딩 앱
- 복사용 8,000 이상의 시그널
- 금융 시장 개척을 위한 경제 뉴스
등록
로그인
계정이 없으시면, 가입하십시오
MQL5.com 웹사이트에 로그인을 하기 위해 쿠키를 허용하십시오.
브라우저에서 필요한 설정을 활성화하시지 않으면, 로그인할 수 없습니다.