The Big Short Bubble Order Flow

📌 The Big Short (Smart Money)

The Big Short (Smart Money) is a professional chart analysis indicator for MetaTrader 5, designed to help traders read market pressure, absorption zones, flow behavior, and important reaction areas directly on the chart.

This indicator was created for discretionary traders who want a clearer visual view of buy and sell pressure without using multiple separate indicators.

It is especially useful for fast chart reading on lower timeframes such as M1, and is suitable for active traders who trade instruments such as XAUUSD, US30, NAS100, Forex, indices, and CFDs.

The Big Short (Smart Money) does not open, close, or manage trades automatically. It is a visual decision-support tool for manual trading and market analysis.

━━━━━━━━━━━━━━━━━━━━

🔥 Main Features

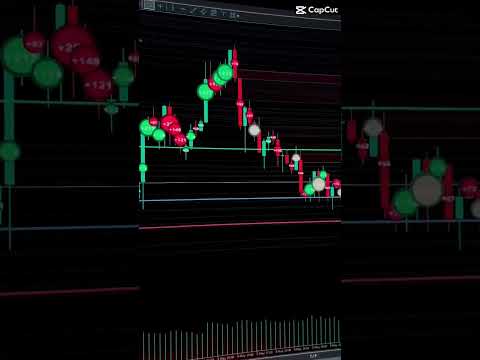
1. 🟢 Smart Bubble Flow

The indicator displays buy and sell pressure directly on the chart using visual bubbles.

Bubble size represents the relative importance of the detected pressure area. Larger bubbles highlight stronger pressure zones where market reaction may become more meaningful.

This allows traders to quickly identify where buying or selling activity is becoming more visible.

━━━━━━━━━━━━━━━━━━━━

2. 🟢 Buy Absorption / 🔴 Sell Absorption

Green bubbles represent buy absorption or buying pressure.

Pink bubbles represent sell absorption or selling pressure.

Gray bubbles represent neutral, mixed, or unclear pressure.

This gives traders an additional visual layer beyond candle reading and helps them better understand market behavior around key price levels.

━━━━━━━━━━━━━━━━━━━━

3. 📊 Flow Profile

The built-in Flow Profile shows the distribution of pressure around price levels.

It helps traders identify where market activity is concentrated and where price may react, reject, slow down, or continue.

This feature is useful for reading support, resistance, reaction zones, and high-interest price areas.

━━━━━━━━━━━━━━━━━━━━

4. 🟡 POC / Flow Wall

The indicator marks an important Point of Control or Flow Wall area where buy and sell pressure becomes concentrated.

This level can be used as a reference zone for:

- Support
- Resistance
- Price reaction
- Pullback planning
- Breakout confirmation
- Trade setup preparation

The Flow Wall helps traders avoid guessing and gives a clearer visual reference for important market zones.

━━━━━━━━━━━━━━━━━━━━

5. 🧭 Fresh / Used Zones

The Big Short (Smart Money) highlights important buy and sell zones and helps separate fresh zones from used zones.

This makes it easier to avoid late entries and focus on areas where price may still have a meaningful reaction.

Fresh zones can help traders prepare earlier, while used zones help traders avoid chasing price after the move has already happened.

━━━━━━━━━━━━━━━━━━━━

6. 🎯 RR Planning Tool

The indicator includes a visual Risk / Reward planning tool.

Traders can use this panel to estimate potential trade structure before entering the market, including possible entry area, stop loss area, and target zone.

This feature is for manual planning only.

It does not execute trades and does not manage positions automatically.

━━━━━━━━━━━━━━━━━━━━

7. 🖥 Clean Chart Interface

The design is built for fast visual reading.

It combines bubble pressure, flow zones, profile levels, POC / Flow Wall, and planning tools into one chart view.

This helps traders reduce chart clutter and focus on the most important pressure areas.

━━━━━━━━━━━━━━━━━━━━

✅ Suitable For

The Big Short (Smart Money) is suitable for:

- Manual traders
- Scalpers
- M1 and intraday traders
- Gold traders
- Index traders
- Forex and CFD traders
- Traders who use Smart Money Concepts
- Traders who use support and resistance
- Traders who study absorption and market pressure
- Traders who want a visual tool to support trade decisions

━━━━━━━━━━━━━━━━━━━━

🧠 Simple Trading Concept

A simple way to read the indicator is:

Zone + Bubble Flow + Price Reaction = Trade Setup

The indicator helps traders see where pressure is building, where important flow zones are located, and where price reaction may become meaningful.

For example:

- Price drops into a support zone
- Green bubbles begin to appear
- Sell pressure becomes weaker
- A reversal candle or rejection appears
- Trader prepares a possible buy setup with proper risk management

For sell setups, the concept can be applied in the opposite direction.

━━━━━━━━━━━━━━━━━━━━

⚠️ Important Notes

The Big Short (Smart Money) is an indicator only.

It does not trade automatically.

It does not provide guaranteed profits.

It does not replace risk management.

All trading decisions remain the responsibility of the user.

The indicator is designed to support analysis and improve chart reading, not to replace trading discipline.

Always use proper stop loss, position sizing, and risk management.

━━━━━━━━━━━━━━━━━━━━

⭐ Recommended Use

For best results, use The Big Short (Smart Money) together with:

- Market structure
- Trend direction
- Support and resistance
- Price reaction
- Risk / reward planning
- Proper stop loss discipline

This tool is designed to help traders read the market more clearly before making a trading decision.

━━━━━━━━━━━━━━━━━━━━

💬 Support

For questions, support, or additional information, please contact:

waratthakit@hotmail.com

━━━━━━━━━━━━━━━━━━━━

🙏 After Purchase

If you find The Big Short (Smart Money) helpful for your chart analysis, your honest review is highly appreciated.

Your feedback helps us improve the product and continue developing better tools for traders.
Recommended products
This is an MTF indicator of support and resistance levels based on Advanced ZigZag Dynamic and/or Extended Fractals indicator extremums with price labels (can be disabled). More higher TFs can be selected for MTF mode. By default, the levels are generated based on ZigZag indicator dots. Fractals indicator dots can also be used together with ZigZag or instead of it. In order to simplify the use and save CPU time, calculation is performed once per each bar at its opening. Parameters: ForcedTF - ch
PZ Support Resistance MT5
PZ TRADING SLU
3.71 (7)
Unlock key market insights with automated support and resistance lines Tired of plotting support and resistance lines? This is a multi-timeframe indicator that detects and plots supports and resistance lines in the chart with the same precision as a human eye would. As price levels are tested over time and its importance increases, the lines become thicker and darker, making price leves easy to glance and evaluate. [ Installation Guide | Update Guide | Troubleshooting | FAQ | All Products  ] Boo
RBreaker
Zhong Long Wu
RBreaker Gold Indicators is a short-term intraday trading strategy for gold futures that combines trend following and intraday reversal approaches. It not only captures profits during trending markets but also enables timely profit-taking and counter-trend trading during market reversals. This strategy has been ranked among the top ten most profitable trading strategies by the American magazine   Futures Truth   for 15 consecutive years. It boasts a long lifecycle and remains widely used and st
Noize Absorption Index - is the manual trading system that measures the difference of pressure between bears forces and bulls forces. Green line - is a noize free index that showing curent situation. Zero value of index shows totally choppy/flat market.Values above zero level shows how powerfull bullish wave is and values below zero measures bearish forces.Up arrow appears on bearish market when it's ready to reverse, dn arrow appears on weak bullish market, as a result of reverse expectation.
CosmiCLab SMC FIBO CosmiCLab SMC FIBO is a professional trading indicator designed for traders who use Smart Money Concepts (SMC), market structure analysis and Fibonacci retracement levels. The indicator automatically detects market swings and builds Fibonacci levels based on the latest impulse movement. It also identifies market structure changes such as BOS (Break of Structure) and CHOCH (Change of Character), helping traders understand the current market direction. CosmiCLab SMC FIBO also pr
The Accumulation / Distribution is an indicator which was essentially designed to measure underlying supply and demand. It accomplishes this by trying to determine whether traders are actually accumulating (buying) or distributing (selling). This indicator should be more accurate than other default MT5 AD indicator for measuring buy/sell pressure by volume, identifying trend change through divergence and calculating Accumulation/Distribution (A/D) level. Application: - Buy/sell pressure: above
WickAndBody Volume Flow
Henry Armando Baltazar
WickAndBody Volume Flow v5.2 Order Flow Analysis through Candle Segmentation The WickAndBody Volume Flow is an advanced diagnostic tool for MetaTrader that allows traders to "see" inside every Japanese candlestick. Unlike conventional volume indicators, this algorithm utilizes Multi-Timeframe (MTF) technology to break down real volume and determine exactly how much capital was traded in the wicks versus the candle body . Key Features Volume Detection: Uses lower timeframe data (M1/M5) to reconst
FREE
up down v6 for mt5 is no repaint all timeframe and all pairs indicator. red histogram cros trigger that is up point,and put a red point on histogram. and blue histogram cros trigger that is deep point.and put blue point on histogram. this indicator need to sometimes zoom out .for thise pres + button. if newly comes signal is too high makes before invisible.red and blue points are there.to see the signals. indicator is no repaint and can use all time frame and all pairs. only need minimum 500 bar
The Donchian Time Sync Analyzer brings powerful multi-timeframe dimension to classic Donchian channel analysis, allowing traders to simultaneously monitor trend strength and potential reversal signals across five different chart periods. This advanced indicator calculates the highest highs and lowest lows across your selected timeframes, generating clear visual signals that help identify convergence of trend direction across multiple time horizons. By providing coordinated analysis from minute t
**   All Symbols   x   All Timeframes   scan just by pressing scanner button ** Discount: The price is $50$, But now it is just $39, Limited time offer is active. *** Contact me  to send you instruction and add you in "Trend Reversal group" for sharing or seeing experiences with other users. Introduction: Trendlines are the most famous technical analysis in trading . Trendlines continually form on the charts of markets across all the different timeframes providing huge opportunities for traders
Precision Arrows
Nervada Emeule Adams
Precision Arrows – Smart Entry Signals with Built-In TP and SL Precision Arrows is a powerful trading indicator designed for traders who demand accuracy, clarity, and reliability. It identifies high-probability buy and sell signals with automatically generated Take Profit and Stop Loss levels, helping you trade with discipline and consistency across Forex, Indices, Crypto, and Synthetic Indices . The indicator combines precise signal detection, intelligent filtering, and a multi-timeframe dashbo
Caicai L&S Yield Histogram Important Notice: This indicator is an integral tool of the automated EA Caicai Long and Short Pair Trading . This indicator visually displays the percentage deviation (Yield %) of a pair's current spread relative to its own historical mean. It is an excellent tool for quickly visualizing the gross financial potential of a market distortion in Long & Short operations. Main Features: Percentage Visualization: Understand the size of the distortion in palpable percentage
GDS Renko Entry Helper Pro GDS Renko Entry Helper Pro HOW THE SYSTEM WORKS This tool is part of the Golden Delta Renko trading system. The system is designed to guide you step by step: 1.   Renko Zones       → shows where key levels are   2.   Entry Helper      → highlights where to focus   3.   Entry Helper PRO      → shows setup quality and context   4.   Trade Desk Panel      → executes trades with full control  
TRI Visualizer
Yoshimi Mon 三 Ura
TRI Visualizer MT5 – Thermodynamic Market Analysis Overview The TRI (Thermal Range Indicator) Visualizer Enhanced is a rare market analysis indicator that goes beyond conventional technical analysis, applying principles of thermodynamics from physics. It interprets market price fluctuations as “thermodynamic energy,” enabling the highly accurate detection of subtle market changes that are often overlooked. Innovative Mechanisms 1. Dual Calculation Engines Classic TRI Mode Formula: |Close
Weis Wave Scouter
Jean Carlos Martins Roso
Discover the power of advanced volume analysis with Weis Wave Scouter, a revolutionary indicator for MetaTrader 5 that combines the proven principles of the Wyckoff method and Volume Spread Analysis (VSA). Designed for traders seeking precision and depth in their operations, this indicator offers a tactical reading of the market through cumulative volume wave analysis, helping to identify key points of trend reversals and continuations. Weis Wave Scouter features a clear visual interface with co
WAPV Weis Wave Chart Forex
Eduardo Da Costa Custodio Santos
The Weis Wave Chart Forex for MT5 is a Price and Volume indicator. The Price and Volume reading was widely disseminated through Richard Demille Wyckoff based on the three laws created by him: Supply and Demand, Cause and Effect and Effort vs. Result. In 1900 R.Wyckoff already used the wave chart in his analyses. Many years later, around 1990, David Weis Automated R. Wyckoff's wave chart and today we bring you the evolution of David Weis' wave chart. It shows the amount of Volume and the amount o
Key level wedge MT5
Presley Annais Tatenda Meck
The   Key level wedge MT5   indicator automatically draws rising wedge pattern and falling wedge pattern for you on the chart. This pattern is really good when used as a confirmation entry at key support & resistance, supply & demand and reversal zones. Advantages  The   Key level wedge MT5   block DOES NOT RE-PAINT, giving you confidence when a signal appears and also helps when looking back.  The   Key level wedge MT5   includes an on/off button on the chart to easily keep the charts clean
The RSI Divergence + FVG Signal indicator combines Relative Strength Index (RSI) Divergence with Fair Value Gap (FVG) detection to generate high-probability buy and sell signals based on both momentum shifts and institutional imbalance zones. Core Features: RSI Divergence Detection : Identifies both regular and hidden bullish/bearish divergences between price and RSI. Divergences indicate potential trend reversals or continuation. FVG Zone Recognition : Detects Fair Value Gaps (imbalances caused
Trend Master V2
Oratile Pitsoane
What Is Trend Master Pro? Trend Master Pro   is a professional-grade trend trading indicator built for MetaTrader 5. It was designed with one goal in mind — to keep you on the right side of the market at all times by combining three powerful technical tools into a single, clean, easy-to-read display directly on your price chart. Instead of cluttering your screen with multiple separate indicators, Trend Master Pro fuses an   EMA Ribbon trend filter , a   ZigZag swing point engine , and a   breako
Universal Soul Reaper
Pieter Gerhardus Van Zyl
Universal Soul Reaper is an atmospheric market-flow oscillator designed to interpret price behavior as a cycle of spiritual energy. Instead of reacting to raw price alone, it visualizes the state of the market’s soul —revealing when momentum is awakening, stabilizing, or fading. The indicator operates in a separate window and presents three interwoven entities: the Ectoplasmic Veil , the Spirit Boundary , and the Soul Core . Together, they form a living framework that helps traders sense pressu
Range Volume Hybrid Generator
Trade The Volume Waves Single Member P.C.
1. Introduction Range Volume Hybrid (RVH) is a MetaTrader 5 Expert Advisor that creates custom chart symbols using a unique dual-condition bar formation method. Unlike traditional charts where bars close based on a single criterion (time, range, or volume), RVH bars close only when BOTH a minimum price range AND a minimum volume threshold are met simultaneously.  Download also and install RVH Monito r Indicator - to control the EA from the custom charts (it's Free)  https://www.mql5.com/en/marke
An indicator of pattern #31 ("Long Island") from Encyclopedia of Chart Patterns by Thomas N. Bulkowski. The second gap is in the opposite direction. Parameters: Alerts - show alert when an arrow appears   Push - send a push notification when an arrow appears (requires configuration in the terminal) GapSize - minimum gap size in points ArrowType - a symbol from 1 to 17 ArrowVShift - vertical shift of arrows in points   ShowLevels - show levels ColUp - color of an upward line ColDn - color of a d
Double HMA MTF for MT5
Pavel Zamoshnikov
4 (4)
This is an advanced multi-timeframe version of the popular Hull Moving Average (HMA) Features Two lines of the Hull indicator of different timeframes on the same chart. The HMA line of the higher timeframe defines the trend, and the HMA line of the current timeframe defines the short-term price movements. A graphical panel with HMA indicator data from all timeframes at the same time . If the HMA switched its direction on any timeframe, the panel displays a question or exclamation mark with a tex
Time and Sales Tick
Pablo Filipe Soares De Almeida
Time & Sales Tick Indicator for MetaTrader 5 This indicator displays real-time trading tick information on MetaTrader 5 charts. It presents price, tick volume, and time. Functionality Displays tick data, including price, volume, and time, in a panel on the chart. Groups ticks into user-defined intervals, with color-coded price movements (green for upward, red for downward). Allows panel positioning in any chart corner.
Donchian Breakout And Rsi
Mattia Impicciatore
4.5 (2)
General Description This indicator is an enhanced version of the classic Donchian Channel , upgraded with practical trading functions. In addition to the standard three lines (high, low, and middle), the system detects breakouts and displays them visually with arrows on the chart, showing only the line opposite to the current trend direction for a cleaner view. The indicator includes: Visual signals : colored arrows on breakout Automatic notifications : popup, push, and email RSI filter : to val
FREE
Extreme Breakout Signal is a trading strategy based on price breaking key support and resistance levels. It helps identify potential trend changes and capture new upward or downward movements. Parameter Extreme Radius : A customizable parameter that can be set differently for each timeframe Key Principles Support & Resistance : Price often reacts at these levels; a breakout may indicate a new trend. Confirmation : Use volume or other indicators to confirm breakout validity. Signal Types Buy Sig
PZ Mean Reversion MT5
PZ TRADING SLU
3 (2)
Outperform traditional strategies: effective mean reversion for savvy traders Unique indicator that implements a professional and quantitative approach to mean reversion trading. It capitalizes on the fact that the price diverts and returns to the mean in a predictable and measurable fashion, which allows for clear entry and exit rules that vastly outperform non-quantitative trading strategies. [ Installation Guide | Update Guide | Troubleshooting | FAQ | All Products ] Clear trading signals Ama
The Trend Duration Forecast MT5 indicator is designed to estimate the probable lifespan of a bullish or bearish trend. Using a Hull Moving Average (HMA) to detect directional shifts, it tracks the duration of each historical trend and calculates an average to forecast how long the current trend is statistically likely to continue. This allows traders to visualize both real-time trend strength and potential exhaustion zones with exceptional clarity. KEY FEATURES Dynamic Trend Detection:   Utiliz
HAS RSI Signal — Professional Trend Indicator with SL/TP Calculation HAS RSI Signal is a powerful trading tool that combines time-tested classics with modern noise-filtering algorithms. The indicator analyzes the market through the prism of Heiken Ashi Smoothed candles and the RSI oscillator, providing clear entry signals at trend reversals or when exiting overbought/oversold zones. Key Advantages: Double Filtration: Using Heiken Ashi Smoothed eliminates market "noise," while RSI confirms the mo
RENKO PRICE ACTION ATR is an "Expert Advisor" developed through the construction of the Renko Chart where each BRICK has the size calculated through the ATR of the period selected by the user. Renko charts are designed to filter out minor price movements, thus making it easier for traders to focus on important trends. Due to its efficiency in detecting price trends, it is also possible to clearly identify supports and resistances as well as top and bottom divergences, thus making better use of t
Buyers of this product also purchase
ARIPoint
Temirlan Kdyrkhan
ARIPoint is a powerful trading companion designed to generate high-probability entry signals with dynamic TP/SL/DP levels based on volatility. Built-in performance tracking shows win/loss stats, PP1/PP2 hits, and success rates all updated live. Key Features: Buy/Sell signals with adaptive volatility bands Real-time TP/SL/DP levels based on ATR Built-in MA Filter with optional ATR/StdDev volatility Performance stats panel (Success, Profit/Loss, PP1/PP2) Alerts via popup, sound, push, or email Cu
SuperScalp Pro
Van Minh Nguyen
4.63 (24)
SuperScalp Pro – Advanced Multi-Filter Scalping Indicator System SuperScalp Pro is an advanced scalping indicator that combines the classic Supertrend with multiple intelligent confirmation filters to help identify trading opportunities. It works efficiently across multiple timeframes from M1 to H4, with optimized performance on XAUUSD, BTCUSD, and major Forex pairs. The indicator provides clear Buy and Sell signals, along with automatically calculated entry price, stop loss, and take profit lev
Entry In The Zone and SMC Multi Timeframe is a real-time 2-in-1 market analysis tool that combines market structure analysis and a No Repaint BUY / SELL signal system into a single indicator, built on Smart Money Concepts (SMC) — a widely adopted framework used by professional traders to understand market structure. This indicator helps you see the market more clearly, make decisions based on structure rather than guesswork, and focus on high-probability zones where price is more likely to react
Divergence Bomber
Ihor Otkydach
4.9 (88)
Each buyer of this indicator also receives the following for free: The custom utility "Bomber Utility", which automatically manages every trade, sets Stop Loss and Take Profit levels, and closes trades according to the rules of this strategy Set files for configuring the indicator for various assets Set files for configuring Bomber Utility in the following modes: "Minimum Risk", "Balanced Risk", and "Wait-and-See Strategy" A step-by-step video manual to help you quickly install, configure, and s
Power Candles MT5
Daniel Stein
5 (8)
Power Candles V3 - Self-Optimizing Strength Indicator Power Candles V3 turns currency and instrument strength into an actionable trade plan on every chart it is attached to. Instead of just coloring candles, it runs a live auto-optimization in the background and hands you the best Stop Loss, Take Profit and signal threshold for the symbol in front of you. One click adopts it for live trading - entry, Stop Loss and Take Profit rays appear on the chart at the exact prices, and alerts fire with dir
SignalTech MT5 is a fully rule based trading system for EURUSD, USDCHF, USDJPY, AUDUSD, NZDUSD, EURJPY, AUDJPY, NZDJPY, CADJPY.  All the winning trades with chart setups are published on the comments page. 2025-12 1174 Pips 2026-01 2624 Pips 2026-02 2937 Pips 2026-03 2165 Pips 2026-04 2243 Pips It can generate signals with Buy/Sell Arrows and Pop-Up/Sound Alerts. Each signal has clear Entry and Stop Loss levels, which should be automatically flagged on the chart, as well as potential Targets 1,
Introducing   Quantum Breakout PRO , the groundbreaking MQL5 Indicator that's transforming the way you trade Breakout Zones! Developed by a team of experienced traders with trading experience of over 13 years,   Quantum Breakout PRO   is designed to propel your trading journey to new heights with its innovative and dynamic breakout zone strategy. Quantum Breakout Indicator will give you signal arrows on breakout zones with 5 profit target zones and stop loss suggestion based on the breakout b
Azimuth Pro
Ottaviano De Cicco
5 (7)
Azimuth Pro V2: Synthetic Fractal Structure and Confirmed Entries for MT5 Overview Azimuth Pro is a multi-level swing structure indicator by Merkava Labs . Four nested swing layers, swing-anchored VWAP, ABC pattern detection, three-timeframe structural filtering, and closed-bar confirmed entries — one chart, one workflow from micro-swings to macro-cycles. This is not a blind signal product. It is a structure-first workflow for traders who care about location, context, and timing. V2 Launch Offe
RelicusRoad Pro: Quantitative Market Operating System 70% OFF LIFETIME ACCESS (LIMITED TIME) - JOIN 2,000+ TRADERS Why do most traders fail even with "perfect" indicators? Because they trade Single Concepts in a vacuum. A signal without context is a gamble. To win consistently, you need CONFLUENCE . RelicusRoad Pro is not a simple arrow indicator. It is a complete Quantitative Market Ecosystem . It maps the "Fair Value Road" price travels on, distinguishing between random noise and true structur
Smart Multi-Layer Breakout & Pullback Detector for MetaTrader 5 "Smart Simple Fast!" Are you tired of missing high-probability breakout entries? Are you spending hours scanning multiple charts, trying to align breakouts with trend direction and currency momentum — only to miss the move? Break Pullback solves all of that in one indicator. What Is Break Pullback? Break Pullback is a professional-grade MetaTrader 5 indicator built specifically for traders who trade market structure, breakouts, an
New Update of   Smart Trend Trading System MT5 For  2026 Market: If You Buy this Indicator you will Get my Professional Trade Manager + EA  for FREE . First of all Its worth emphasizing here that this Trading System is Non-Repainting   , Non Redrawing and Non Lagging Indicator Which makes it ideal from both manual and robot trading .  [Online course] , [manual] and [download presets] . The Smart Trend Trading System MT5 is a comprehensive trading solution tailored for new and experienced traders
Gann Made Easy   is a professional and easy to use Forex trading system which is based on the best principles of trading using the theory of W.D. Gann. The indicator provides accurate BUY and SELL signals including Stop Loss and Take Profit levels. You can trade even on the go using PUSH notifications. PLEASE CONTACT ME AFTER PURCHASE TO GET TRADING  INSTRUCTIONS   AND GREAT EXTRA INDICATORS   FOR FREE! Probably you already   heard   about the Gann trading methods before. Usually the Gann theory
First of all Its worth emphasizing here that this Trading Tool is Non Repainting , Non Redrawing and Non Lagging Indicator , Which makes it ideal for professional trading . [Online course] ,   and   [manual] The Smart Price Action Concepts Indicator is a very powerful tool for both new and experienced traders . It packs more than 20 useful indicators into one , combining advanced trading ideas like Inner Circle Trader Analysis and Smart Money Concepts Trading Strategies . This indicator focuses
Atomic Analyst MT5
Issam Kassas
3.94 (31)
New Update of   Atomic Analyst MT5 For  2026 Market: If You Buy this Indicator you will Get my Professional   Trade Manager + EA  for   FREE . First of all Its worth emphasizing here that this Trading Indicator is   Non-Repainting   , Non Redrawing and Non Lagging Indicator   Indicator, Which makes it ideal from both manual and robot trading.  User manual: settings, inputs and strategy . The Atomic Analyst  is a PA Price Action Indicator that uses Strength and Momentum of the price to find a bet
Market Structure Order Block Dashboard MT5 is an MT5 indicator designed for traders who want to read market structure and the main price reaction zones directly on the chart. It combines BOS, ChoCH, Order Blocks, Fair Value Gaps (FVG), Liquidity, Kill Zones, Volume Profile, and a compact dashboard for quick analysis. This indicator targets traders who use market structure, ICT and Smart Money concepts as a decision framework. It can help spot trend continuations, possible reversals, price imbala
FX Trend MT5 NG
Daniel Stein
5 (4)
FX Trend NG: The Next Generation Multi-Market Trend Intelligence Overview FX Trend NG is a professional multi-timeframe trend and market monitoring tool designed to give you a complete structural overview of the market in seconds. Instead of switching between dozens of charts, you instantly see which symbols are trending, where momentum is fading, and where strong alignment exists across timeframes. This tool is part of the Stein Investments ecosystem - 18+ tools plus Max, your 1-on-1 AI tradi
Btmm state engine pro
Garry James Goodchild
5 (4)
BTMM State Engine Pro is a MetaTrader 5 indicator for traders who use the Beat The Market Maker approach: Asian session context, kill zone timing, level progression, peak formation detection, and a multi-pair scanner from a single chart. It combines cycle state logic with a built-in scanner dashboard so you do not need the same tool on many charts at once. What it does Draws the Asian session range; session times can follow broker server offset or be set in inputs. Tracks level progression (L
Grabber System MT5
Ihor Otkydach
4.83 (23)
Let me introduce you to an excellent technical indicator – Grabber, which works as a ready-to-use "All-Inclusive" trading strategy. Within a single code, it integrates powerful tools for technical market analysis, trading signals (arrows), alert functions, and push notifications. Every buyer of this indicator also receives the following for free: Grabber Utility for automatic management of open orders Step-by-step video guide: how to install, configure, and trade with the indicator Custom set fi
Quantum TrendPulse
Bogdan Ion Puscasu
5 (23)
Introducing Quantum TrendPulse , the ultimate trading tool that combines the power of SuperTrend , RSI , and Stochastic into one comprehensive indicator to maximize your trading potential. Designed for traders who seek precision and efficiency, this indicator helps you identify market trends, momentum shifts, and optimal entry and exit points with confidence. Key Features: SuperTrend Integration: Easily follow the prevailing market trend and ride the wave of profitability. RSI Precision: Detect
OrderFlux | Footprint Orderflow for MetaTrader 5 Version 2.0 – Real-time Bid/Ask Visualization for Active Traders OrderFlux is a footprint and orderflow indicator for MT5. It shows not only where the price has moved, but what happens inside the movement: Bid/Ask volume per price level, delta, imbalance, and volume distribution. Many charts only show you the final result of a candle. OrderFlux shows you the path to get there. This is exactly what helps when you want to read market participation i
Let's be honest first. No indicator will make you profitable on its own. If someone tells you otherwise, they're selling you a dream. Every indicator that shows perfect buy/sell arrows can be made to look flawless — just zoom into the right window of history and screenshot the winners. We won't do that. SMC Intraday Formula is a tool. It reads the market structure for you, maps the highest-probability price zones, and tells you exactly what the smart money footprint looks like right now — in pl
Crystal Heikin Ashi Signals
Muhammad Jawad Shabir
5 (2)
Crystal Heikin Ashi Signals - Professional Trend & Signal Detection Indicator Advanced Heikin Ashi Visualization with Intelligent Signal System for Manual & Automated Trading Final Price: $149 ---------> Price goes up $10 after every 10 sales . Limited slots available — act fast . Overview Crystal Heikin Ashi Signals is a professional-grade MetaTrader 5 indicator that combines pure Heikin Ashi candle visualization with an advanced momentum-shift detection system. Designed for both manual traders
Super Signal Market Slayer No Repaint | High Accuracy | Multi-Market Intelligent Trend Indicator In trading, the real challenge is not placing an order, but clearly seeing when a trend has truly begun amid market noise. Market Slayer was created for this purpose. It is a no-repaint intelligent indicator designed specifically for intraday trading. Through multi-layer confirmation and trend-filtering logic, it delivers clear and reliable Buy / Sell signals only at key moments. Key Advantages No r
The " Dynamic Scalper System MT5 " indicator is designed for the scalping method of trading within trend waves. Tested on major currency pairs and gold, compatibility with other trading instruments is possible. Provides signals for short-term opening of positions along the trend with additional price movement support. The principle of the indicator. Large arrows determine the trend direction. An algorithm for generating signals for scalping in the form of small arrows operates within trend wav
Meridian Pro
Ottaviano De Cicco
5 (2)
Meridian Pro 2.00: Professional Multi-Timeframe Trend Matrix for MT5 Meridian Pro 2.00 is a professional adaptive trend matrix for MetaTrader 5. It combines the original Meridian trend engine, a clean chart ribbon, closed-bar signal arrows, an 8-timeframe dashboard, Fuel momentum, weighted consensus, synthetic HTF processing and chart-native higher-timeframe context lines. The goal is simple: read current trend, multi-timeframe structure, strength, momentum and EA-ready state from one discipline
This dashboard shows the latest available   harmonic patterns   for the selected symbols, so you will save time and be more efficient /   MT4 version . Free Indicator:   Basic Harmonic Pattern Comparison of "Basic Harmonic Pattern" vs. "Basic Harmonic Patterns Dashboard" Indicators Feature Basic Harmonic Pattern Basic Harmonic Patterns Dashboard Functionality Detects and displays harmonic patterns on a single chart Searches multiple symbols and timeframes for harmonic patterns, displays res
Trend indicator AI mt5
Ramil Minniakhmetov
5 (17)
Trend Ai indicator  mt5 is great tool that will enhance a trader’s market analysis by combining trend identification with actionable entry points and reversal alerts.  This indicator empowers users to navigate the complexities of the forex market with confidence and precision Beyond the primary signals, Trend Ai indicator identifies secondary entry points that arise during pullbacks or retracements, enabling traders to capitalize on price corrections within the established trend. Important Advan
OmniSync Projection
Antonio-alin Teculescu
5 (1)
Chronos Fractal Engine is an innovative price projection indicator for MetaTrader 5, designed to transform your technical analysis by intelligently identifying and projecting historical price patterns. Built upon an advanced correlation algorithm and the fractal principles of the market, this powerful tool visualizes potential future price movements, giving you a unique edge in your trading decisions. What is Chronos Fractal Engine? At its core, the Chronos Fractal Engine employs a sophisticat
Gartley Hunter Multi
Siarhei Vashchylka
5 (11)
Gartley Hunter Multi - An indicator for searching for harmonic patterns simultaneously on dozens of trading instruments and on all possible timeframes. Manual (Be sure to read before purchasing) | Version for MT4 Advantages 1. Patterns: Gartley, Butterfly, Shark, Crab. Bat, Alternate Bat, Deep Crab, Cypher 2. Simultaneous search for patterns on dozens of trading instruments and on all possible timeframes 3. Search for patterns of all possible sizes. From the smallest to the largest 4. All fou
FX Power MT5 NG
Daniel Stein
5 (31)
FX Power: Analyze Currency Strength for Smarter Trading Decisions Overview FX Power is your go-to tool for understanding the real strength of currencies and Gold in any market condition. By identifying strong currencies to buy and weak ones to sell, FX Power simplifies trading decisions and uncovers high-probability opportunities. Whether you’re looking to follow trends or anticipate reversals using extreme delta values, this tool adapts seamlessly to your trading style. Don’t just trade—trade
More from author
Javat Terminal
Thanaris Pornpattanajamsai
Javat Terminal Javat Terminal is a clean and professional dashboard utility for MetaTrader 5. It is designed to help traders monitor account performance, daily profit history, and useful market information directly from the chart. This tool provides a simple visual control panel for traders who want to check important trading information quickly without switching between many windows. It is suitable for gold, CFD, index, and multi-market monitoring. Main Features Profit Summary Panel
FREE
Filter:
No reviews
Reply to review