Indicadores técnicos para MetaTrader 5 - 22

FusionAlert StochRSI Master es un indicador disponible para las plataformas MT4/MT5, es una combinación del indicador RSI & Estocástico que proporciona "alertas" cuando el mercado está dentro de las regiones de "sobrecompra y sobreventa" combinadas para ambos indicadores, resulta en señales más precisas y exactas para ser usadas como una herramienta maravillosa, en forma de señales de "compra o venta". Este indicador viene con muchas opciones de personalización mencionadas en la sección de parám
FREE

VWAP para Scalpers
Líneas VWAP conscientes de sesión para scalps rápidos y precisos. ️ Entradas (MT4/MT5) Enable_Hourly_VWAP: Activar VWAP horario. Enable_Asia_VWAP: Activar VWAP de sesión Asia. Enable_Europe_VWAP: Activar VWAP de sesión Europa. Enable_NA_VWAP: Activar VWAP de sesión América del Norte. Enable_Extended_VWAP: Activar VWAP de sesión extendida. Enable_Daily_VWAP: Activar VWAP diario. Sesión Asia (GMT) Session_Asia_Start_Hour: Hora de inicio de sesión Asia. Session_Asia_End_Hour: H
FREE

Tired of cluttering your chart with multiple EMA indicators? Multi EMA le permite trazar 5 Medias Móviles Exponenciales desde un único indicador, manteniendo su gráfico limpio y su navegador organizado. Características principales 5 EMAs independientes con periodos totalmente personalizables Habilite/Deshabilite cada EMA individualmente - use sólo lo que necesite 12 opciones de precio de origen incluyendo cálculos estándar y avanzados: Cierre, Apertura, Máximo, Mínimo (H + L) / 2, (H + L + C) /
FREE

Mi producto más popular y demandado está aquí https://www.mql5.com/ru/market/product/41605?source=Site+Market+Product+From+Author#.
El indicador de flecha es ideal para el comercio en una tendencia lateral, que muestra con gran precisión los momentos de sobrecompra y sobreventa de instrumentos, con filtros adicionales también se puede utilizar para el comercio de tendencia. La pantalla muestra flechas que señalan un cambio de tendencia, la dirección de la flecha muestra la dirección futura de l
FREE
The Pulse es un indicador que muestra el período de acumulación en tiempo real. En palabras simples: el Acaparamiento es cuando el "dinero inteligente" recoge silenciosamente un activo antes de lanzar un poderoso movimiento en el mercado. En el gráfico, parece que el precio está "atascado" en un rango. Esta es la fase de acumulación — alguien se está preparando para un gran movimiento. Y si aprendes a notar estos momentos — cuando el mercado parece "congelarse" pero se siente tenso, puedes esta
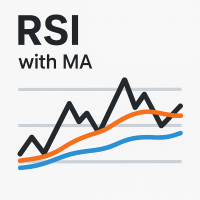
El indicador RSI con medias móviles combina el clásico Índice de Fuerza Relativa con medias móviles personalizables, ofreciendo una visión más profunda del impulso del mercado y la dirección de la tendencia. Al suavizar la curva del RSI con medias a corto y largo plazo, los operadores pueden distinguir mejor los verdaderos retrocesos del ruido. Esta herramienta pone de relieve los niveles de sobrecompra y sobreventa, revela las divergencias entre el precio y el impulso y confirma los puntos de e
FREE

Indicador Introducción: El indicador viene de la red, es más estable en relación con RSI o CCI. Puede configurar el indicador para enviar correos electrónicos / notificaciones / alertas cuando la barra anterior tiene una flecha hacia arriba o hacia abajo, puede especificar el texto de los correos electrónicos mediante la introducción de cadena en el cuadro de parámetros de "UpMessages / DownMessages". Puede ser usado para analizar la tendencia del mercado y diseñar un nuevo experto basado en la
FREE

Cuando se trabaja con varios activos y se tienen varias posiciones abiertas en activos, es un poco complicado visualizar cuando ganancia o ganancia está dando cada problema activo, por eso con esto en mente desarrollamos este indicador donde facilita la visualización de operaciones en activos , donde podrás abrir varios recursos diferentes y podrás visualizar el resultado individual de cada activo y agilizar la toma de decisiones en tu negocio.
FREE
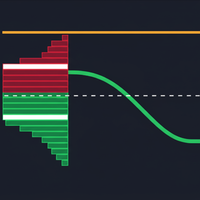
El indicador "Volume Range Profile with Fair Value" (VRPFV) es una potente herramienta de análisis de volumen diseñada para ayudar a los operadores a comprender mejor la estructura del mercado e identificar las zonas de precios clave donde se produce una actividad institucional significativa. En lugar de limitarse a observar el volumen en velas individuales, el VRPFV analiza la distribución del volumen por nivel de precios dentro de un rango temporal específico, proporcionando una visión profund
FREE

If you love this indicator, please leave a positive rating and comment, it will be a source of motivation to help me create more products <3 ¿Cómo utilizar QQE? Determina la tendencia cuando el RSI MA por encima de 50 indica un mercado alcista, mientras que el RSI MA por debajo de 50 indica un mercado bajista y puede servir como filtro de tendencia . Identificar el impulso alcista/bajista a corto plazo.alcista, y cuando el RSI MA cruza a la baja Smoothed indica un impulso bajista.También es pos
FREE

TENDENCIA DE COLOR MA / MACD VELAS dibujar velas MA por encima/por debajo de la media móvil dibujar velas MACD por encima y por debajo de 0 y de la línea de señal
Su ventaja: una vista simple sobre la dirección de la tendencia una vista simple sobre la dirección de tendencia superior un gráfico más tranquilo para el ojo se pueden definir reglas claras Ajustes : Valor Quick-Set : preajustes MACD 3 / 9 / 6 MACD personalizar Velas MA EMA rápida : 12 EMA lenta : 26 MACD SMA : 9 1. Periodo MA : por
FREE

MaRSI Scalper & Trader La combinación de medias móviles y RSI Esta configuración es flexible por lo que se puede establecer con respecto a la prueba de usuario utiliza 1. Para scalping 2. Para operaciones a largo plazo
características 1. Envío de notificaciones push 2. Envía alertas en ordenadores 3. Dibuja flechas 4. Dibuja indicadores respectivos (esta característica se editará en el futuro)
5. Tiene retroalimentación https://t.me/Tz_Trade_Logics o simplemente llama a +255766988200 (telegra
FREE

El AO Hybrid MA Master es un sistema de análisis de momentum avanzado para MQL5 que integra el Awesome Oscillator (AO) de Bill Williams con un modelo de confirmación basado en medias móviles duales . 1. Núcleo del Indicador (Core) Utiliza el algoritmo estándar del AO para medir la fuerza del mercado mediante la diferencia entre una SMA de 5 periodos y una SMA de 34 periodos del precio medio ( $High+Low/2$ ). El histograma está codificado cromáticamente para identificar la aceleración o desaceler
FREE

Gann Hilo — Precisión y claridad en la tendencia Canal de YouTube: @BotPulseTrading
El GannHilo es un indicador técnico diseñado para identificar de forma precisa y visual los cambios de tendencia en el mercado. Combinando la estructura de precios con la teoría de Gann , este sistema traza líneas dinámicas que actúan como guías inteligentes de dirección y soporte . Su diseño minimalista y su algoritmo optimizado permiten una lectura limpia y efectiva , mostrando exactamente cuándo el impulso c
FREE
El Hammer and Doji Scanner es una potente herramienta de análisis técnico diseñada para plataformas MetaTrader, como MetaTrader 4 (MT4) y MetaTrader 5 (MT5), para detectar y resaltar patrones clave de velas, específicamente el Hammer y el Doji . Estos patrones son ampliamente utilizados por los operadores para identificar posibles cambios de tendencia o períodos de indecisión en el mercado. Martillo: El Martillo es un patrón de vela alcista que aparece después de una tendencia bajista. Se caract
FREE
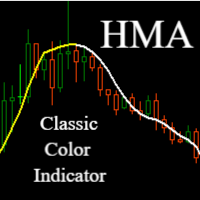
Hull Moving Average (HMA) - Seguimiento de tendencias más rápido y preciso
La media móvil de Hull representa un enfoque revolucionario del análisis de tendencias que supera las deficiencias habituales de las medias móviles tradicionales. Este avanzado indicador, desarrollado por Alan Hull, elimina prácticamente el retardo típico de las medias móviles estándar, al tiempo que mantiene una suavidad de señal excepcional.
Principales ventajas:
Respuesta significativamente más rápida a los cambios
FREE
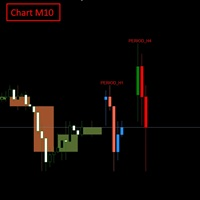
DESCRIPCIÓN COMPLETA DEL PRODUCTO Multi-Timeframe Candle Overlay Pro le permite ver las velas de plazos superiores directamente en su gráfico actual con absoluta precisión. Al operar en marcos temporales inferiores como M1-M15, entender lo que las velas H1-H4 están formando es una gran ventaja: evitas entradas contra tendencia, lees el contexto del mercado más rápido y operas con más confianza.
El indicador admite hasta 2 marcos temporales superiores, dibujando velas OHLC completas con un p
FREE

Tomando inspiración del Curso de Mentoría Privada de ICT en 2016 (mes 05), compartido en YouTube, nuestra innovadora herramienta capacita a los traders para navegar los mercados con precisión. Al marcar períodos de 60, 40 y 20 días, ayuda a identificar movimientos significativos en el mercado, aprovechando la sabiduría transmitida por ICT. Lo que realmente distingue a este indicador es su capacidad de proyección hacia adelante, una característica que ofrece valiosos insights sobre el comportamie
FREE

ChannelRSI5 El indicador de índice de fuerza relativa (RSI) con niveles dinámicos de zonas de sobrecompra y sobreventa.
Los niveles dinámicos cambian y se ajustan a los cambios actuales en el indicador y los precios, y representan una especie de canal.
Configuración del indicador period_RSI: período promedio para calcular el índice RSI. apply_RSI: el precio aplicado. Puede ser cualquiera de las constantes de precio: PRICE_CLOSE: precio de cierre, PRICE_OPEN: precio de apertura, PRICE_HIGH: pre
FREE
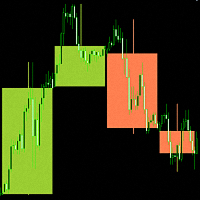
"Candlesticks MTF 5 " es un indicador informativo que muestra "Velas japonesas ". El indicador analiza y determina las horas de apertura y cierre de las velas de los marcos temporales superiores.
Se ha desarrollado un algoritmo para el indicador "Candlesticks MTF 5 " que corrige la discrepancia entre las horas de apertura y cierre de las velas de los marcos temporales superiores. Por ejemplo, si la hora de apertura de una vela en un marco de tiempo semanal es el día 1 del mes, y en el marco de
FREE

Descripción Este indicador técnico está diseñado para automatizar el análisis de la estructura del mercado basándose en conceptos de acción del precio. Identifica y etiqueta los puntos estructurales clave, incluidos los máximos más altos (HH), los mínimos más bajos (LL), los máximos más bajos (LH) y los mínimos más altos (HL), para ayudar a los operadores a visualizar las tendencias del mercado. El indicador utiliza una lógica "Swing Strength" configurable, comprobando un número de barras defini
FREE

Utazima Universal AI - Cuadro de mando institucional de dinero inteligente (GRATIS) Descripción general del producto Utazima Universal AI es un indicador de trading manual profesional diseñado para ayudar a los traders a identificar el comportamiento de los precios institucionales con claridad y precisión. El indicador combina Smart Money Concepts (SMC) , filtrado de mercado basado en IA y lógica de sesión basada en el tiempo (Silver Bullet) en un único y limpio tablero de instrumentos no
FREE

Añade una marca de agua con el nombre del activo que se negocia. Se puede ajustar el tamaño de la fuente y el color del texto. Probado con varios activos B3 y Forex Añadir al gráfico y configurar según sea necesario. Si tiene algún problema, no dude en comunicárnoslo y lo solucionaremos lo antes posible. ______________________________
FREE

Hull Suite por Riz | Indicador MT5 Visión general: Hull Suite es un indicador premium de seguimiento de tendencias que combina tres potentes variaciones de medias móviles de Hull (HMA, EHMA, THMA) en una herramienta versátil. Diseñado para operadores que exigen claridad y precisión, este indicador ayuda a identificar la dirección de la tendencia con un retardo mínimo a la vez que filtra el ruido del mercado. Características principales: Tres variaciones del casco - Cambie entre HMA (clásico), EH
FREE
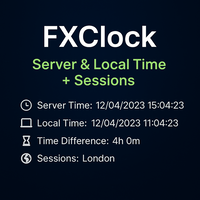
FXClock - Indicador de reloj profesional para operadores Recordatorio importante:
Si encuentra esta herramienta útil, por favor apoye el trabajo dejando un comentario o calificación.
Sus comentarios motivan un mayor desarrollo!
El indicador FXClock es una herramienta práctica y sencilla que muestra la hora directamente en su plataforma de negociación, lo que le permite realizar un seguimiento de varias piezas clave de información al mismo tiempo. Está especialmente diseñado para ayudar a los
FREE

Creo que todos conocéis los Canales Donchian , así que no voy a escribir sobre ello.
Con este indicador he intentado crear una Cinta de Tendencia Donchian utilizando Canales Donchian.
¿Cómo funciona?
- Calcula la dirección de la tendencia principal utilizando la longitud definida por el usuario. asi que puedes cambiarla a tu gusto
- entonces calcula la direccion de la tendencia para cada 9 longitudes inferiores. si pones la longitud = 20 entonces las longitudes son 19, 18,...11
- y compru
FREE
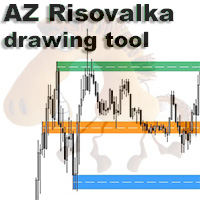
Herramienta de dibujo de niveles AZ Risovalka Un indicador para simplificar el dibujo de niveles. Seleccione el modo de indicador para el cuerpo, la sombra o toda la vela en los ajustes. Haga clic en el botón 'Dibujar' del panel de dibujo para crear un nivel, después haga clic en el cuerpo o en la sombra de la vela y seleccione el color del nivel en el menú de colores que aparece. El botón 'Borrar' para borrar el nivel que selecciones, 'Color' para seleccionar el color de un nivel ya creado. Pue
FREE

Como la mayoría de las cosas que funcionan en el trading, es muy simple. Sin embargo, es una de las herramientas más potentes que tengo y que hace que las entradas de muchos sistemas sean mucho más precisas.
En su esencia, mide la volatilidad reciente frente a la media a medio plazo. ¿Cómo funciona? Los mercados tienden a ser propensos a fuertes movimientos de tendencia cuando la volatilidad relativa es baja y tienden a ser de reversión a la media cuando la volatilidad relativa es alta.
Se pue
FREE

Zenith Session Flux es un indicador técnico de nivel profesional para MetaTrader 5 diseñado para identificar y visualizar las ventanas de negociación institucionales conocidas como ICT Killzones. El indicador automatiza el proceso de alineación temporal sincronizando la hora del servidor de su broker con la hora local de Nueva York, garantizando que los cuadros de sesión y los pivotes de precios aparezcan en los momentos institucionales precisos, independientemente de la zona horaria de su broke
FREE

Indicador TK - Rainbow Descripción: El indicador TK - Rainbow es una herramienta robusta para el análisis técnico, diseñada para proporcionar una visión clara de las tendencias del mercado a través de un enfoque de múltiples líneas. Con 30 líneas calculadas en diferentes períodos, ofrece un análisis extenso de los movimientos de precios. El indicador utiliza un esquema de dos colores para resaltar las tendencias alcistas y bajistas, lo que facilita la interpretación de las condiciones del mercad
FREE

El indicador muestra niveles técnicos importantes en el gráfico. Estos niveles actúan como soporte o resistencia para el movimiento de precios.
Los niveles más importantes son múltiplos de 100 y 50 puntos. También puede mostrar los niveles en múltiplos de 25 puntos.
Cuando el precio alcanza el nivel, se muestra una alerta o notificación automática.
Versión para MT4 https://www.mql5.com/es/market/product/69486 Ajustes Show Levels 100 pips - mostrar niveles en múltiplos de 100 pips Show Levels
FREE
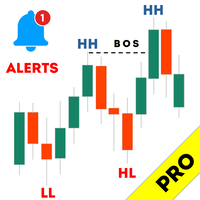
Haven Market Structure PRO - Su Analista de Mercado Profesional Presentamos Haven Market Structure PRO – no es solo un indicador, sino un sistema completo para automatizar el análisis del movimiento de precios, basado en los conceptos clave de Price Action y Smart Money. Esta versión PRO fue creada para los traders que desean obtener el máximo control sobre el gráfico y ver una imagen completa del mercado. Otros productos -> AQUÍ Comprender la estructura del mercado es la base de un trading

Volumen a Precio (VAP) VAP es un mapa térmico de perfil de volumen anclado a la derecha para MetaTrader 5, diseñado para una ejecución limpia, rápida y estable en cualquier gráfico. Muestra dónde se agrupa la actividad comercial, no sólo cuándo, para que pueda leer el balance/desbalance, la migración del valor al contado y planificar las operaciones con referencias precisas: VAH, VAL y POC . Qué muestra VAP Perfil de mapa de calor (tick-volumen):
Un histograma compacto, anclado a la derecha, q
Guía del usuario de Range Identifier v3 1. Visión general El Range Identifier v3 es una herramienta de análisis técnico diseñada para detectar y visualizar automáticamente períodos de consolidación del mercado, comúnmente conocidos como rangos. esta versión MQL5 trae la misma lógica de gran alcance a la plataforma MetaTrader 5. La función principal de este indicador es trazar un canal alrededor de los máximos y mínimos recientes durante los periodos de baja volatilidad. Cuando el precio se sale
FREE
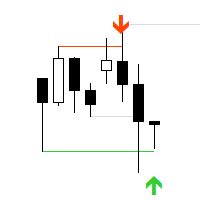
"AV Stop Hunter MT5" es un indicador para MetaTrader 5, que dibuja flechas de entrada para largos y cortos después de las llamadas velas Stop Hunt y tiene varias notificaciones sobre ellas. Dado que se trata de un concepto de dinero inteligente , los períodos H1 y H4 son los mejores. El aumento del volumen mejora la señal, las líneas y flechas son entonces más gruesas. La variante MQL5 tiene velas de stop-hunting coloreadas. NUEVO: Buffer de señal: 1, 0 o -1
Definición :
La caza de stops, tam

¿Está buscando un indicador de señales que realmente funcione? Conozca Phoenix Quantum Signals , la herramienta profesional de acción de precios diseñada para operadores que exigen precisión, no conjeturas.
A diferencia de los indicadores tradicionales que "repintan" (cambian sus señales pasadas para que parezcan buenas), Phoenix Quantum utiliza una lógica propia de "Smart Swing Breakout". Identifica puntos de Estructura de Mercado confirmados y sólo genera una señal cuando se produce una verd
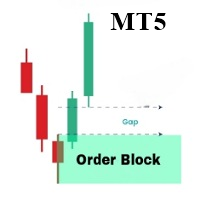
OrderBlock Analyzer es un indicador personalizado para MetaTrader 5 (MT5) diseñado para detectar y resaltar bloques de órdenes (Order Blocks) en los gráficos de precios. Este indicador ayuda a los traders a identificar estructuras clave del mercado, señalando posibles áreas de reversión o continuación. Basado en el comportamiento del mercado, OrderBlock Analyzer dibuja automáticamente los bloques de órdenes y distingue los bloques alcistas y bajistas mediante colores. Características principales
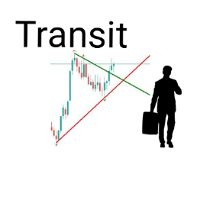
El indicador TransitX1 es muy útil, con señales ilimitadas y funciona en todos los plazos y en todos los muelles. TransitX1 dibuja dos líneas de tendencia muy cortas (+/-20 barras) que pueden considerarse como soporte y resistencia. El soporte se encuentra en la línea de tendencia roja y la resistencia en la línea de tendencia verde. TransitX1 da señales de compra y venta, siendo sólo 3 señales anteriores y la 4ª la señal actual. Las señales de compra son flechas verdes y siempre están en la lín
FREE

Royal Wave es un oscilador Trend-Power que ha sido programado para localizar y señalar zonas de entrada y salida de bajo riesgo. Su algoritmo central analiza estadísticamente el mercado y genera señales de trading para zonas de sobrecompra, sobreventa y baja volatilidad. Mediante el uso de un sistema de alertas bien diseñado, este indicador facilita la toma de decisiones adecuadas con respecto a dónde entrar y dónde salir de las operaciones. Características Algoritmo Trend-Power Zonas de Entrada

Pivot Points Classic - El indicador esencial para todo operador técnico Este indicador dibuja automáticamente los niveles de Puntos Pivote más utilizados por los operadores profesionales, con soporte completo para 4 métodos de cálculo: Métodos soportados :
- Tradicional
- Fibonacci
- Woodie
- Camarilla Características principales :
Cálculo en el marco temporal superior (marco temporal múltiple)
Visualización clara de los niveles P, R1, R2, R3, S1, S2, S3
Etiquetas dinámicas con el nombre y el va
FREE

Price Sessions es un indicador exclusivo de MetaTrader 5 que integra información de símbolos y sesiones de negociación en su gráfico. No enlaza con ninguna información de la cuenta ni con fuentes externas, lo que garantiza la seguridad del usuario. Características principales: 1. Información de Símbolos Símbolo actual Precio Actual Diferencial en tiempo real 2. Sesiones de negociación (Zona horaria UTC/GMT+0) Sesión de Tokio Sesión de Londres Sesión de Nueva York Si esta utilidad le resulta úti
FREE

¡Si te gusta esta herramienta gratuita, echa un vistazo a mi EA que está actualmente en una venta de lanzamiento por sólo $ 39 ! Título: [Visión general] Universal Smart Monitor Pro: Sistema Automatizado de Fibonacci y Acción del Precio ¡Despídase de los gráficos manuales! Universal Smart Monitor Pro es un sistema de análisis técnico profesional que combina los retrocesos de Fibonacci con la lógica de la acción del precio . Con un núcleo totalmente actualizado, este algoritmo es ahora universal
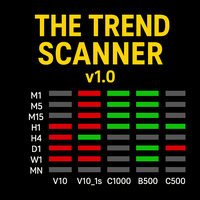
The Trend Scanner – Analizador Multi–Temporalidad y Multi–Activo ¡Descubre la dirección del mercado de un vistazo!
The Trend Scanner es una herramienta poderosa diseñada para operar en Boom & Crash, Índices de Volatilidad, Índices Jump e incluso Forex (EURUSD) , que permite a los traders identificar de inmediato la tendencia alcista o bajista en múltiples activos y temporalidades dentro de una sola y práctica ventana. Características principales: Monitorea tendencias desde M1 hasta Mensual .

True Days es una herramienta diseñada específicamente para el operador que desea captar la volatilidad intradía en los gráficos de precios. True Day facilita al operador evitar operar en la zona muerta, un periodo de tiempo en el que los mercados se consideran muertos o no volátiles. El operador puede concentrarse en encontrar oportunidades sólo durante los periodos de movimientos profundos del mercado. Por defecto, el indicador le da un día real a partir de las 02:00 hasta las 19:00 horas GMT+2
FREE

Descripción del producto Clean, Smart Sessions es un indicador profesional de sesiones bursátiles diseñado para ofrecer a los operadores una visión clara, precisa y despejada de las sesiones bursátiles activas directamente en el gráfico. El indicador detecta y muestra dinámicamente la sesión de negociación activa (Asia, Londres y Nueva York) en tiempo real, dibujando un cuadro de sesión limpio que se actualiza continuamente para reflejar el máximo y el mínimo reales de la sesión. Cuando las ses
FREE

Este indicador escanea para usted hasta 15 instrumentos de negociación y hasta 21 marcos de tiempo para las ocurrencias de los patrones de inversión de alta probabilidad: Doble techo/fondo con falsas rupturas . Qué detecta este indicador: Este indicador detecta una forma especial de Dobles Máximos y Mínimos, llamados Dobles Máximos/Mínimos con rupturas falsas . Para los dobles máximos con rupturas falsas el precio más alto del hombro derecho debe ser más alto que el hombro izquierdo. Para los do

Indicador de media móvil altamente configurable.
Funciones: Funciones de alerta altamente personalizables (en niveles, cruces, cambios de dirección vía email, push, sonido, popup) Capacidad multi timeframe Personalización del color (en niveles, cruces, cambios de dirección) Opción de interpolación lineal Funciona en el probador de estrategias en modo multi timeframe (también en fin de semana sin ticks) Parámetros:
MA Timeframe: Puede establecer los marcos de tiempo inferior/superior para Ma. MA
FREE
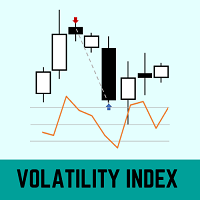
Este indicador utiliza la volatilidad histórica y una media móvil de 21 periodos para definir la distorsión del precio en relación con la media.
El cálculo de la volatilidad histórica se basó en el libro (Odds: The Key to 90% Winners) escrito por Don Fishback.
Un Índice de Volatilidad con un valor superior a 30 puede indicar que el precio está distorsionado con respecto a su precio justo.
PREGUNTAS SOBRE LA INSTALACIÓN DE PRODUCTOS EN META TRADER También puede encontrar algunas instruccio
FREE
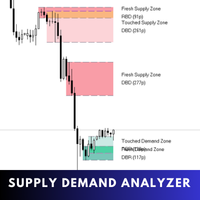
Supply Demand Analyzer es un indicador avanzado de negociación meticulosamente diseñado para la identificación, el análisis y la gestión precisos de las zonas de oferta y demanda. Mediante la integración de datos en tiempo real y algoritmos avanzados, esta herramienta permite a los operadores reconocer las fases del mercado, los movimientos de los precios y los patrones estructurales con una precisión sin precedentes. Simplifica la compleja dinámica del mercado y la convierte en información prác

Spline Searcher MT5 — Indicador multimoneda para la detección temprana de splines de precio y puntos de interés Herramienta auxiliar para la detección y visualización automáticas de las etapas iniciales de formaciones complejas de precio. El indicador está destinado exclusivamente al trading manual y es ideal para traders que experimentan con la identificación temprana de formaciones o tendencias más complejas, de las cuales pueden formar parte estructuras más simples. Detecta hasta seis tipos
FREE
VWMA Signal Pro – Panel Multitemporal de Tendencia Ponderada por Volumen VWMA Signal Pro es un indicador analítico que combina la media móvil ponderada por volumen (VWMA) con filtros de confirmación de tendencia y un panel multitemporal compacto.
Ayuda a identificar la dirección de la tendencia y la fuerza del impulso utilizando acción del precio ponderada por volumen y confirmación de volatilidad. Calcula los valores de VWMA en varios marcos temporales y muestra señales de compra/venta confirm

Bias Scanner Pro identifica la dirección del mercado y la fuerza de la tendencia en tiempo real, ofreciéndole una visión clara de la tendencia alcista, bajista o neutral. Combinando los cruces de EMA con el análisis de tendencia ADX, proporciona un contexto de mercado preciso y perspectivas procesables para operadores de cualquier estilo. Cómo funciona Detección de sesgo: Los cruces EMA rápidos y lentos identifican la dirección alcista, bajista o neutral del mercado. Confirmación de la fuerza de
FREE

Indicador Avanzado de Oscilador Acelerador (AC) con soporte multi-temporalidad, señales visuales personalizables y sistema de alertas altamente configurable.
Características: Marcadores de señal visuales (flechas y/o líneas verticales) con colores y códigos personalizables Tres búferes de señal independientes con disparadores configurables (cambio de dirección, cruce de nivel, pico/valle) Funciones de alerta altamente personalizables para cada señal (vía email, push, sonido, ventana emergente)
FREE

WaveTrendPro Arrow: señal de cruce adaptativa con alertas inteligentes Descripción WaveTrendPro Ar row es un indicador visual limpio y potente diseñado para detectar puntos de inversión de tendencia utilizando el oscilador WaveTrend clásico (cruce WT1/WT2) , mejorado con flechas inteligentes en el gráfico , alertas en tiempo real y notificaciones push móviles . A diferencia de los indicadores WaveTrend tradicionales, que muestran las señales en una subventana, esta versión muestra flechas
FREE

Indicador automático de línea de retroceso de Fibonacci. Este indicador toma la tendencia actual y, si es posible, traza líneas de retroceso de Fibonacci desde la oscilación hasta el precio actual. Los niveles de Fibonacci utilizados son: 0%, 23,6%, 38,2%, 50%, 61,8%, 76,4%, 100%. Este indicador funciona para todos los gráficos en todos los plazos. Los niveles de Fibonacci también se registran en buffers para su uso por otros robots de trading. Cualquier comentario, preocupación o requisito de c
FREE

El indicador Spots se puede utilizar para entrar y salir de sus operaciones basadas en los patrones de velas comunes, tales como: envolvente, hombre colgando, doji, etc. Está diseñado para publicar una notificación de escritorio y móvil cada vez que se activa una señal. Sin embargo, vale la pena señalar que este indicador se recomienda para ser utilizado con otro indicador para confirmar las entradas. Lo mejor es utilizarlo con el indicador Investment Castle Trend Lines y el indicador Supply an
FREE

Necesario para los operadores: herramientas e indicadores Ondas calcular automáticamente los indicadores, el comercio de tendencia del canal Perfecta tendencia de onda de cálculo automático de cálculo de canales , MT4 Perfecta tendencia de onda de cálculo automático de cálculo de canales , MT5 Copia local de trading Copia fácil y rápida , MT4 Copia fácil y rápida , MT5 Copia Local Trading Para DEMO Copia fácil y rápida , MT4 DEMO Copia fácil y rápida , MT5 DEMO "Cooperación QQ:556024" "Cooperac
FREE

Norion Daily Key Levels es un indicador profesional diseñado para mostrar los niveles de referencia de precios más relevantes del día de negociación de forma clara y objetiva. El indicador traza automáticamente niveles diarios esenciales como: Cierre del día anterior Apertura del día actual Máximo diario Mínimo diario Además, el indicador permite la inclusión de otros niveles diarios de referencia personalizados, lo que lo hace adaptable a diferentes estilos de negociación y estrategias de merca
FREE
Trade Hunter MT5 - Indicador de compra y venta
¡Desbloquee oportunidades de trading precisas con Trade Hunter MT5! Este potente indicador identifica potenciales señales de compra y venta mediante el análisis de los movimientos de precios durante un período personalizable. Las flechas azules marcan las oportunidades de compra por debajo de los mínimos clave, mientras que las flechas rojas destacan las señales de venta por encima de los máximos críticos. Con parámetros ajustables como el rango
FREE

Este indicador muestra señales de compra o venta según la definición de Bill Williams de la Zona de Negociación. [ Guía de instalación | Guía de actualización | Solución de problemas | FAQ | Todos los productos ] Fácil de usar y entender Evita operar en mercados planos Indicador determinista con reglas claras El indicador no repinta Implementa alertas de todo tipo Tiene implicaciones directas para el trading Una flecha azul es una señal de compra Una flecha roja es una señal de venta Según Bill
FREE
Indicador de máximo más alto y mínimo más bajo (HH_LL) Descripción : El indicador HH_LL es una herramienta de negociación diseñada para ayudar a los operadores a identificar puntos clave del mercado trazando automáticamente líneas Higher High (HH) y Lower Low (LL) en múltiples marcos temporales. Este indicador permite a los operadores detectar fácilmente niveles significativos en el gráfico, lo que facilita la toma de decisiones de negociación más precisas. Características principales: Análisis
FREE
NtickChart-BVcandle Características Esta es una versión gratuita con funcionalidad limitada.
Este es un indicador de gráfico de tick que se muestra en una sub-ventana. Inspirado en el método de scalping de Bob Volman (BV), está diseñado como una herramienta para lograr un trading simple y efectivo. Es un gráfico de ticks específico para el day trading y el scalping, centrado incluso en cambios de 1 pipeta. En lugar de barras de velas basadas en el tiempo, genera barras de velas para un número
FREE
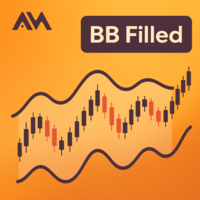
Un indicador limpio de Bandas de Bollinger con relleno de un solo color diseñado para reducir el desorden de los gráficos. Qué es este indicador? Este es un indicador técnico de las Bandas de Bollinger diseñado con la simplicidad visual en mente. A diferencia de las implementaciones estándar de las Bandas de Bollinger que muestran múltiples líneas y bandas de colores, este indicador utiliza un área rellena de un solo color para representar las bandas de negociación. Este enfoque minimiza el des
FREE

Indicador Macd altamente configurable.
Características: Funciones de alerta altamente personalizables (en niveles, cruces, cambios de dirección vía email, push, sonido, popup) Capacidad multi timeframe Personalización del color (en niveles, cruces, cambios de dirección) Opciones de interpolación lineal y modo de histograma Funciona en el probador de estrategias en modo multi timeframe (también en fin de semana sin ticks) Niveles ajustables Parámetros:
Macd Timeframe: puede establecer los plazo
FREE

Indicador del Índice Dinámico de Trader (TDI) altamente configurable.
Características: Funciones de alerta altamente personalizables (en niveles, cruces, cambios de dirección vía email, push, sonido, popup) Capacidad de múltiples marcos temporales (marcos temporales superiores e inferiores también) Personalización del color (en niveles, cruces, cambios de dirección) Opciones de interpolación lineal y modo histograma Funciona en el probador de estrategias en modo multi timeframe (también en fin
FREE

<h2>ATR Smart Levels – Claridad sobre hacia dónde puede moverse el mercado</h2>
<p> Muchos traders pierden no por su estrategia, sino por elegir malos puntos de entrada: demasiado pronto, en medio del rango o sin un buen ratio riesgo-beneficio. <strong>ATR Smart Levels</strong> resuelve este problema con un solo indicador y tres botones. </p>
<p> El indicador dibuja automáticamente tres <strong>zonas objetivo basadas en ATR</strong> (TP1, TP2, TP3) por encima y por debajo del precio actual, m
FREE
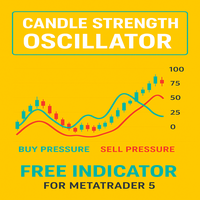
El Índice de Presión de Velas (CPI) es un indicador potente y fácil de usar diseñado para revelar la presión oculta de compra y venta detrás de cada vela. En lugar de mostrar simplemente si el precio subió o bajó, el CPI profundiza en la fuerza con la que los compradores o vendedores controlaron el mercado en cada vela. Esto lo convierte en una herramienta única para identificar la fuerza de la tendencia, detectar retrocesos tempranos y confirmar puntos de entrada o salida con mayor precisión.
FREE

El indicador analiza la estructura de precios de los fractales y determina posibles puntos de reversión en la dinámica del mercado. Los fractales se pueden utilizar como niveles de soporte y resistencia.
Ventajas:
Funciona en todos los instrumentos y series temporales, No vuelve a dibujar sus resultados, Colores personalizables de elementos indicadores. Combina perfectamente con cualquier estrategia de tendencia, Ajustando la fuerza de los fractales.
Indicador de versión MT4 -> AQUÍ / AW Frac
FREE

Sesión de Mercado y Sesión Personalizada dibuja zonas de sesión de mercado (Asia, Londres, Nueva York) además de una sesión definida por el usuario directamente en su gráfico - incluyendo máximos/mínimos de sesión, áreas rellenas opcionales, etiquetas y hover tooltips. Diseñado para operadores intradía, especuladores y analistas que necesitan detectar rápidamente la estructura de la sesión y los niveles recurrentes. Aspectos destacados Referencia visual inmediata de las principales sesiones burs
FREE

Potencia tus capacidades de detección de tendencias con el Consecutive Candle Indicator MT5, una herramienta dinámica diseñada para identificar rachas de velas alcistas o bajistas, ofreciendo alertas oportunas para confirmar tendencias y posibles reversiones en los mercados de forex, acciones, criptomonedas y materias primas. Aclamado en comunidades de trading como Forex Factory y Reddit’s r/Forex, así como elogiado en discusiones en Investopedia y TradingView por su capacidad para simplificar e
FREE
¿Sabe usted por qué MetaTrader Market es el mejor lugar para vender estrategias comerciales e indicadores técnicos? Con nosotros, el desarrollador no tiene que perder tiempo y fuerzas en publicidad, protección del programa y ajustes de cuentas con los compradores. Todo eso ya está hecho.
Está perdiendo oportunidades comerciales:
- Aplicaciones de trading gratuitas
- 8 000+ señales para copiar
- Noticias económicas para analizar los mercados financieros
Registro
Entrada
Si no tiene cuenta de usuario, regístrese
Para iniciar sesión y usar el sitio web MQL5.com es necesario permitir el uso de Сookies.
Por favor, active este ajuste en su navegador, de lo contrario, no podrá iniciar sesión.