Conheça o Mercado MQL5 no YouTube, assista aos vídeos tutoriais
Como comprar um robô de negociação ou indicador?
Execute seu EA na
hospedagem virtual
hospedagem virtual
Teste indicadores/robôs de negociação antes de comprá-los
Quer ganhar dinheiro no Mercado?
Como apresentar um produto para o consumidor final?
Indicadores Técnicos para MetaTrader 5 - 22

FusionAlert StochRSI Master is an indicator available for MT4/MT5 platforms, it is a combination of RSI & Stochastic indicator which provide "alerts" when the market is inside "overbought and oversold" regions combined for both indicators, results in more precise and accurate signals to be used as a wonderful tool, in the form of "buy or sell" signals. This indicator comes with many customization options mentioned in the parameter section below, user can customise these parameters as needful. Jo
FREE

VWAP para Scalpers
Linhas VWAP cientes de sessão para scalps rápidos e precisos. ️ Entradas (MT4/MT5) Enable_Hourly_VWAP: Ativar VWAP por hora. Enable_Asia_VWAP: Ativar VWAP da sessão Ásia. Enable_Europe_VWAP: Ativar VWAP da sessão Europa. Enable_NA_VWAP: Ativar VWAP da sessão América do Norte. Enable_Extended_VWAP: Ativar VWAP da sessão estendida. Enable_Daily_VWAP: Ativar VWAP diário. Sessão Ásia (GMT) Session_Asia_Start_Hour: Hora de início da sessão Ásia. Session_Asia_End_Hour: Hora de tér
FREE

Tired of cluttering your chart with multiple EMA indicators? Multi EMA lets you plot 5 Exponential Moving Averages from a single indicator, keeping your chart clean and your navigator organized. Key Features 5 independent EMAs with fully customizable periods Enable/Disable each EMA individually — use only what you need 12 source price options including standard and advanced calculations: Close, Open, High, Low (H + L) / 2, (H + L + C) / 3, (H + L + C + C) / 4 (O + H + L + C) / 4, (O +
FREE

Мой самый популярный и востребованный продукт здесь https://www.mql5.com/ru/market/product/41605?source=Site+Market+Product+From+Author#
Индикатор стрелочник идеален для торговли в боковике, очень точно показывает моменты перекупленности и перепроданности инструмента, с дополнительными фильтрами также можно использовать для торговли по тренду. На экран выводятся стрелки сигнализирующие о развороте тренда, направление стрелки показывает дальнейшее направление торговли, также имеется звуковое о
FREE
The Pulse indicador que mostra o período de acumulação em tempo real. Em palavras simples: acumulação é quando o "dinheiro inteligente" coleta silenciosamente um ativo antes de lançar um movimento poderoso no mercado. No gráfico, parece que o preço está "preso" em um intervalo. Esta é a fase de acumulação-alguém está se preparando para uma grande jogada. E se você aprender a perceber esses momentos — quando o mercado parece "congelar", mas ao mesmo tempo a tensão é sentida-você pode estar no lu
The RSI with Moving Averages indicator combines the classic Relative Strength Index with customizable moving averages, offering deeper insights into market momentum and trend direction. By smoothing the RSI curve with short- and long-term averages, traders can better distinguish true reversals from noise. This tool highlights overbought and oversold levels, reveals divergences between price and momentum, and confirms entry or exit points with enhanced accuracy. Its adjustable parameters allow tr
FREE

Indicator Introduction: The indicator comes from network ,It is more stable relative to RSI or CCI. You can set the indicator to send emails/notifications/alerts when the previous bar has an up or down arrow, you can specify the text of emails by inputing string into the parameter box of "UpMessages/DownMessages". It can be used to analyze market trend and design new expert that is based on trend. If the indicator below the axis ,this is a buy zone. The trend indicator is suitable for M1 and ab
FREE

Quando se trabalha com vários ativos e tem várias posições abertas em ativos diferentes é um pouco complicado de visualizar quanto de lucro ou prejuízo está em cada ativo, então com esse problema em mente desenvolvi esse indicador onde ele facilita a visualização das operações abertas em cada ativo, onde você poderá abrir vários ativos diferentes e poderá visualizar o resultado individual de cada ativo e agilizar a sua tomada de decisão nos seus trades.
FREE
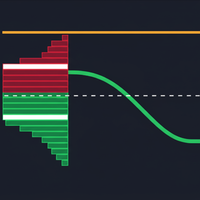
The "Volume Range Profile with Fair Value" (VRPFV) indicator is a powerful volume analysis tool designed to help traders better understand market structure and identify key price areas where significant institutional activity occurs. Instead of just looking at volume on individual candlesticks, VRPFV analyzes the distribution of volume by price level within a specific time range, providing deep insights into the "footprint" of smart money. VRPFV consists of the following core components: Upper &
FREE

If you love this indicator, please leave a positive rating and comment, it will be a source of motivation to help me create more products <3 How to use QQE? Determine trend when RSI MA above 50 indicate a bullish market, while RSI MA below 50 indicate a bearish market and can server as a trend filter. Identify short-term up/down momentum, when the RSI MA crosses up Smoothed signals bullish momentum, and when the RSI MA crosses down Smoothed signals bearish momentum. It is also possible to
FREE

COLORED TREND MA / MACD CANDLES draw MA Candles above/below Moving Average draw MACD Candles above and below 0 and Signal-Line
Your Advantage: a simple view of the trend direction a simple view over the higher trend direction a calmer chart for the eye clear rules can be defined Settings: Value Quick-Set : pre-Settings MACD 3 / 9 / 6 MACD customize MA Candles Fast EMA : 12 Slow EMA : 26 MACD SMA : 9 1. MA Period : default 14 and 20, which are my favorite for all timeframes, I believe in the 14
FREE

MaRSI Scalper & Trader The combination of moving averages and RSI This setting is flexible so it can be set with regards to user test uses 1. For scalping 2. For long time trading
features 1. Sends push notifications 2. Sends alerts on computers 3. Draws Arrows 4. Draws respective indicators (this feature will be edited in the future)
Have feedback https://t.me/Tz_Trade_Logics or just call +255766988200 (telegram/whatsApp) Head to discussion page to leave your comments Improvement are on the
FREE

El AO Hybrid MA Master es un sistema de análisis de momentum avanzado para MQL5 que integra el Awesome Oscillator (AO) de Bill Williams con un modelo de confirmación basado en medias móviles duales . 1. Núcleo del Indicador (Core) Utiliza el algoritmo estándar del AO para medir la fuerza del mercado mediante la diferencia entre una SMA de 5 periodos y una SMA de 34 periodos del precio medio ( $High+Low/2$ ). El histograma está codificado cromáticamente para identificar la aceleración o desaceler
FREE

Gann Hilo — Precisão e Clareza na Tendência Canal do YouTube: @BotPulseTrading O GannHilo é um indicador técnico projetado para identificar com precisão e clareza visual as mudanças de tendência no mercado. Combinando a estrutura de preço com a teoria de Gann , o sistema traça linhas dinâmicas que atuam como guias inteligentes de direção e suporte . Seu design minimalista e algoritmo otimizado permitem uma leitura limpa e eficaz , mostrando exatamente quando o impulso muda de direção, sem ruído
FREE
The Hammer and Doji Scanner is a powerful technical analysis tool designed for MetaTrader platforms, such as MetaTrader 4 (MT4) and MetaTrader 5 (MT5), to detect and highlight key candlestick patterns, specifically the Hammer and Doji . These patterns are widely used by traders to identify potential trend reversals or periods of indecision in the market. Hammer: The Hammer is a bullish reversal candlestick pattern that appears after a downtrend. It is characterized by a small body near the top o
FREE
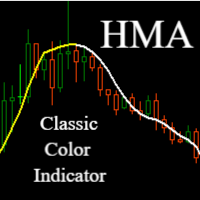
Hull Moving Average (HMA) - Faster and More Precise Trend Tracking
Hull Moving Average represents a revolutionary approach to trend analysis that overcomes the common shortcomings of traditional moving averages. This advanced indicator, developed by Alan Hull, practically eliminates the lag typical for standard moving averages while maintaining exceptional signal smoothness.
Key Benefits:
Significantly faster response to trend changes than traditional moving averages Minimal lag while mainta
FREE
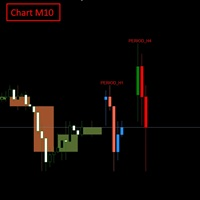
FULL PRODUCT DESCRIPTION Multi-Timeframe Candle Overlay Pro lets you view higher-timeframe candles directly on your current chart with absolute accuracy. When trading lower timeframes like M1–M15, understanding what the H1–H4 candles are forming is a major advantage: you avoid counter-trend entries, read market context faster, and trade with more confidence.
The indicator supports up to 2 higher timeframes, drawing full OHLC candles with precise positioning—no misalignment, no distortion. C
FREE

Com inspiração no Curso de Mentoramento Privado da ICT em 2016 (mês 05), compartilhado no YouTube, nossa inovadora ferramenta capacita os traders a navegarem nos mercados com precisão. Ao marcar períodos de 60, 40 e 20 dias, ajuda a identificar movimentos significativos no mercado, aproveitando a sabedoria transmitida por ICT. O que realmente distingue este indicador é sua capacidade de projeção para frente, uma característica que oferece valiosas visões sobre o comportamento futuro do mercado c
FREE

ChannelRSI5 O indicador Relative Strength Index (RSI) com níveis dinâmicos de zonas de sobrecompra e sobrevenda.
Os níveis dinâmicos mudam e se ajustam às mudanças atuais no indicador e nos preços e representam uma espécie de canal.
Configurações do indicador period_RSI - Período médio para calcular o índice RSI. Applicated_RSI - O preço aplicado. Pode ser qualquer uma das constantes de preço: PRICE_CLOSE - Preço de fechamento, PRICE_OPEN - Preço de abertura, PRICE_HIGH - Preço máximo para o p
FREE
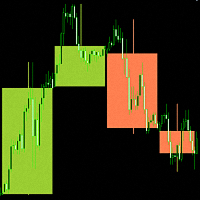
"Candlesticks MTF 5" is an informational indicator that displays "Japanese Candlesticks" . The indicator analyzes and determines the opening and closing times of candles from higher time frames.
An algorithm has been developed for the "Candlesticks MTF 5" indicator that corrects the discrepancy between the opening and closing times of candles from higher time frames. For example, if the opening time of a candle on a weekly time frame is the 1st of the month, and on the smaller time frame this
FREE

Description This technical indicator is designed to automate the analysis of market structure based on price action concepts. It identifies and labels key structural points, including Higher Highs (HH), Lower Lows (LL), Lower Highs (LH), and Higher Lows (HL), to assist traders in visualizing market trends. The indicator uses a configurable "Swing Strength" logic, checking a user-defined number of bars to the left and right of a pivot to confirm its validity. It also identifies Break of Structure
FREE

Utazima Universal AI – Institutional Smart Money Dashboard (FREE) Product Overview Utazima Universal AI is a professional manual trading indicator designed to help traders identify institutional price behavior with clarity and precision. The indicator combines Smart Money Concepts (SMC) , AI-based market filtering , and time-based session logic (Silver Bullet) into a single, clean non-repainting dashboard for MetaTrader 5. This tool is suitable for traders who want structure, confirmation,
FREE

Adiciona marca d'água com nome do ativo em negociação. Pode ser ajustado definindo tamanho da fonte e coloração do texto. Testado com vários ativos do mercado B3 e Forex Adione ao gráfico e configure de acordo com a necessidade. Caso tenha problemas sinta-se a-vontade para nos avisar e providenciaremos a correção logo que possível. ______________________________
FREE

Hull Suite by Riz | MT5 Indicator Overview: Hull Suite is a premium trend-following indicator that combines three powerful Hull Moving Average variations (HMA, EHMA, THMA) into one versatile tool. Designed for traders who demand clarity and precision, this indicator helps identify trend direction with minimal lag while filtering out market noise. Key Features: Three Hull Variations – Switch between HMA (classic), EHMA (exponential smoothing), and THMA (triple weighted) to match your trading styl
FREE
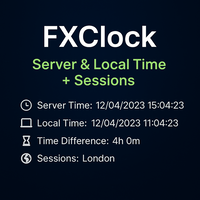
FXClock – Professional Clock Indicator for Traders Important Reminder:
If you find this tool helpful, please support the work by leaving a comment or rating.
Your feedback motivates further development!
The FXClock indicator is a practical and simple tool that displays time directly on your trading platform, allowing you to track multiple key pieces of information at the same time. It is specially designed to help traders synchronize their trading with market hours and global sessions. Key F
FREE

I think you all know Donchian Channels. so I am not going to write about it.
With this indicator I tried to create Donchian Trend Ribbon by using Donchian Channels.
How it works ?
- it calculates main trend direction by using the length that is user-defined. so you can change it as you wish
- then it calculates trend direction for each 9 lower lengths. if you set the length = 20 then the lengths are 19, 18,...11
- and it checks if the trend directions that came from lower lengths is same
FREE
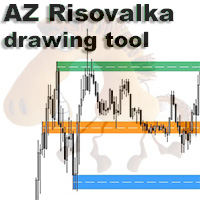
AZ Risovalka levels drawing tool An indicator for simplifying the drawing of levels. Select the indicator mode for the body, shadow, or the whole candle in the settings. Click the 'Draw' button on the drawing panel to create a level, then click on the body or shadow of the candle and select the level color in the color menu that appears. The 'Delete' button to delete level you select, 'Color' to select the color of an already created level. You can set your own colors in the indicator menu (6 co
FREE

Like most things that work in trading, it's really simple. However, it's one of the most powerful tools I have that makes entries of many systems much more precise.
In its essence, it measures the recent volatility against the medium-term average. How does it work? Markets tend to be prone to strong trending movements when relative volatility is low and tend to be mean-reverting when relative volatility is high.
It can be used with both mean-reversion systems (like the Golden Pickaxe) and mo
FREE

Zenith Session Flux is a professional-grade technical indicator for MetaTrader 5 designed to identify and visualize institutional trading windows known as ICT Killzones. The indicator automates the process of time-alignment by synchronizing your broker's server time with New York local time, ensuring that session boxes and price pivots appear at the precise institutional moments regardless of your broker's timezone. Indicator Features: Automatic Timezone Sync: Automatically calculates the offset
FREE

Indicador TK - Rainbow Descrição: O indicador TK - Rainbow é uma ferramenta robusta para análise técnica, projetada para fornecer uma visão clara das tendências de mercado por meio de uma abordagem com várias linhas. Com 30 linhas calculadas em diferentes períodos, oferece uma análise extensa dos movimentos de preços. O indicador utiliza um esquema de duas cores para destacar tendências de alta e baixa, facilitando a interpretação das condições do mercado de relance. Principais Características:
FREE

O indicador exibe níveis técnicos importantes no gráfico. Esses níveis atuam como suporte ou resistência para o movimento dos preços.
Os níveis mais importantes são múltiplos de 100 e 50 pontos. Você também pode exibir níveis em múltiplos de 25 pontos.
Quando o preço atinge o nível, um alerta ou notificação por push é exibido.
Versão para MT4 https://www.mql5.com/pt/market/product/69486 Configurações Show Levels 100 pips - mostra os níveis em múltiplos de 100 pips Show Levels 50 pips - mostr
FREE
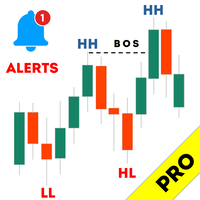
Haven Market Structure PRO - Seu Analista de Mercado Profissional Apresentando Haven Market Structure PRO – este não é apenas um indicador, mas um sistema completo para automatizar a análise do movimento de preços, baseado nos conceitos-chave de Price Action e Smart Money. Esta versão PRO foi criada para traders que desejam ter o máximo controle sobre o gráfico и ver uma imagem completa do mercado. Outros produtos -> AQUI Entender a estrutura do mercado é a base para um trading lucrativo. O

Volume at Price (VAP) VAP is a right-anchored Volume Profile Heatmap for MetaTrader 5 designed for clean, fast, and stable execution on any chart. It shows where trading activity clustered, not just when—so you can read balance/imbalance, spot value migration, and plan trades with precise references: VAH, VAL, and POC . What VAP shows Heatmap Profile (tick-volume):
A compact, right-anchored histogram that scales with the chart. Value Area (~70%) in Gold Non-Value in White Soft shadow gradient
Range Identifier v3 User Guide 1. Overview The Range Identifier v3 is a technical analysis tool designed to automatically detect and visualize periods of market consolidation, commonly known as ranges. this MQL5 version brings the same powerful logic to the MetaTrader 5 platform. The primary function of this indicator is to draw a channel around recent highs and lows during periods of low volatility. When the price breaks out of this channel, the indicator provides an alert, helping traders iden
FREE
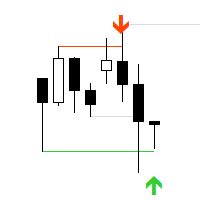
"AV Stop Hunter MT5" is an indicator for MetaTrader 5, which draws entry arrows for long and short after so-called Stop Hunt candles and has several notifications about them. Since this is a smart money concept , the periods H1 and H4 are the best. Increasing volume improves the signal, lines and arrows are then thicker. The MQL5 variant has colored stop-hunting candles. NEW: Signal Buffer: 1, 0 or -1
Definition :
Stop hunting, also known as stop running, is the practice of institutional trad

Are you looking for a signal indicator that actually works? Meet Phoenix Quantum Signals , the professional Price Action tool designed for traders who demand precision, not guesswork.
Unlike traditional indicators that "repaint" (change their past signals to look good), Phoenix Quantum uses a proprietary "Smart Swing Breakout" logic. It identifies confirmed Market Structure points and only generates a signal when a true breakout occurs.
Why Phoenix Quantum? The #1 problem with arrow indicator
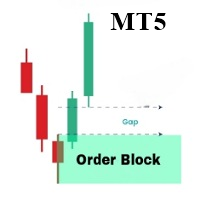
OrderBlock Analyzer é um indicador personalizado para MetaTrader 5 (MT5) projetado para detectar e destacar Blocos de Ordens (Order Blocks) nos gráficos de preços. Este indicador auxilia os traders na identificação de estruturas-chave do mercado, sinalizando possíveis áreas de reversão ou continuação. Baseado no comportamento do mercado, o OrderBlock Analyzer desenha automaticamente os blocos de ordens e distingue blocos de alta e baixa com cores diferentes. Principais características: Detecção

TransitX1 indicator is very useful, with unlimited signals and works on all the timeframes and all the piers. TransitX1 draws two trend lines very short trendlines (+/-20 bars) which can be considered as support and resistance. The support is in red trendline and the resistance is in green trendline. TransitX1 gives buying and selling signals, with only 3 being previous signals and the 4th one being the current signal. Buying signals are in green arrows and are always on the support trendline an
FREE

Royal Wave is a Trend-Power oscillator which has been programmed to locate and signal low-risk entry and exit zones. Its core algorithm statistically analyzes the market and generates trading signals for overbought, oversold and low volatile areas. By using a well-designed alerting system, this indicator makes it easier to make proper decisions regarding where to enter and where to exit trades. Features Trend-Power Algorithm Low risk Entry Zones and Exit Zones Predictions for Overbought and Over

Pivot Points Classic – L’indicatore essenziale per ogni trader tecnico Questo indicatore disegna automaticamente i livelli di Pivot Point più utilizzati dai trader professionisti, con supporto completo a 4 metodi di calcolo: Metodi supportati :
• Traditional
• Fibonacci
• Woodie
• Camarilla Caratteristiche principali :
Calcolo su timeframe superiore (multi-timeframe)
Visualizzazione chiara dei livelli P, R1, R2, R3, S1, S2, S3
Etichette dinamiche con nome e valore del livello
Colori per
FREE

Price Sessions is an exclusive MetaTrader 5 indicator that integrates symbol information and trading sessions into your chart. It does not link to any account information or external sources, ensuring user safety. Main Features: 1. Symbol Information Current Symbol Live Price Live Spread 2. Trading Sessions (Time zone UTC/GMT+0) Tokyo session London session New York session If you find this utility helpful, please rate it. If you encounter any issues or have suggestions, pleas
FREE

If you like this free tool, check out my EA which is currently on a Launch Sale for only $39 ! Title: [Overview] Universal Smart Monitor Pro: Automated Fibonacci & Price Action System Say goodbye to manual charting! Universal Smart Monitor Pro is a professional-grade technical analysis system that combines Fibonacci Retracements with Price Action logic. With a fully upgraded core, this algorithm is now universally compatible across all markets. It automatically adapts to the volatility characte
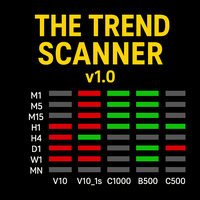
The Trend Scanner – Multi-Timeframe & Multi-Asset Analyzer Discover market direction at a glance!
The Trend Scanner is a powerful tool designed for Boom & Crash, Volatility Indices, Jump Indices, and even Forex (EURUSD) , allowing traders to instantly spot bullish or bearish trends across multiple assets and timeframes in a single, easy-to-read window. Key Features: Monitors trends from M1 up to Monthly . Covers a wide range of assets:
Boom & Crash Indices
Volatility Indices
Jump Indice

True Days is a tool designed specifically for the trader who wants to catch intraday volatility in price charts. True day makes it easier for the trader to avoid trading in the dead zone - a period in time where markets are considered dead or non volatile. The trader can concentrate on finding opportunities only during periods of profound market movements. By default the indicator gives you a true day starting at 02:00 to 19:00 hours GMT+2. You can adjust according to your Time Zone. By deafult
FREE

Product Description Clean, Smart Sessions is a professional trading sessions indicator designed to provide traders with a clear, accurate, and clutter-free view of the active market sessions directly on the chart. The indicator dynamically detects and displays the active trading session (Asian, London, and New York) in real time, drawing a clean session box that continuously updates to reflect the session’s true high and low. When sessions overlap, each active session is handled independently
FREE

This indicator scans for you up to 15 trading instruments and up to 21 time frames for occurrences of the high probability reversal patterns: Double Tops/Bottoms with fake breakouts . What this indicator detects: This indicator detects a special form of Double Tops and Bottoms, so called Double Tops/Bottoms with fake breakouts . For double tops with fake breakouts the highest price of the right shoulder must be higher than the left shoulder. For double bottoms with fake breakouts the lowest pric

Highly configurable Moving average indicator.
Features: Highly customizable alert functions (at levels, crosses, direction changes via email, push, sound, popup) Multi timeframe ability Color customization (at levels, crosses, direction changes) Linear interpolation option Works on strategy tester in multi timeframe mode (at weekend without ticks also) Parameters:
MA Timeframe: You can set the lower/higher timeframes for Ma. MA Bar Shift: Y ou can set the offset of the line drawing. MA Period,
FREE
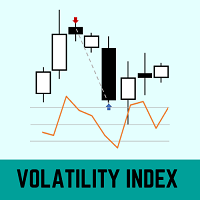
Esse indicador utiliza a volatilidade histórica e uma média móvel de 21 períodos para definir a distorção do preço em relação a média. O cálculo da volatilidade histórica foi baseado no livro (Odds: The Key to 90% Winners) escrito por Don Fishback. O Volatility Index com valor superior a 30 pode indicar que o preço está distorcido em relação ao seu preço justo.
DÚVIDAS SOBRE INSTALAÇÃO DE PRODUTOS NO META TRADER Você também pode encontrar algumas instruções sobre como instalar um robô na loja
FREE
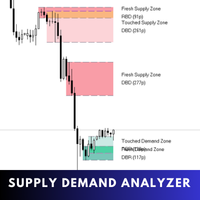
Supply Demand Analyzer is an advanced trading indicator meticulously designed for the precise identification, analysis, and management of supply and demand zones. By integrating real-time data and advanced algorithms, this tool enables traders to recognize market phases, price movements, and structural patterns with unparalleled accuracy. It simplifies complex market dynamics into actionable insights, empowering traders to anticipate market behavior, identify trading opportunities, and make in

Spline Searcher MT5 — Indicador multimoeda para detecção precoce de splines de preço e pontos de interesse Ferramenta auxiliar para detecção e visualização automáticas das fases iniciais de formações complexas de preço. O indicador é destinado exclusivamente à negociação manual e é adequado para traders que experimentam a detecção precoce de formações ou tendências de mercado mais complexas, das quais formações mais simples podem fazer parte. O indicador identifica até seis tipos de formações i
FREE
VWMA Signal Pro – Painel Multitemporal de Tendência Ponderada por Volume VWMA Signal Pro é um indicador analítico que combina a média móvel ponderada por volume (VWMA) com filtros de confirmação de tendência e um painel multitemporal compacto.
Ajuda o trader a identificar a direção da tendência e a força do momento com base em volume e volatilidade. O indicador calcula valores de VWMA em vários períodos e exibe sinais de compra/venda confirmados pelos filtros ADX, ATR e VWAP. Cada sinal é class

Bias Scanner Pro identifies market direction and trend strength in real time, giving you a clear view of bullish, bearish, or neutral bias. By combining EMA crossovers with ADX trend analysis, it delivers precise market context and actionable insights for traders of any style. How It Works Bias Detection: Fast and slow EMA crossovers identify bullish, bearish, or neutral market direction. Trend Strength Confirmation: ADX measures trend intensity, confirming whether the market is trending, rangin
FREE

Indicador Avançado de Oscilador Acelerador (AC) com suporte multi-temporalidade, sinais visuais personalizáveis e sistema de alertas altamente configurável.
Recursos: Marcadores de sinal visuais (setas e/ou linhas verticais) com cores e códigos personalizáveis Três buffers de sinal independentes com gatilhos configuráveis (mudança de direção, cruzamento de nível, pico/vale) Funções de alerta altamente personalizáveis para cada sinal (via email, push, som, popup) Temporização de alerta configurá
FREE

WaveTrendPro Arrow – Adaptive Cross Signal with Smart Alerts Description WaveTrendPro Arrow is a clean and powerful visual indicator designed to detect trend-reversal points using the classic WaveTrend oscillator (WT1/WT2 cross) , enhanced with intelligent on-chart arrows , real-time alerts , and mobile push notifications . Unlike traditional WaveTrend indicators that display signals in a subwindow, this version shows precise entry arrows directly on the main chart , positioned adaptively
FREE

Automatic Fibonacci Retracement Line Indicator. This indicator takes the current trend and if possible draws Fibonacci retracement lines from the swing until the current price. The Fibonacci levels used are: 0%, 23.6%, 38.2%, 50%, 61.8%, 76.4%, 100%. This indicator works for all charts over all timeframes. The Fibonacci levels are also recorded in buffers for use by other trading bots. Any comments, concerns or additional feature requirements are welcome and will be addressed promptly.
FREE

The Spots Indicator can be used for Entering and Exiting your trades based on the common candlestick patterns such as: engulfing, hanging man, doji etc. It is designed to publish desktop and mobile notification every time a signal is triggered. However, it is worth noting that this indicator is recommended to be used with other indicator for confirming the entries. It is best to use it with the Investment Castle Trend Lines indicator and the Supply and Demand indicator .
FREE

Necessary for traders: tools and indicators Waves automatically calculate indicators, channel trend trading Perfect trend-wave automatic calculation channel calculation , MT4 Perfect trend-wave automatic calculation channel calculation , MT5 Local Trading copying Easy And Fast Copy , MT4 Easy And Fast Copy , MT5 Local Trading copying For DEMO Easy And Fast Copy , MT4 DEMO Easy And Fast Copy , MT5 DEMO "Cooperative QQ:556024" "Cooperation wechat:556024" "Cooperative email:556024@qq.com" Strong
FREE

Norion Daily Key Levels é um indicador profissional desenvolvido para exibir, de forma clara e objetiva, os principais níveis de preço de referência do dia de negociação. O indicador plota automaticamente níveis essenciais como: Fechamento do dia anterior Abertura do dia atual Máxima do dia Mínima do dia Além disso, o indicador permite a inclusão de outros níveis diários personalizados, tornando-o flexível para diferentes estilos operacionais e estratégias de mercado. Esses níveis são amplamente
FREE

Trade Hunter MT5 - Buy and Sell Indicator
Unlock precise trading opportunities with Trade Hunter MT5! This powerful indicator identifies potential buy and sell signals by analyzing price movements over a customizable period. Blue arrows mark buy opportunities below key lows, while red arrows highlight sell signals above critical highs. With adjustable parameters like bar range, percentage offset, and alert settings, Trade Hunter adapts to your strategy. Optional alerts and notifications ensur
FREE

This indicator displays buy or sell signals according to Bill Williams' definition of the Trading Zone. [ Installation Guide | Update Guide | Troubleshooting | FAQ | All Products ] Easy to use and understand Avoid trading flat markets Deterministic indicator with clear rules The indicator is non-repainting It implements alerts of all kinds It has straightforward trading implications. A blue arrow is a buy signal A red arrow is a sell signal According to Bill Williams trading in the zone helps t
FREE
Highest High and Lowest Low (HH_LL) Indicator Description: The HH_LL Indicator is a trading tool designed to help traders identify key market points by automatically drawing Higher High (HH) and Lower Low (LL) lines across multiple timeframes. This indicator allows traders to easily spot significant levels on the chart, facilitating more accurate trading decisions. Key Features: Multi-Timeframe Analysis: The indicator supports various timeframes, including M30, H1, and H4. This enables traders t
FREE
NtickChart-BVcandle Features This is a free version with limited functionality.
This is a tick chart indicator that displays in a sub-window. Inspired by Bob Volman's (BV) scalping method, it is designed as a tool for achieving simple and effective trading. It is a tick chart specifically for day trading and scalping, focusing even on 1 pipette changes. Instead of time-based candle bars, it generates candle bars for a specified number of ticks (ticks_in_candle). This allows for a more detailed
FREE
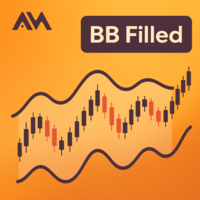
A clean Bollinger Bands indicator with single-color filling designed to reduce chart clutter. What is This Indicator? This is a Bollinger Bands technical indicator designed with visual simplicity in mind. Unlike standard Bollinger Bands implementations that display multiple colored lines and bands, this indicator uses a single-color filled area to represent the trading bands. This approach minimizes visual clutter while maintaining full functionality for technical analysis. How It Works The ind
FREE

Highly configurable Macd indicator.
Features: Highly customizable alert functions (at levels, crosses, direction changes via email, push, sound, popup) Multi timeframe ability Color customization (at levels, crosses, direction changes) Linear interpolation and histogram mode options Works on strategy tester in multi timeframe mode (at weekend without ticks also) Adjustable Levels Parameters:
Macd Timeframe: You can set the lower/higher timeframes for Macd. Macd Bar Shift: you can set the o
FREE

Highly configurable Trader Dynamic Index (TDI) indicator.
Features: Highly customizable alert functions (at levels, crosses, direction changes via email, push, sound, popup) Multi timeframe ability (higher and lower timeframes also) Color customization (at levels, crosses, direction changes) Linear interpolation and histogram mode options Works on strategy tester in multi timeframe mode (at weekend without ticks also) Adjustable Levels Parameters:
TDI Timeframe: You can set the lower/higher ti
FREE

ATR Smart Levels – Clareza sobre até onde o mercado pode realmente ir Muitos traders perdem não por sua estratégia, mas por entrar em locais ruins: muito cedo, no meio do range ou sem uma boa relação risco-retorno. ATR Smart Levels resolve isso com um indicador e três botões simples. Ele desenha automaticamente três zonas de alvo baseadas no ATR (TP1, TP2, TP3) acima e abaixo do preço atual. O que o ATR Smart Levels faz Calcula ATR no timeframe selecionado. Cria alvos superiores. Cria alvos infe
FREE
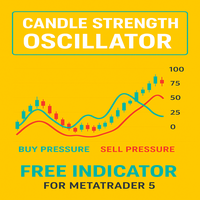
Candle Pressure Index (CPI) is a powerful yet easy-to-use indicator designed to reveal the hidden buying and selling pressure behind every candle. Instead of simply showing whether the price moved up or down, CPI digs deeper into how strongly buyers or sellers controlled the market within each candle. This makes it a unique tool for identifying trend strength, spotting reversals early, and confirming entry or exit points with higher accuracy.
Unlike traditional oscillators that only react to p
FREE

O indicador analisa a estrutura de preços dos fractais e determina possíveis pontos de reversão na dinâmica do mercado. Fractais podem ser usados como níveis de suporte e resistência
Vantagens:
Funciona em todos os instrumentos e séries temporais, Não redesenha seus resultados, Cores personalizáveis dos elementos indicadores, Combina perfeitamente com qualquer estratégia de tendência, Ajustando a força dos fractais.
Indicador de versão MT4 -> AQUI / AW Fractais EA MT5 -> AQUI
FREE

Market Session and Custom Session draws market session zones (Asia, London, New York) plus a user-defined session directly on your chart — including session highs/lows, optional filled areas, labels and hover tooltips. Built for intraday traders, scalpers and analysts who need to spot session structure and recurring levels quickly. Highlights Immediate visual reference for major trading sessions. Automatic session High/Low markers — great for breakout setups and volatility analysis. User-definab
FREE

Potencie suas capacidades de detecção de tendências com o Consecutive Candle Indicator MT5, uma ferramenta dinâmica projetada para identificar sequências de velas altistas ou baixistas, oferecendo alertas oportunos para confirmações de tendência e possíveis reversões nos mercados de forex, ações, criptomoedas e commodities. Aclamado em comunidades de trading como Forex Factory e Reddit’s r/Forex, além de elogiado em discussões no Investopedia e TradingView por sua capacidade de simplificar a aná
FREE
Você sabe por que o mercado MetaTrader é o melhor lugar para vender as estratégias de negociação e indicadores técnicos? Não há necessidade de propaganda ou software de proteção, muito menos problemas de pagamentos. Tudo é providenciado no mercado MetaTrader.
Você está perdendo oportunidades de negociação:
- Aplicativos de negociação gratuitos
- 8 000+ sinais para cópia
- Notícias econômicas para análise dos mercados financeiros
Registro
Login
Se você não tem uma conta, por favor registre-se
Para login e uso do site MQL5.com, você deve ativar o uso de cookies.
Ative esta opção no seu navegador, caso contrário você não poderá fazer login.