适用于MetaTrader 5的技术指标 - 22
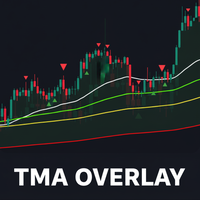
TMA Overlay Indicator for MT5 - User Guide 1. Introduction TMA Overlay is a versatile technical analysis indicator for the MetaTrader 5 platform. The indicator's goal is to provide traders with a comprehensive overview of the trend, potential entry signals, and key trading sessions, all integrated into a single chart. This is not a trading system, but a comprehensive analysis tool designed to help you make more informed decisions. 2. Core Indicator Components The indicator consists of multiple c
FREE

Are You Tired Of Getting Hunted By Spikes And Whipsaws?
Don't become a victim of the market's erratic moves.. Do Something About It!
Instantly make smarter decisions with Impulse Pro's precise balance of filters and accurate statistics.
Timing Is Everything In Trading
To learn more, please visit www.mql5.com/en/blogs/post/718212 Anticipate the next big move before it unfolds in 3 Simple Steps!
Advantages You Get
Early impulse detection algorithm.
Flexible combination to different trading s

The Stochastic RSI (StochRSI) is a technical indicator that combines the characteristics of the Relative Strength Index (RSI) with the Stochastic Oscillator, resulting in a more sensitive tool that generates a higher number of trading signals. Developed by Tushar Chande and Stanley Kroll, the indicator was designed to overcome a perceived limitation of the traditional RSI: the low frequency of overbought and oversold levels activation (commonly 80 and 20), especially in less volatile assets. Ho
FREE

ATR Plus is an enhanced version of the classic ATR that shows not just volatility itself, but the directional energy of the market .
The indicator converts ATR into a normalized oscillator (0–100), allowing you to clearly see: who dominates the market — buyers or sellers when a trend begins when a trend loses strength when the market shifts into a range where volatility reaches exhaustion zones ATR Plus is perfect for momentum, trend-following, breakout and volatility-based systems. How ATR Plus
FREE

RSI警报(对于Metatrader 5)
该指标的工作方式与普通RSI一样,具有所有设置(周期性,颜色,水平等),
但是,另外,可以在上限和下限设置警报(示例70和30),并且可以通过移动蓝线和红线来建立上限和下限来调整这些级别。
您还可以打开和关闭一个附加功能,当达到预期的较高或较低的RSI时,将在图表上创建一个箭头。
RSI警报(对于Metatrader 5)
该指标的工作方式与普通RSI一样,具有所有设置(周期性,颜色,水平等),
但是,另外,可以在上限和下限设置警报(示例70和30),并且可以通过移动蓝线和红线来建立上限和下限来调整这些级别。
您还可以打开和关闭一个附加功能,当达到预期的较高或较低的RSI时,将在图表上创建一个箭头。

欢迎使用 HiperCube Renko Candles Darwinex Zero 25% 折扣码:DWZ2328770MGM 此指标为您提供真实的市场信息,将其转换为 Renko Candle Style。
定义 Renko 图表是一种金融图表,用于测量和绘制价格变化,使用砖块(或条形)表示价格变动。与传统烛台图不同,Renko 图表不显示基于时间的信息,仅关注价格波动。 特点: 单独窗口中的指标 自定义蜡烛颜色 自定义蜡烛/砖块大小(以点为单位) Chatgpt 和 AI 被用于开发它 Renko 策略示例: 识别趋势 等待回调和使用 Renko 蜡烛吞没 输入您的入场点 SL 吞没的较低点 TP 风险回报 1:2、1:3... 请注意,这是一个示例,可以作为基础或新策略,无论如何在真实账户中尝试和测试它,这些信息仅供您了解如何使用 Renko Candles Hipercube 指标
FREE
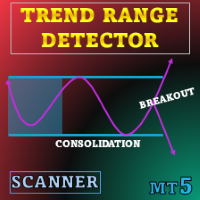
特别优惠 : ALL TOOLS ,每个仅 $35 ! 此工具在接下来的 3 天内免费 ,不要错过! 新工具 将以 $30 的价格出售 首周 或 前 3 次购买 ! Trading Tools Channel on MQL5 :加入我的 MQL5 频道,获取最新动态 Trend Range Detector 为偏好结构化、数据驱动的价格整理视图的用户而设计。它使用明确的波动率规则显示价格停顿及突破起点,避免主观解读图表。 MT4 版本请见: Trend Range Detector MT4 Scanner 更多产品: All P roducts 概述 Trend Range Detector Scanner 是一款技术指标,通过根据波动率和近期价格动作绘制箱体来标识价格压缩阶段。当收盘价保持在指定区间内时绘制箱体;一旦突破区间即更新。 结合波动区间与加权中心线,该指标减少噪音并勾勒相对稳定区域。适用于监测吸筹、派发、突破评估和均值回归。 同一框架适合区间交易、整理阶段分析以及观测常在趋势前出现的波动收缩。 工作原理 区间生成引擎 距离过滤 – 最近收
Free Until 1st Jan 2026
VWAR 2.2 (Volume Weighted Average Roadmap) is an advanced institutional-grade MT5 indicator that brings you the most powerful multi-timeframe VWAP (Volume Weighted Average Price) analysis—plus filtered trade signals using robust trend and momentum confirmations. Key Features: Multi-Timeframe VWAP Lines:
Plots Daily, Weekly, and Monthly VWAP levels for instant market structure insight. Dynamic Buy/Sell Signals: Big, bold colored arrows indicate confirmed buy or sell opp
FREE
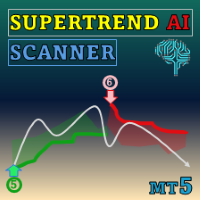
Special offer : ALL TOOLS , just $35 each! New tools will be $30 for the first week or the first 3 purchases ! Trading Tools Channel on MQL5 : Join my MQL5 channel to update the latest news from me 通过 SuperTrend AI Clustering MT5 with Scanner ,体验人工智能的强大力量。这款革命性的交易工具适用于 MetaTrader 5 (MT5),结合了 K-means 聚类和广受欢迎的 SuperTrend 指标,帮助交易者在趋势和信号中掌握主动。 See more MT4 version at: SuperTrend AI Clustering MT4 with Scanner See more products at: https://www.mql5.com/en/users/ndhsfy/seller
为何此工具独

TRUE TIMER - Candle Countdown
真实时间K线倒计时 在任何周期上显示距离当前K线收盘剩余的时间(MM:SS),实时精确到秒。内置智能提示,在新K线开始及最后20秒时进行提醒。 主要功能: 精确的服务器时间倒计时 自动识别背景颜色(浅色 / 深色) 智能提示:“新K线”提醒 & 关键时间提醒 支持所有周期:M1 → 月线 适合人群:短线交易者(Scalpers) & 精准入场时机把控 如果你需要 更偏向营销用语 或 更技术化的中文版本(用于指标说明 / MQL5 市场) ,我也可以帮你再优化一版。...........................................................................................................
FREE
This is a powerful, session-aware breakout indicator designed for serious traders who thrive on volatility and structure. Engineered for precision, it identifies high-probability breakout zones during the London and New York trading sessions—where the market moves with intent. Key Features: Session Range Detection
Automatically detects and highlights the key price range of London and New York sessions. Breakout Confirmation
Identifies breakout candles after the session range, with clear bullis
FREE

随机振荡器的多货币和多时间框架修改。 您可以在参数中指定任何所需的货币和时间范围。 该面板显示当前值和线的交点 - 信号线和主线(随机交叉)。 此外,该指标还可以在跨越超买和超卖水平时发送通知。 通过单击带有句点的单元格,将打开该符号和句点。 这是 MTF 扫描仪。 与货币强度计类似,仪表板可以自动选择包含指定货币的货币对,或以该货币为基础货币的货币对。该指标在“货币对集合”中指定的所有货币对中搜索货币;其他货币对将被忽略。并根据这些货币对计算该货币的总随机指标。您可以看到该货币的强弱程度。
默认情况下,从图表中隐藏仪表板的键是“D”.
参数 %K Period — K 线的周期。 %D Period — D 线的周期。 Slowing — 放慢; Method — 平均法; Price field — 价格类型。 Line of indicator — 线索引。 Clear the chart at startup — 启动时清除图表 Set of Pairs — 符号集: — Market Watch — 来自 MT 的“市场观察”的货币对。 — Specified ma

123模式 是最受欢迎,功能强大和灵活的图表模式之一。该模式由三个价格点组成:底部,峰值或谷值以及38.2%至71.8%之间的斐波纳契回撤位。当价格突破最后一个峰值或谷值时,该形态被认为是有效的,此时指标绘制箭头,发出警报并可以进行交易。 [ 安装指南 | 更新指南 | 故障排除 | 常见问题 | 所有产品 ]
清除交易信号 可自定义的颜色和尺寸 实施绩效统计 可定制的斐波那契回撤水平 显示适当的止损和获利水平
该指标可用于查找连续或反转形态 它是不可重涂和不可重涂的 它实现了电子邮件/声音/视觉警报 123模式 可以表现为连续或反转模式。为了简化操作,该指标使您可以选择要寻找哪种类型的形态,使其成为趋势或反转交易者的绝佳工具。
设置 将指标加载到任何图表时,将显示一组选项作为输入参数。如果您认为它们太多,请不要感到失望,因为参数被分组为不言自明的块。这就是每个参数块的作用。 幅度-幅度表示替代价格点之间的最小柱线量。要找到大图案,请增加幅度参数。要查找较小的模式,请减小幅度参数。 闵。回撤-形态中所需的最小斐波那契回撤。设置为零不对其进行评估。 最大。回撤-形态中可能的最大斐

该指标找到 三角旗 ,它们是通过围绕价格巩固期汇聚趋势线而确定的延续模式。使用突破期和形态突破发出信号。 [ 安装指南 | 更新指南 | 故障排除 | 常见问题 | 所有产品 ] 易于使用 可自定义的颜色和尺寸 它实现突破信号 它实现了各种警报
最佳用法 要查看可能会重叠的所有大小的三角旗,请将指标多次加载到图表上,以不同的大小,例如6、12、18和24。
输入参数 大小:要找到的图案的大小,用替代点之间的条形表示 突破期:突破信号的唐契安期
最大。历史柱线:图表中要检查的过去柱线的数量 看涨形态的颜色:此参数不言自明 空头形态的颜色:此参数不言自明 不间断图案的颜色:此参数不言自明 线宽:图案线的大小 看涨突破的颜色:这是买入箭头的颜色 看跌突破的颜色:这是卖出箭头的颜色 箭头大小:这是图表中显示的箭头的大小 自定义警报名称:此图表中引发的警报的自定义标题 显示警报:启用或禁用屏幕警报 电子邮件警报:启用或禁用邮件警报。 推送警报:启用或禁用推送警报。 声音警报:启用或禁用声音警报。 声音文件:出现屏幕警报时播放的声音文件。
作者 Arturo Lopez Perez,私人投

该指标通过分析连接价格和MACD直方图峰值或谷值的线的斜率来识别背离。 看涨背离(趋同): 当连接MACD谷值的线与连接相应价格谷值的线具有相反的斜率并趋同时发生。 看跌背离: 当连接MACD峰值的线与连接相应价格峰值的线具有相反的斜率并发散时发生。 当检测到背离信号时,指标会在对应信号的价格水平和时间上在图表中标注点。 额外功能: 该指标集成了 Darek Dargo的交易系统 中的信号,称为 TFR(The First Red) 。如果背离和TFR信号同时发生,指标会在图表中显示方向箭头,突显强化信号。 MACD直方图: 为了更清晰地显示,直方图采用不同颜色: 红色柱状 表示值高于前一根柱子。 绿色柱状 表示值低于前一根柱子。 当直方图在零线以下从红色变为绿色时,表明可能存在买入机会。相应地,当直方图在零线以上从绿色变为红色时,表明可能存在卖出机会。 背离和TFR信号作为过滤器,增强了这些信号的可靠性。 技术细节: MACD直方图计算为12周期和26周期指数移动平均线的差值。信号线未参与背离模式,以确保专注于直方图的动态。

This indicator is a professional tool designed to plot the Daily Open Line and instantly shade the bullish and bearish price zones around it. Instead of leaving traders guessing, it delivers a clear visual map of market sentiment from the very first of the day. Its goal: to help you instantly identify whether the market is trading above or below the daily open — a key reference point for intraday strategies.
The indicator automatically draws a horizontal line at the daily open price and shades
FREE

这是一个组合指标分析趋势、支撑阻力、买卖点。运用了均线MA、布林带、KDJ、CCI、RSI。
主图上下线是布林带上下线,采用的是20周期和2.3标准差可以用来支撑阻力。 中间的是分析趋势的均线,趋势分析是用均线多周期: 为涨趋势,反之为下跌趋势。在同一种颜色,基本说明趋势没有发生变化。 子图是由 KDJ、CCI、RSI三个指标组成,大于70超买,小于30超卖, 智能提示是运用了算法,主要计算布林带, KDJ、CCI、RSI指标
有三个或四个指标超出市场常态就会发出提示行情可能反转。 子图指标运用了很多数据,刚刚开始加载会有点慢,耐心等待就可以 这个指标是子图指标,还要再下我发布的MMB分析,这样就刚刚好组成一套分析
电脑分辨率的文本大小请设置100%,不然字体会不一样
FREE

SAR Colored Indicator with Alarm – Enhance Your Trading Strategy Are you tired of constantly monitoring charts for trend reversals? Introducing the SAR Colored Indicator with Alarm – a powerful, user-friendly tool designed to transform the classic Parabolic SAR (Stop and Reverse) into a dynamic, visually intuitive, and alert-driven system. Perfect for traders of all levels, this indicator is now available in the MQL Market and ready to elevate your trading experience. What is the SAR Colored I
FREE

AstroCycles: Advanced Financial Astronomy Indicator Overview AstroCycles is a sophisticated technical analysis tool developed for the MetaTrader 5 (MQL5) platform. It bridges the gap between orbital mechanics and financial market analysis by calculating precise astronomical cycles and visualizing them directly on your trading chart. Unlike standard indicators that rely on past price data, AstroMaster utilizes high-precision astronomical algorithms (Keplerian Elements and Brown’s Lunar Theory)
FREE

Enhance your price action strategy: inside bar breakouts at your fingertips
This indicator detects inside bars of several ranges, making it very easy for price action traders to spot and act on inside bar breakouts. [ Installation Guide | Update Guide | Troubleshooting | FAQ | All Products ] Easy to use and understand Customizable color selections The indicator implements visual/mail/push/sound alerts The indicator does not repaint or backpaint An inside bar is a bar or series of bars which is/a
FREE

A very simple indicator, but one that cannot be missed when carrying out your operations.
Fast and accurate Spreed information before entering a trade as well as the time to start another candlestick.
Spread refers to the difference between the buy (purchase) and sell (offer) price of a stock, bond or currency transaction.
Come and see our mql5 signals too. https://www.mql5.com/pt/signals/899841?source=Site +Signals+From+Author
FREE
特别优惠 : ALL TOOLS ,每个仅 $35 ! 新工具 在 第一周 或前 3 笔购买 期间为 $30 ! Trading Tools Channel on MQL5 :加入我的 MQL5 频道,获取我的最新消息 本工具将 Stochastic RSI 与 SuperTrend 逻辑相结合,根据动量变化生成方向性信号。它在 Stochastic RSI 上叠加 SuperTrend 风格的包络,并在动量越过超买/超卖阈值时突出转折点。 查看 MT5 版本: Stochastic SuperTrend MT5 Scanner 查看 MT4 版本: Stochastic SuperTrend MT4 Scanner 查看更多产品: All P roducts 概念 Stochastic RSI: 通过将随机计算应用于 RSI 曲线(而非价格)来衡量动量。 SuperTrend 带: 使用用户自定义的倍数,在平滑后的 Stochastic RSI 周围绘制动态上下带。 动量方向: 当平滑后的 Stochastic RSI 上穿/下穿计算出的带时,趋势发生
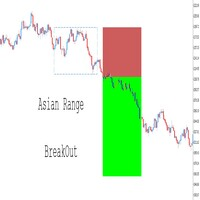
完全可定制 – 通过调整范围时间、颜色、线条样式和风险回报设置,使该指标适应您的个人交易风格。 交易水平可视化 – 根据突破条件自动绘制入场价格、止损 (SL) 和止盈 (TP) 水平。 与智能交易系统 (EAs) 无缝集成 – 通过添加额外的确认信号(如 RSI、均线、结构突破 (BOS) 等)来完全控制您的自动交易策略。您还可以 自定义缓冲区名称 ,以匹配您的 EA 需求,从而实现更大的策略灵活性。 多资产 & 多时间框架回测 – 在 外汇货币对、加密货币及其他交易工具 上测试不同配置,找到最适合您的交易策略的设置。 清晰简洁的界面 – 以非干扰性的显示方式关注价格走势,使交易信号更易于理解。 该指标为交易者提供了 突破策略的坚实基础 ,但其真正的优势在于灵活性。您可以 修改和增强 它,结合额外的指标或逻辑,以适应您的独特交易方法。 试用、回测,并优化它,以匹配您的个性化交易策略! 立即在 MQL5 上获取完整版,让您的交易更进一步!
FREE
https://www.mql5.com/en/users/gedeegi/seller
The "RSI+ with 123 Fractals" logo is designed to provide a clear and professional visual representation of a complex technical indicator, focused on precise market analysis and reliable patterns. Each element in the design is crafted to reflect the philosophy and strengths of the indicator within the trading world. Design Elements: "RSI+" Text in Bold and White:
The main "RSI+" text is chosen to be the focal point, with a bold and clear font. The us
FREE

INTRODUCING the Powerful Daily Bias Indicator
The Daily Bias Indicator
Stop Guessing. Start Trading with Confidence.
Tired of staring at your charts and not knowing if today is a buy day or a sell day? The Daily Bias Indicator does the heavy lifting for you.
It scans the market using 7 powerful tools (EMA trend, RSI, MACD, ADX, Volume, Pivot Points & Price Action). It tells you in plain language:
“TODAY: BUY ONLY”
“TODAY: SELL ONLY”
Or “NO CLEAR BIAS” (so you don’t waste money
FREE

This indicator was developed to support multiple timeframe analysis. In the indicator settings, the user can set the color, width, and style of the horizontal lines for each timeframe. This way, when the horizontal lines are inserted into the chart, they will be plotted with the timeframe settings.
MTF Lines also allows visibility control of another objets like rectangles, trend lines and texts.
This is a product developed by Renato Fiche Junior and available to all MetaTrader 4 and 5 users!
FREE

KEY FEATURES: One-Click Chart Switching (Fast Navigation) Simply click on any symbol name in the dashboard, and your chart instantly changes to that pair. Never miss a trade setup again due to slow navigation. Triple Signal Detection Monitors 3 powerful indicators simultaneously for every symbol: RSI Monitor: Detects Overbought/Oversold conditions instantly. Stochastic: Confirms momentum shifts. MA Trend: Identifies the main trend direction (Bullish/Bearish) using Moving Averages. writ Any Symb
FREE

介绍强大的NRTR(Nick Rypock Trailing Reverse)指标 - 这是一个必备的技术工具,用于帮助交易员识别趋势反转并设置有效的跟踪止损水平。由Nick Rypock开发,该指标采用独特的算法,可以适应不断变化的市场条件,成为任何交易者工具箱中不可或缺的一部分。
以下是交易员使用该指标的两种常见方式:
1. 趋势反转:NRTR指标在趋势即将反转时生成清晰的信号。留意指标线穿过价格图表,这是潜在趋势方向转变的信号。
2. 跟踪止损:NRTR还可作为可靠的跟踪止损工具,可在趋势市场中保护利润。当价格朝着预期方向移动时,NRTR线会动态地跟随价格,提供灵活的止损水平。
可自定义参数:通过调整指标的参数,将NRTR指标调整为适合您的交易偏好和时间框架。尝试不同的设置,找到最适合您独特交易风格的配置。为了提升交易策略,考虑将NRTR指标与其他技术指标结合使用。使用多个指标可以验证信号,并提高整体交易准确性。
总之,NRTR指标对于希望识别趋势反转并实施有效的跟踪止损的交易员来说是一个宝贵的资产。其适应性和用户友好的设计使其成为交易者中受欢迎的选择,有助于提高交易
FREE

Utazima 001 Indicator AI Professional Market Structure & Opening Range System STOP GUESSING. START TRADING WITH STRUCTURE. Utazima 001 Indicator AI is a next-generation Market Structure & Opening Range Intelligence System , built for traders who want clarity, precision, and consistency . This is not a repainting signal tool.
This is institutional-grade logic , simplified and automated for retail traders. Designed by Utazima MentorCreate , this indicator reveals the most important price zo
FREE

Market Cycle and Trading Sessions Indicator
Introducing our Market Cycle and Trading Sessions Indicator, a tool designed to provide you with a comprehensive view of the financial market like never before. Observe the market's pulse with our exclusive indicator. Gain a deep understanding of market phases, from accumulation to distribution, to make informed, strategic decisions with a high probability.
What makes our indicator?
1. Date Range for Calculations: Customize the start and end dates
FREE
解锁精准交易:ATR 动态枢轴系统 立即下载这款 免费 的 ATR Pivot Signals 指标,立即在市场噪音中占据优势。对于那些要求基于 真实市场摆动反转 而非猜测来确定高信心入场点的交易者来说,这是终极工具。 ATR Pivot Signals 系统是一款创新的技术指标,它利用 平均真实波动范围 (ATR) 动态过滤波动性,确保仅在价格出现统计学上显著的移动时才触发信号。它通过动态设置 反转阈值 来消除假突破,使其在所有市场条件下都有效——无论是平静的盘整还是爆炸性的趋势。 ATR 动态枢轴指标的关键特点: 动态、过滤噪音的反转: 使用可自定义的 ATR 因子 来调整反转阈值,使其适应当前市场波动性,忽略次要回调。 高信心信号: 直接在主图表上提供明确的 买入 (绿色)和 卖出 (红色)箭头,标记确认主要摆动枢轴的确切价格柱。 不重绘技术: 信号在K线收盘时确认并锁定。该指标采用防闪烁逻辑设计,确保对每个历史和实时信号的信任。 趋势识别: 清晰地跟踪市场状态(上涨/下跌趋势),为您提供简洁的视觉框架来确定方向偏差。 简单且高效: 易于安装,仅有两个关键输入参数可根据您的交易风
FREE

MACD Pro – MACD Indicator for MetaTrader 5 Description
MACD Pro is a Moving Average Convergence Divergence (MACD) indicator for MetaTrader 5. It follows the standard MACD calculation method and displays trend direction and momentum in a separate indicator window. Indicator Elements MACD line based on the difference between fast and slow exponential moving averages Signal line calculated as an exponential moving average of the MACD line Histogram showing the difference between the MACD and signa
FREE

Shadow System Candles - AI Trend Visualization
Concept "Stop trading in the dark. Equip your chart with Night Vision."
Shadow System Candles is the visual core of the "Shadow Operation" project. It eliminates market noise and visualizes the true direction of the trend using AI-based logic (ADX + MA integration).
Note: This tool does not generate buy/sell arrows. It is designed to train your eyes to recognize "Active Trends" and "Dangerous Ranges.
Key Features ・AI Logic Coloring[/b]: Automat
FREE
Other profitable programs https://www.mql5.com/en/users/ifyjava/seller FNCD指标是一个先进的技术分析工具,将费雪变换与统计价格标准化相结合,创建复杂的振荡器。基础从Z分数标准化开始,其中价格数据通过计算当前价格在指定周期内偏离其移动平均值多少个标准差来标准化。这种标准化过程将原始价格波动转换为标准化单位,使得更容易识别极端偏差,无论工具的价格水平如何。费雪变换然后将这些标准化值转换为围绕零振荡的有界振荡器,极端读数表明潜在的反转区域。两个指数移动平均线应用于费雪变换值——快速EMA和慢速EMA——创建类似于MACD但具有增强统计属性的双线系统。当快速EMA从下方穿越慢速EMA时,产生看涨信号,而当快线从上方穿越慢线时,出现看跌信号。统计标准化和费雪变换的结合使这个指标在识别超买和超卖条件方面特别有效,同时通过EMA平滑机制过滤市场噪音。
FREE

它预测最有可能的短线价格走势,基于先进的数学计算。
功能 评估即时价格走势; 计算实时市场趋势; 计算最重要的支撑和阻力位; 算法优化,在进行复杂数学计算时系统资源消耗最小。 最佳性能自调整, 所以它可以工作于任何品种 (无论它有多奇葩) 以及任意时间帧; 与所有 MetaTrader 平台兼容, 不管报价位数或其它参数; 与所有其它工具兼容 (指标, EA 或脚本),不会减缓终端性能和交易操作。 注: 为了获取多个时间帧的数值, 密集区域和附加的功能,您必须适用 专业版 或 大师版 。
介绍 构建一般交易策略的许多经典指标都基于简单的数学,不是因为创建这些指标时,没有优秀的数学家 (事实上,那时的数学家有可能比现在更好),但因为电脑还不存在,或是它们太简单,持续处理复杂数学操作的能力低下。如今,任何智能手机都完胜几十年前最强大的计算机。所以,处理海量信息的能力如今不再是限制,除了极其复杂的模拟处理。 高级价格走势预测者 (APMP) 指标利用当前处理能力的优势,通过一些最先进的数学、统计和概率的概念,来捕获价格波动的本质。 APMP 不能用来预测它自己,由于价格运动是一种非平稳随
FREE

Check out my TRADE PLANNER MT5 – strongly recommended to anticipate account scenarios before risking any money. This is the Bill Williams Awesome Oscillator indicator calculated from Heikin Ashi candles. Here you find multi-colored histogram which is helpful when identify weakness or strength of trend in the market. To use it, just simply drop it on the chart and you don't need to change parameters except one: switch between Heikin Ashi or normal candles (see attached picture).
FREE

(谷歌翻译) 标准 Heikin Ashi 蜡烛图的开放值相当于 指数 总价 的移动平均线(EMA) , EMA 的 alpha 值是固定的 0.5(相当于 EMA 周期 3.0)。 在这个动态版本中,周期可以更改为您希望使用的任何值,这也允许您 近似多时间框架分析,或使用低值或高值作为一种追踪止损。 的穿越 Heikin Ashi 开盘价的实际 收盘价 也可以用作价格变化的信号 趋势方向。
此外,除了标准 EMA 之外,此版本还可以选择使用 几乎零滞后的 EMA 相反,它可以更快地检测趋势方向的变化,尤其是在使用较长时间的 平均。
将指标附加到图表时,您还可以选择自动将图表切换到 折线图模式 并可选择在 折线图 中隐藏真实的 收盘价 ,但是, 没有它,您将无法看到实际 收盘价 和实际价格之间的交叉信号 Heikin Ashi 开放价值观。 (谷歌翻譯) 標準 Heikin Ashi 蠟燭圖的開放值相當於 指數 總價 的移動平均線(EMA) , EMA 的 alpha 值是固定的 0.5(相當於 EMA 週期 3.0)。 在這個動態版本中,週期可以更改為您希望使用的任何值,這也允許您
FREE

提升您的分析水平,使用 Weis Wave Box ! 如果您追求 交易的精准与清晰 , Weis Wave Box 是您的理想工具。此 高级成交量波动指标 清晰展现市场中努力与结果的动态,对于使用流量和成交量阅读的交易者至关重要。 主要功能: 可自定义的成交量波 — 按ticks调整以匹配您的策略。
可调节的历史数据 — 更精准地分析特定时间段。
真实成交量与Ticks — 了解市场的真实影响。
能量可视盒 — 看到市场在哪些地方付出了更多努力但价格位移较少。
️ 5种摆动形式 — 根据totalVol、length、width、barDVol和lengthDVol自定义。 实际优势: 成交量逻辑的视觉清晰度 识别买方或卖方力量的主导地位 潜在反转或持续趋势的视觉信号 相关指标
Big Player Range — 识别机构活动区,预测回调概率。
Imbalance DOM Pro — 通过DOM阅读不平衡,预测价格压力。
Times and Sales Pro — 实时读取主动买卖订单,识别市场隐藏意图。
SwingVol

Mahdad Candle Timer 是一款轻量级且精确的 MetaTrader 5 指标,它会在最新一根K线旁边显示当前K线的剩余时间。该工具专为依赖精准时机的交易者设计——无论是剥头皮、日内交易,还是等待K线确认的波段交易。 主要功能 精准倒计时 – 以 HH:MM:SS 显示剩余时间(可选毫秒) 动态定位 – 始终与最新K线对齐,不受图表缩放或比例影响 智能颜色适配 – 文本颜色会根据背景和K线方向(看涨/看跌)自动调整 自定义提醒 – 在K线收盘前X秒发出声音或弹窗提醒 完全可定制 – 字体、大小、颜色、刷新速度和提醒参数均可调整 轻量高效 – 占用极低CPU资源,不影响其他指标或EA运行 ️ 输入参数 ShowMilliseconds (true/false) Update Interval (ms) Bullish/Bearish Colors (Light/Dark) Font & Size Enable Alarm (true/false) Alert Seconds Before Close Alert Sound File 使用场景 剥头皮交易者
FREE

True TrendLines MT5 - Smart Trend Detection & Alerts Overview True TrendLines MT5 is a professional-grade technical analysis tool that automatically identifies and plots high-probability trend lines on your MetaTrader 5 charts. Using a sophisticated swing point detection algorithm, it helps traders visualize key market structure and potential reversal points with precision. Key Features Automatic Trend Line Detection Identifies valid swing highs and lows based on your chosen strength paramet
FREE

En esta versión, las alertas están funcionando y en la versión que publicó, la zona muerta de atr era solo una zona muerta sin atr, por lo que también la convirtió en una zona muerta de atr.
Indicator input parameters input int Fast_MA = 20; // Period of the fast MACD moving average input int Slow_MA = 40; // Period of the slow MACD moving average input int BBPeriod=20; // Bollinger period input double BBDeviation=2.0; // Number of Bollinger deviations input int Sensetive=
FREE

CandleForce Pro: The Ultimate Decision-Support Dashboard for Modern Traders Introduction: Overcoming the Chaos of Modern Markets
In today's hyper-connected financial markets, the modern trader faces a paradox of choice. We are inundated with an endless stream of data, indicators, news, and strategies, all promising to unlock the secrets of profitable trading. This constant influx often leads to "analysis paralysis"—a state of cognitive overload where conflicting signals create confusion, hesit
FREE
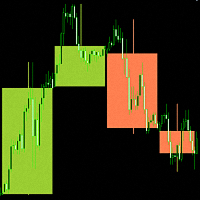
"Candlesticks MTF 5" is an information indicator that displays "Japanese Candlesticks" . The indicator analyzes and determines the opening and closing times of candles from higher time frames.
An algorithm has been developed for the "Candlesticks MTF 5" indicator that corrects the discrepancy between the opening and closing times of candles from higher time frames. For example, if the opening time of a candle on a weekly time frame is the 1st of the month, and on the smaller time frame this da
FREE

精准可视化市场动能 MultiMA_ICHIMOKU_STO_Color 是一款全面的技术分析工具,旨在通过将三个强大的指标结合到一个智能系统中,提供清晰的市场信号。 该指标集成了三条可自定义的移动平均线、一目均衡表(Ichimoku Cloud)的关键组件以及随机震荡指标(Stochastic)。其独特之处在于智能 K 线着色系统,能够即时揭示市场状况: 看涨 (蓝色): 价格位于所有三条均线之上 且 随机指标高于 50,表明强劲的上涨动能。 看跌 (红色): 价格位于所有三条均线之下 且 随机指标高于 50,预示强劲的下跌动能。 中性 (灰色): 混合状况或动能微弱(随机指标低于 50)。 优势: 消除图表杂乱,无需在多个指标之间频繁切换。 一眼识别高概率交易机会。 节省宝贵的分析时间,更快做出更明智的决策。 完全可调的参数允许您根据特定的交易策略和风格定制该指标。利用这个集趋势和动能确认为一体的解决方案,彻底改变您的技术分析。
FREE

Bollinger Bands Stop Indicator holds significant importance for traders navigating the complex world of financial markets. Its relevance lies in several key aspects. Firstly, it aids in trend identification. By analyzing price movements relative to the Bollinger Bands, traders can discern whether the market is in an uptrend, downtrend, or ranging phase. Secondly, the indicator provides valuable insights into market volatility. Wider bands indicate higher volatility, while narrower bands suggest
FREE

Key Price Levels Indicator Indicator that shows the highs and lows for the significant price levels for past periods that could be potentially considered as reaction levels. The indicator displays the following price levels: Yesterday high and low The day before yesterday high and low Two days back high and low Last week high and low Last month high and low Last three month high and low (Quarter) Last year high and low
FREE
The Round Level Indicator automatically draws psychologically significant price levels directly on your chart.
These round numbers often act as key support and resistance zones across all markets and timeframes.
Round Levels are used in my automated EA: Opal This indicator works best when combined with other tools and strategies, e.g.: Price Action Strategies
Round levels often align with key support/resistance. Use it with candlestick patterns (like pin bars or engulfing bars) to confirm high
FREE

This trading strategy is built around Open-Close Crossovers , a method of analyzing price movement based on the relationship between a bar's open and close prices. The system is designed to identify potential entry and exit points when these values cross over each other. Setup and Customization The strategy's performance can be customized by adjusting the resolution. A higher resolution, typically 3-4 times that of the chart , may be used to identify crossover signals earlier. However, this can
FREE

This indicators automatically draws the support and resistances levels (key levels) for you once you've dropped it on a chart. It reduces the hustle of drawing and redrawing these levels every time you analyse prices on a chart. With it, all you have to do is drop it on a chart, adjust the settings to your liking and let the indicator do the rest.
But wait, it gets better; the indicator is absolutely free! For more information: https://youtu.be/rTxbPOBu3nY For more free stuff visit: https:
FREE
AI Volatility Map The AI Volatility Map is a professional indicator designed to analyze market activity by measuring spread and tick velocity. It provides traders with a clear view of market energy levels, helping to identify periods of high volatility, low activity, or sudden changes in momentum. This indicator is especially useful for spotting potential breakouts, trend continuations, or dead market conditions. Key Features: Volatility Score (Blue Line): Represents the normalized market volat
FREE

SWIFT SNIPER COMBO — Advanced Trading Signal Indicator (Non-Repainting) Short Pitch: A precision entry system that fuses a fast/slow MA crossover with robust swing-pivot confirmation to deliver high-probability signals, clear TP/SL levels, and realtime alerts — built for traders who want clean, non-repainting signals and practical risk management. What It Does (Quick Overview) SWIFT SNIPER COMBO combines a smoothed moving-average crossover engine with a swing-pivot detector. Signals are only gen
FREE

Indicator Overview Latest Updates: Update 02-23-2025: This version includes further optimizations for improved signal accuracy. Update 01-13-2025: Now compatible with the upcoming Web Request App, which will replace the AutoSignal_Connection bot. Purpose
This MT5 indicator is designed for analyzing 3-minute Heiken Ashi candles, generating buy and sell signals based on moving average (MA) crossovers. It provides visual signals and alerts, making it a valuable tool for traders. Heiken Ashi Candl

O Touch VWAP é um indicador que permite calcular uma Média Ponderada por Volume (VWAP) apenas apertando a tecla 'w' no seu teclado e após clicando no candle do qual deseja realizar o calculo, clicando abaixo do candle é calculada a VWAP baseado na minima dos preços com o volume, clicando sobre o corpo do candle é calculado uma VWAP sobre o preço medio com o volume e clicando acima do candle é calculado uma VWAP baseado na máxima dos preços com o volume, voce tambem tem a opção de remover a VWAP
FREE

Time Candle with Sound Alert
This indicator will be display the time left candle Features : 1. Multi Time Frames, Multi Pairs 2. Time Left 2. Position dynamic with Bid Price or Edge of Chart Screen 3. Font Size and Color 4. Display Current Spread, Maximum Spread and Minimum Spread
Note: Maximum and Minimum Spread will be reset when you change TF Tested On MT5 Version 5 Build 5200
If you want the source code, just PM me
FREE

If you love this indicator, please leave a positive rating and comment, it will be a source of motivation to help me create more products <3 How to use Slope Direction Line Uptrend: When the SDL line slopes up and turns from red to green, it shows that the price is trending up. This is also considered a buy signal. Downtrend: When the SDL line slopes down and turns from green to red, it shows that the price is trending down. This is also considered a sell signal. Sideways: When the SDL line mo
FREE

If you love this indicator, please leave a positive rating and comment, it will be a source of motivation to help me create more products <3 What is Schaff Trend Cycle indicator? The Schaff Trend Cycle (STC) is a technical analysis indicator used in trading and investing to identify trends and generate trading signals. The STC is designed to identify trends and trend reversals by measuring the strength of the trend and the speed of price changes. The STC indicator helps to identify trends in a
FREE

Want to AUTOMATE this strategy? We have released the fully automated Expert Advisor based on this logic. Check out Range Vector Fibo Logic EA here: https://www.mql5.com/en/market/product/158065
UPGRADE AVAILABLE: Tired of manual trading? I just released the Automated MTF Version with Mobile Alerts and Auto-Targets. Get the Pro Version here: https://www.mql5.com/en/market/product/159350
Range Vector Fibo Logic (Indicator) One Candle Strategy
Stop waking up at 3 AM to draw lines manually. Ran
FREE

This is advanced Multi-Symbol and Multi-Timeframe version of the "Candle Pattern Finder" indicator (search for candlestick patterns based on the book by Gregory L. Morris "Candlesticks charting explained. Timeless techniques for trading stocks and futures" ). The indicator searches for candlestick patterns for ALL symbols of the "Market Watch" window and for ALL standard timeframes from M1 to MN1. When patterns appear on any symbol / timeframe, the indicator gives a signal (text, sound, sending

For feedback, free connect to signal, PARTNER PROGRAM and detailed information : Facebook Welcome to the "Breakeven Line" indicator, version 1.1, developed by Sergei Ivanov in 2025. Visualize breakeven price levels for your trades with precision and ease. Advisor Description The "Breakeven Line" is a MetaTrader (MQL5) indicator that displays breakeven price levels for open buy and sell positions on the current symbol, factoring in commissions and swaps for accurate risk management. Key
FREE

This is the Stargogs Volatility Arrow V1 Yeahhh!!! This Arrow is based on trend, support and demand and based on EMA's. You can change the parameters or settings like you want to. Message Me for the System which works best with this Indicator for free (include: Template, and other indicators). This indicator works with all Currency Pairs, All Volatility indices, All Indices, Boom & Crash Indices, Gold and NASDAQ. Works on All Timeframes Add the following to your chart with Stargogs Volatility A
FREE

INDICATOR: Trend Line GEN INDICATOR: Trend Line GEN Developer: gedeegi General Description Trend Line GEN adalah indikator yang secara otomatis menggambar trendline berdasarkan titik-titik swing penting (highs dan lows) pada chart. Garis-garis ini berfungsi sebagai support dan resistance dinamis untuk membantu pengambilan keputusan trading. Key Features Automatic Swing Detection: Mengidentifikasi pivot high dan pivot low secara otomatis. Flexible Slope Calculation: Pilihan metode perhitungan ke
FREE

Clock GMT Live 拥有您需要了解的有关我们经纪人的所有信息,很多时候您会想知道我现在的格林威治标准时间或我的经纪人正在处理什么格林威治标准时间,使用此工具您将能够实时了解格林威治标准时间和格林威治标准时间 经纪人和你当地时间的时间偏移,你也会不断地知道经纪人的 ping 只需将它放在一天中的某个时间,您就可以获得信息
每次收购价格都会上涨,我们将以此来保护,这样很少有人可以拥有我独特的策略 我的其他开发可以在这里查看
准确的时机可能是交易中的一个关键因素。 目前,伦敦或纽约证券交易所是否已经开市或仍处于关闭状态? 外汇交易的营业时间何时开始和结束? 对于手动交易和实时交易的交易者来说,这不是什么大问题。 使用各种互联网工具、金融工具的规格和时间本身,您可以快速了解何时是根据自己的策略进行交易的正确时间。 对于一些只关注价格走势并在价格走势向他们发出信号时进行买卖的交易者而言,时间本身并不重要。 对于在纽约(股票)市场收盘后和欧盟(股票)市场开盘前进行“夜间剥头皮”交易的交易者,或者专门在“伦敦休市”或其他时间进行交易的交易者而言,情况有所不同 最忙的时候,还是所有买卖
FREE

脉冲系统在“进入我的交易室”一书中首次描述。 它使用 MACD 直方图和价格指数移动平均线 (EMA) 的方向来定义冲量。 规则是永远不要与冲动交易。
它的颜色代码为您提供了几个信号: 当 EMA 和 MACD 直方图都在上升时,脉冲系统将条形颜色标记为绿色(不允许做空)。 当 EMA 和 MACD 直方图都在下降时,Impulse 系统会将条形颜色标记为红色(不允许购买)。 当 EMA 和 MACD 直方图指向不同的方向时,Impulse 系统会将条形颜色标记为青色(您可以做多或做空)。
参数: MACD_Short_Length (12) – MACD 计算的空头 EMA; MACD_Long_Length (26) – 用于 MACD 计算的多头 EMA; MACD_Smoothing_Length (9) – 信号线的平滑值; Short_EMA_Length (13) – 短期价格 EMA。

Volume Weighted Average Price (VWAP) is a trading benchmark commonly used by Big Players that gives the average price a Symbol has traded throughout the day. It is based on both Volume and price. Additionally we put in this indicator the MVWAP (Moving Volume Weighted Average Price). For those who do not know the usage and the importance od this indicator I recommend a great article about this subject at Investopedia ( https://www.investopedia.com/articles/trading/11/trading-with-vwap-mvwap.asp
FREE

Tillson's T3 moving average was introduced to the world of technical analysis in the article ''A Better Moving Average'', published in the American magazine Technical Analysis of Stock Commodities. Developed by Tim Tillson, analysts and traders of futures markets soon became fascinated with this technique that smoothes the price series while decreasing the lag (lag) typical of trend-following systems.
FREE

Developed by Charles Le Beau and featured in Alexander Elder's books, the Chandelier Exit sets a trailing stop-loss based on the Average True Range (ATR). The indicator is designed to keep traders in a trend and prevent an early exit as long as the trend extends. Typically, the Chandelier Exit will be above prices during a downtrend and below prices during an uptrend.
Calculation
The original Chandelier Exit formula consists of three parts: a period high or period low, the Average True Rang
FREE

對稱三角形圖表模式代表價格被迫向上突破或崩盤之前的一段收縮和盤整期。向下趨勢線的突破標誌著新的看跌趨勢的開始,而從上部趨勢線的突破則表明新的看漲趨勢的開始。
此處提供 MT4 版本: https://www.mql5.com/en/market/product/68709/
該指標識別這些模式並在 4 個關鍵點形成且價格再次回落至三角形時提醒您,以便您為潛在的突破做好準備。對稱三角形並不總是完全對稱的,價格可以向上或向下突破,但通常最成功的突破是在形成三角形第一個點的高點或低點的方向上。因此,該指標為我們提供了對突破的看漲或看跌偏見,並採用顏色編碼並針對該特定方向發出警報。沒有必要只在一個方向進行交易,但是因為任何一個方向的突破都是可能的,但是當突破與第一個點趨勢一致時,您往往會獲得更大更快的價格變動和更好的風險回報。
輸入和配置選項:
開始搜索蠟燭 - 指標將開始尋找多少根蠟燭來尋找已完成的形態 Fib Max Retracement - 最大回撤價格可以形成點 3,4 和 5 Fib 最小回撤 - 可以形成點 3,4 和 5 的最低迴撤價格 僅顯示最後信號 - 僅顯示最後

ATR Based Swing Trader Indicator Description The ATR Based Swing Trader Indicator is a sophisticated technical analysis tool designed for MetaTrader 5 (MT5) to assist swing traders in identifying potential buy and sell signals based on the Average True Range (ATR) and trend direction. Developed by Rahulkumar Kanani, this indicator leverages volatility and price movement to generate actionable trading signals, making it suitable for traders who aim to capture short- to medium-term price swings in
FREE

The TMA Centered Bands Indicator for MT5 draws bands on the chart and shows the overall price trend. It displays three bands - the lower and upper boundaries of the channel and the median. The bands are made up of moving averages, and each of them has an MA period. The name TMA comes from triangular moving averages, as the indicator draws triangular bands. The price will fluctuate between these ranges whenever the trend changes direction, thus creating entry and exit points. How to trade
FREE
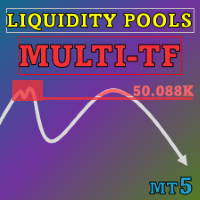
Special offer : ALL TOOLS , just $35 each! New tools will be $30 for the first week or the first 3 purchases ! Trading Tools Channel on MQL5 : Join my MQL5 channel to update the latest news from me Liquidity Pools 指标是一款高级工具,通过分析高低点区域的多次触及情况、重新测试次数以及每个区域的交易量来识别并标记潜在的流动性区域。该工具帮助交易者全面了解市场动态,预测潜在的转折点,并识别重要的支撑和阻力水平。 查看MT4版本: Liquidity Pools MT4 查看更多产品: 所有产品 主要功能和优势 1. 精确的流动性区域识别 突出显示高影响区域: Liquidity Pools指标识别小型交易者可能会放置止损限价单的区域,从而形成吸引流动性的区域。大型机构通常利用这些区域来执行他们的更大订单,可能会影响市场走势。通过监控这些区域,交易
MetaTrader市场是您可以下载免费模拟自动交易,用历史数据进行测试和优化的唯一商店。
阅读应用程序的概述和其他客户的评论,直接下载程序到您的程序端并且在购买之前测试一个自动交易。只有在MetaTrader市场可以完全免费测试应用程序。
您错过了交易机会:
- 免费交易应用程序
- 8,000+信号可供复制
- 探索金融市场的经济新闻
注册
登录