Watch the Market tutorial videos on YouTube
How to buy а trading robot or an indicator
Run your EA on
virtual hosting
virtual hosting
Test аn indicator/trading robot before buying
Want to earn in the Market?
How to present a product for a sell-through
Expert Advisors and Indicators for MetaTrader 4 - 33

This Expert Advisor is a pure scalping system. The expert place and manage pending orders. Runs perfect on pairs with tight spread and low commission broker (commission plus spread equal or less than 1.0 pip). Choose a broker with zero stop level and fast execution to use expert.
Pairs and Time Frame Pair: eurusd Time frame: M1 Default settings are good for eurusd.
Information Please test expert on demo account first, before uses it on real account. Have on your mind, all scalpers are sensiti
FREE
This indicator is a professional Trend identifier, it measures the angle or slope of moving averages with different methods. As this indicator calculate angles you can identify the strength of trend by magnitude of angle. It also shows if angle is increasing or decreasing which gives you the opportunity to make more information about current trend. You can combine this indicator with your strategy as a filter or you can use it alone to make your trading system. This is not a repainting indicator
FREE

The Complex Chaos EA is an automated system that uses a pair of exponential moving averages to detect the market direction and opens trades on candle open. If the market moves against a trade it will at a set distance open another trade in the same direction to move the take profit of the group of open positions closer to the current price and make the group of trades winners overall once the price reverses. If a change in direction is detected then all trades are closed and it starts trading in
FREE

The StrikePin indicator is a technical, analytical tool designed to identify trend reversals and find optimal market entries. The StrikePin indicator is based on the pin bar pattern, which is the Price Action reversal pattern.
An entry signal, in a trending market, can offer a very high-probability entry and a good risk to reward scenario.
Be careful: the indicator is repainting since it is looking for highest high and lowest lows. You should avoid to use it in experts but you can use it in
FREE

Paracel EA is an advanced and fully automated Expert Advisor designed to help traders navigate the complexities of the financial markets. Using a sophisticated strategy based on the Supertrend indicator and another built-in indicator, Paracel EA can analyze market conditions and identify trading opportunities with remarkable precision. The EA is equipped with a range of powerful features, including martingale functions, to help maximize profits and minimize risks. Whether you're a seasoned trad
FREE

Golden Trend Pulse — trend indicator developed specifically for Gold, also applicable to the Cryptocurrency and Stock markets. The indicator is designed for precise determination of market trends using advanced analytical methods. The tool combines multifactor analysis of price dynamics and adaptive filtering of market noise, ensuring high accuracy in identifying key entry and exit points. Thanks to its intelligent system, the indicator effectively handles market variability, minimizing false s

The utility places a grid of pending orders. You can select the number of orders in the grid, the step between orders, multiplier for the order size, SL and TP levels and the magic number. If you use a profit bucket , please note that it applies to all orders on the current currency pair with the current magic. If you want to use several grids with independent profit buckets at the same time, run several copies of the utility and specify different magics in the settings.
MT5 version of the ut
FREE

Equity Curve Overlay – MT4 Equity Curve Overlay is an indicator for MetaTrader 4 that displays the equity curve directly on the main price chart, enabling visual comparison between account performance and market price movement. Key Features: Draws the equity curve on the main chart Enables visual comparison between equity and price action Adjustable scale and vertical offset for precise alignment Option to display the previous day's high and low levels Input Parameters: EquityScaleFactor : Scal
FREE

Overview Market Structure Analysis Indicator MT4 Structure Analysis Indicator automatically identifies Market Structure based on Smart Money Concepts (SMC). It clearly displays Break of Structure (BoS), Change of Character (CHoCH), Higher Highs, Higher Lows, Lower Highs, and Lower Lows in real-time. Key Features Automatic Market Structure Detection Break of Structure (BoS) - Price breaks previous structure in trend direction Change of Character (CHoCH) - Trend reversal sig

Gold BB FREE is Expert Advisor for XAUUSD based on Bollinger Bands . You can edit all strategy parameters as BB open period, TakeProfit, StopLoss or TrailingStop. Default paramters are optimized for best results. But you can test other settings for antoher currency pairs. This EA use three BB with different open periods and close price. Gold BB FREE has been tested from year 2006 to 2021 . My test used the real tick data with 99,90% accuracy. Doesn't use Martingale or other dangerous strategie
FREE

The indicator searches for and displays Doji candlesticks on the chart and signals the appearance of such a candle. The direction of the signal depends on the direction of the previous candles, as the Doji signals a reversal or correction. In addition to the possibility of signaling, the power of the reversal is graphically shown (the more green, the more likely growth, the more red, the price will fall). In the indicator settings, you can change the parameters of the Doji candlestick, the closu
FREE

ADX Channel is an indicator that plots the channel depending on the values of the ADX (Average Directional Movement Index) indicator. The resulting channel is a little similar to the Envelopes, but its lines depend on the market volatility. The sell trade is usually executed fast when the price touches and bounces from the upper line of the channel, buy - from the lower. It is recommended to trade when there is no significant news. The recommended timeframes: M5 - H1. The indicator is not design
FREE
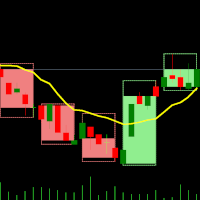
Dual Time Frame Indicator – Candles in Candles for MT4 Overview The Candles-in-Candles Indicator is a multi-time frame visualization tool designed specifically for MT4. It overlays higher time frame candles onto your lower time frame chart, allowing you to see how smaller candles behave within larger ones. This approach enhances market structure analysis, sharpens trend identification, and clarifies price action—without the need to switch between charts. How It Works Select Your Lower Time Fram
FREE
Avantgarde: Grid This Expert advisor uses simple and robust grid method to place trades. simple and easy to use. https://www.mql5.com/en/signals/534678 How It Works: The EA does not use indicators but uses a math based solution to price-action. The EA will perform the same trades in any timeframe. Avantgarde Grid is equipped with money management, Autolot and DD close trade. Take care when setting the <step> as it will alter the aggressiveness. The Greater the step the less risk. Parameters Buy
FREE

What does this do? It shows you on the chart which stop belongs to which entry. Have you ever had multiple positions or trades open on a single pair and were confused which stop loss goes with what entry? Even worse, the stop loss orders for buy and sells are the same color on the chart. Well, your problem has been solved! This indicator will show you which stop belongs to which entry. It will place a vertical line and an arrow on the chart for each open trade. A yellow line connects the entry
FREE

StrategyTreature is designed for experienced traders who do not understand how to write EA . It can be set as any EA we currently know, and trading strategies can be freely written by traders. This writing method is very simple and easy to master. After writing a few more times, we can all write a strategy in just a few minutes. The core function of StrategyTreature is: 1 single/two-way transaction 2 Single currency/Multi currency Trend Trading 3 Real time/pending transactions 5 custom transa
FREE

I recommend you to read the product's blog (manual) from start to end so that it is clear from the beginning what the indicactor offers. This indicator for Metatrader 4 identifies when a divergence occurs between price and an oscillator/indicator. It identifies both bullish and bearish divergences. It has a RSI filter option which makes it possible to filter out only the strongest setups. The indicator also offers options to wait for an Engulfing formation, Donchian channel breakout or for p
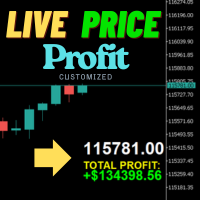
LIVE PRICE AND TOTAL PROFIT DISPLAY INDICATOR The ultimate real-time trading companion for professional traders, day traders, and live streamers Transform your trading experience with this powerful indicator that displays live bid prices and comprehensive profit tracking directly on your chart. Designed specifically for high-frequency trading environments and live trading broadcasts. CORE FEATURES REAL-TIME PRICE DISPLAY Live bid price updates every second with professional formatting Special f
FREE
Moving Average Multicurrency Scanner Dashboard MT4 is a powerful trading tool designed to monitor multiple currency pairs and timeframes using customizable moving averages. It organizes signals in a grid format, displaying each symbol’s status across timeframes from M1 to MN1. Traders can enable or disable specific timeframes to align with their strategies. You can find the MT5 version here: Moving Average Multicurrency Scanner MT5 For detailed documentation click here: Documentation Key Featur

Trend Power Bot is a unique combination between highly efficient breakout detecting algorithm and very effective drawdown compensation money management. The money management could be considered a martingale, but used with low risk, the strategy survives 20+ years trading with acceptable drawdown. The default /safe/ risk is 0.2% (0.02 lots per $10k account equity) and this is extremely safe. However, if you decide to try your luck, you can bump the risk up to 1% (0.1 lot per $10k account equity)
FREE

The exp_iCustomNew Expert Advisor allows to trade using any custom and standard indicators, using their various values: arrows, the intersection of two lines, level crossing, extremum, color. To define the entry signal, the EA can use one main indicator and up to four indicators to confirm by trend and up to four indicators to confirm by volatility. Confirmation indicators can be calculated on any other symbol and timeframe. Additionally, the entry signals are filtered by time (up to three sessi

CubeMaster Lite - Your Ultimate Trading EA for Unleashing Profits!!! Our powerful EA that combines indicator signals and advanced money management functions. With this EA, you can implement various strategies such as grid , martingale , and arbitrage . Whether you're an experienced trader or a beginner , this versatile EA is suitable for you . It includes protection against high spreads and allows you to trade with a fixed or automatic lot size. Supercharge Your Trading : CubeMaster Lite maximi

The indicator is designed for displaying the following price levels on the chart: Previous day's high and low. Previous week's high and low. Previous month's high and low. Each of the level types is customizable. In the indicator settings, you set line style, line color, enable or disable separate levels. The version of the exact same indicator but only with sound alerts there - Time Levels with Alerts .
Configurations ----Day------------------------------------------------- DayLevels - enable/
FREE

Logo MT4 Version : https://www.mql5.com/en/market/product/121289 MT5 Version : https://www.mql5.com/en/market/product/121290
Watermark MT4 Version : https://www.mql5.com/en/market/product/120783 MT5 Version : https://www.mql5.com/en/market/product/120784
The "Logo" script is designed to display a custom logo or image as a background on a trading chart in MetaTrader 4 (MT4). This script allows traders to personalize their charts with logos or any other desired images.
How It Works:
Image P
FREE

Trade Advisor : Mastering The Chart The Ultimate Expert Advisor (EA) Assistant for Professional Traders VERSION MT4 Version | MT5 Version | Blogs
v.3.0 - Telegram Bot Integration Note: MT4 version is lighter than MT5 version Trade Advisor : Mastering The Chart
Trade Advisor is an advanced trading assistant designed to enhance trading strategies by integrating key market analysis tools and seamless functionality for traders. Here’s an overview of what makes Trade Advisor a powerful asse

Binary Scalper 6 – A Powerful Binary Options Indicator for MT4 Binary Scalper 6 is an advanced trend analysis and binary options trading tool for MetaTrader 4 (MT4) . Designed for traders of all experience levels, this indicator offers precise signals and detailed statistics to maximize trading efficiency. Key Features: Trend Detection
Accurately identifies trending markets, providing traders with a clear direction for binary options trading. Support for Any Currency Pair
The indicator works
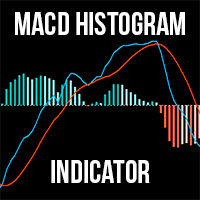
For MT5 The MACD Histogram Indicator is an enhanced version of the traditional MACD indicator, offering superior insights into market trends and momentum shifts. Unlike the default MACD in MT4, this version features a histogram , making it easier for traders to visualize and interpret market conditions. Advantages over the default MACD indicator: Enhanced Visuals: The histogram provides a bar chart representation of the difference between the MACD line and the signal line, making it simpler to i

Heikin-Ashi-Sniper is a perfect addition to your portfolio. It is meant to be traded on EURUSD on H1 Timeframe.
It uses Heikin-Ashi High and Low/High of Monthly timeframe to determine optimal entry signals while having a reasonably low drawdown More EA´s will be published shortly to complete the Portfolio. The EA Trades not very frequently it waits for the right chance and places the order. The rest of the time, your capital is free to be traded on
other strategies Please see backtest results i
FREE

This is an unconventional version of the Heiken Ashi Smoothed indicator implemented as lines rather than a histogram. Unlike a usual histogram, the indicator draws the readings of the two moving averages in the form of colored lines.
Example If the candle crosses two indicator lines upwards, a trend is assumed to be changing from bearish to bullish. If the candle crosses two indicator lines downwards, a trend is assumed to be changing from bullish to bearish. The indicator is good at displaying
FREE

Discover Azumi: Your Powerful and Simple Solution for XAUUSD Trading Success Azumi combines effective, no-nonsense technical analysis with robust risk management to help you capitalize on market opportunities. Using proven strategies like Fibonacci retracement levels and ATR-based calculations, Azumi ensures smart trade entries and exits while keeping your risk in check. Why Choose Azumi? Backtested over 14 months on XAUUSD with just $200 starting capital. Results and screenshots available for p
FREE

H I G H - P R O B A B I L I T Y - B R E A K O U T T R E N D L I N E I N D I C A T O R This is no ordinary trendline indicator. It has a highly-probability algorithms incorporated in the script to display only trendlines that may give a very high chance of price breakout. The indicator is not a stand alone indicator. Trader should interpret it together with their very own analysis technique to come up with a more efficient trading strategy. You can use with it other trend indica
FREE

Calculating the number of lots needed so as to make sure you are risking a specific percent of account balance can be tedious. Luckily, there are websites that make this task a lot easier. This indicator takes things to the next level as it ensures you don’t have to leave the metatrader platform to perform these calculations.
The lot-size calculator is a simple calculator that works in all forex currency pairs, BTCUSD, US500, HK50 and XTIUSD. For more free stuff: http://abctrading.xyz
FREE

The HedgeFund Experiment This is a basic version of the professional version; The HedgeFund Manager https://www.mql5.com/en/market/product/85241 It is a multi-currency EA that needs only to be loaded in one chart. It will access all Forex pairs or CFD provided by your broker and will only trade those with a spread less than or equal to MaxSpread specified in the settings. It uses standard Metatrader4 indicators to generate signals but with a customized trend filter to pick which pairs to includ
FREE

Rtc ML Ai | Predictor CORE MACHINE LEARNING ENGINE
Adaptive ML Market Predictor – Multi-Bar Trend & Candle Forecast What This Indicator Does This indicator is a real-time market prediction engine designed to analyze price behavior and estimate future market tendencies . Unlike conventional indicators, this system does not rely on static parameters or historical curve-fitting , but adapts its internal state dynamically during live market operation. Instead of using static rules, the indic
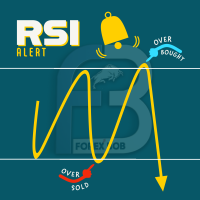
RSI PHONE ALERT RSI Alert is an amazing tool to get alerted on your mobile phone when Overbought/Oversell levels reached on RSI indicator. So that traders who doing manual trading can execute their trades from mobile phone while following their RSI strategy, as most of the traders use RSI for entering their trades. New suggessions are welcome INPUTS RSI levels RSI period Start/End time of the tool Custom text message to get on mobile phone Enable/Disable mobile alert function available Do not fo
FREE
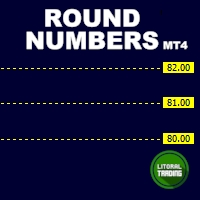
Round numbers (or key levels) is an amazing strategy. These numbers are strong support and resistance levels. So what this indicator does is draw horizontal lines on the chart to help you find these levels. Configurations: 1St level: Color - lines color. Style - lines style. Width - lines width. 2Nd level: Second level lines? - turn off second level lines. Color - lines color. Style - lines style. Width - lines width. Space between lines in points - I don't need explain :) Display at backg
FREE

FadeStormPro EA – Low-Risk Reversal Trading for Consistent Profits FadeStormPro EA is an advanced, fully automated trading system designed to capitalize on sharp, volatile price moves by executing high-probability reversal (fade) trades. Proven to deliver consistent results on EURUSD, USDCAD, and other major currency pairs, FadeStormPro combines multiple institutional-grade detection methods, robust risk management, and professional trade management features to generate profits in various market
FREE

Title: EGO ea - MQL4 Expert Advisor Description: Unlock the full potential of automated trading with Ego ea, a powerful MQL4 Expert Advisor designed to enhance your trading experience. Developed by experienced traders and programmers, this EA incorporates advanced algorithms and smart risk management to optimize your trading strategy. Key Features: Intelligent Trading Logic: Ego EA utilizes a sophisticated trading algorithm that adapts to various market conditions, ensuring consistent performanc
FREE

Trend King (MT4) – v4.4 AO
Adaptive Trend–Pullback EA with AO Baseline Snap, 3-EMA Mapping, and Hybrid Exits
What is Trend King?
Trend King is a professional trend–pullback EA that combines a clean 3-EMA regime model with an Adaptive Optimization (AO) core. The AO learns market volatility via percentiles and snaps your baseline to symbol/timeframe conditions, then maps entry strictness, stops and exits around those baselines (no recompile).
It adds robust risk controls, volatility exits ,

This indicator shows the breakeven line level for the total number of open positions of the current symbol with P/L value and total volume. This indicator is helpful to decide the exit level when using a trading grid strategy. The style of the breakeven line is customizable to choose the color, line shape and font size of the positions description. Send mobile notification when crossing a positive P/L target
FREE

Индикатор горизонтальных и вертикальных объемов. Предназначен для внутридневной и среднесрочной торговли (до Н4).Рассчитывается на основе тиковых или реальных объёмах (если их предоставляет брокер). Ценовой уровень, внутри свечи, на котором было максимальное количество сделок, выделяется цветом. Вертикальные объемы определяют паттерны Price Action (SonicR, BetterVolume) или импульсы (Enhanced) на выбор. Сочетание вертикальных и горизонтальных значений позволяет определить среднесрочные уровни по

Expert for portfolio of basic set long term strategies. You can choose for your AOS trading two ways – first way is pucrhased for EA with grid, martingale and other similar dangerous strategies. This EAs work great and have very profitables results – days, weeks, maybe months, years?.. Until they didnt blow up your account. The second way is to use EAs based on real trading strategies and logical patterns. On MQL Market are very few of these strategies. The risk of trading with these EAs i

Firstly , the script estimates how many Mx bars of the chart (on which this script is applied) the future trend will most likely continue and what is its quality. Secondly (and most importantly), the script is an auxiliary tool for the extremely mathematically advanced and extremely effective ScientificTrade indicator in trading. The script calculates the optimal averaging period, which is also equal to Mx, of the ScientificTrade indicator, which gives the maximum profit according to the strate

Market Insider is an excellent indicator for scalping the trend and also trading market breakouts and reversals. It is based on a ATR measured volatility channel and the CCI indicator. The green trend line and green bars indicates an uptrend and the red trend line and red bars indicates a downtrend. An intensive price breakout of some of the trend lines indicates a market breakout and a potential new opposite trend. In choppy-range behaving market and in low liquidity conditions the breakout sig
FREE

This indicator is designed to make reviews of many charts on different timescales quicker, and easier to do. Track Time and Price across multiple charts Change Symbol on one chart and all other charts of the same symbol will be changed too. Easy to use, quick to master The indicator allows you to identify the price and time where the mouse pointer is on the current chart, across all other charts open on the same Symbol. This allows you to quickly see information on multiple charts whereas normal
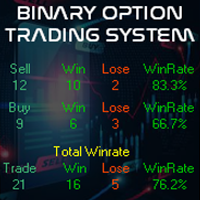
Buy And Sell Binary Option on the MetaTrader 4 (MT4) platform is a specialized technical analysis tool designed to assist traders in identifying binary option trading opportunities using the latest market algorithms. This indicator has been enhanced with an algorithm that incorporates the most up-to-date market information and processes it into a histogram. Additionally, the indicator comes with alert features, including pop-up alerts and email notifications. Latest Market Algorithm : Our indica

The Green Dragon is a strategy that uses the Ichimoku Kinko Hyo system to place trades. The primary element of the Green Dragon is the use of the Chinkou Span as it crosses price action to place trades. This is a classic strategy of the Ichimoku even though its not as popular as some of the other strategies. The Chinkou Span is normally thought of as a market momentum indicator and used to give a trade set up more conviction when analyzing price movement. I find this description somewhat vague a
FREE

Renko Trade Alarm is designed to work on chart with Renko and Mean Renko candles. It generate B uy and S ell signals on the chart and send notifications. Visualization of signals: Swing - Formations 123. Pattern - Double Bottom, Double Top, Triple Bottom, Triple Top, Formations 123 Reverse. Scalp - Periodic change in the price direction, plus additional filters in the form of oscillators Stochastic and MACD. Ichi - Signals filtered by the Ichimoku indicator. For correct operation an offl

Moving Average Stack:
MA Stack single timeframe, multi-timeframe and multi-currency versions for MT4 (Metatrader 4) Very useful for finding current and higher timeframe trends. Best suited for long term trend based trading. For quick scalping use fewer moving averages. And not suitable during low volatility. Only use during high volatility and steady trending markets. Use this to enhance your existing Trend based strategies to find best trends. Instead of using as a standalone indicator.
You ca
Indicator LTS for MT4(Level + Trends + Speed)
The LTS indicator was specially created for quick analysis of consolidations on the chart , which greatly facilitates decision-making when trading. LTS marks resistance and gives information about the forces affecting it, as well as the current speed and average travel. The indicator is easily customizable and can analyze any timeframe. LTS uses a unique trend analysis algorithm based on 4 parameters from global to local.
Order Block Tracker is here to solve one of the biggest challenges traders face: identifying order blocks. Many traders fail to spot these critical zones, often missing out on key market entries. But with Order Block Tracker , you no longer have to worry about that. This advanced indicator automatically highlights these crucial zones for you, giving you the confidence to enter the market at the right time. MT5 Version - https://www.mql5.com/en/market/product/123362/ Key Features of Order Block

True Order Blocks is an excellent indicator for day traders, swing traders, and even scalpers. It is combined with multiple market-moving strategies. It identifies market structure, marks supply and demand zones, displays imbalance moves, structure break, trendline breakout, and much more. True order blocks are compatible with forex, stocks, cryptocurrency, and any market with any timeframe. And I'll show you how to use this tool in your day-to-day trading life. Please watch the video to learn h

Mini Martinel is a Martingale EA. Its biggest feature is that it can run well for $100 , even $50, and it is not limited to one currency pair. Multiple currency pairs can be used . I personally think that Martin EA is a high-risk gambling behavior, so I hope to participate with the least amount of money, but everyone knows that Martin's theoretical basis is to have unlimited money, so this EA may lose money. Of course, I have limited the amount of loss to it. Under the low-risk mode, the $50 sto

Every indicator has its advantages and disadvantages. Trending ones show good signals during a trend, but lag during a flat. Flat ones thrive in the flat, but die off as soon as a trend comes. All this would not be a problem, if it was easy to predict when a flat changes to a trend and when a trend changes to a flat, but in practice it is an extremely serious task. What if you develop such an algorithm, which could eliminate an indicator's flaws and enhance its strengths? What if such an algori

Gann Angles Indicator The Gann Angles Indicator is a powerful technical tool based on the theory of William Delbert Gann. It helps traders identify potential support and resistance levels, as well as trend direction across various time intervals. Key features: Automatic determination of extremum within a specified time range Construction of 9 Gann Fan lines with angles of 82.5, 75, 71.25, 63.75, 45, 26.25, 18.75, 15, and 7.5 Flexible line color customization Adaptation to both upward an

User Grid MT4 is a multifunctional grid Expert Advisor designed to fully or partially automate various ideas related to grid trading. The Expert Advisor can trade on any timeframe, on any currency pair, on several currency pairs, on any number of signs. It does not interfere with manual trading, trading of other Expert Advisors, or the operation of any indicators. It allows you to adjust your settings on the fly, works only with your own positions and orders. It has a clear information syste

Anchored Volume Weighted Average Price (AVWAP, or Anchored VWAP). Tells you who is in control, the buyers or the sellers. Better than all other moving averages because it adds weight to the traded volume. This technique was made popular by Brian Shannon of Alphatrends. It is calculated by multiplying typical price by volume, and the dividing by total volume. It is very simple to use. 1. Press a number from 1 to 9 on the keyboard, then click the chart where you want to anchor the VWAP. 3. Hold C

This Expert advisor (100% Automatic) is able to combine two indicators to create a strategy, this version called "Bear version" (BASIC VERSION)contains 2 indicators: CCI and RSI With a simple personal message you can contact me to ask for your EA "Bear version"(or SUPERIOR Version)with the indicators you have chosen and with your conditions and once agreed I will put it here on the market , or follow the link at the bottom of the page that will take you to my Telegram contact. If you can't
FREE
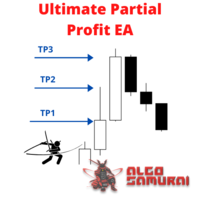
This EA Utility delivers a robust solution for managing an unlimited array of open orders, both manual and automated. It enables customizable partial profit levels utilizing metrics such as pips, ratios, ATR (Average True Range), and profit amounts for precise trade management. The utility features an advanced on-screen display, offering clear visualization of all orders and their profit levels to enhance strategic decision-making and control. To evaluate its performance and interface, the EA s
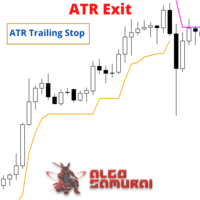
The ATR Exit indicator uses the candle close + ATR value to draw trailing stop lines (orange under buys, magenta over sells) that advance with the trend until the trend changes direction. It uses a multiple of the Average True Range (ATR), subtracting it’s value from the close on buy, adding its value to the close on sell. Moreover, the trailing stop lines are generated to support the order’s trend direction (long or short): In an upward trend, the long trailing stop line (orange line under bu
FREE

This indicator finds the "Double Bottom" and "Double Top" technical analysis patterns, shows them on the chart of the currency pair and can signal if the pattern was formed recently. These patterns are reversal, often after the emergence of the trend turns back or a correction occurs. In order not to search for them yourself, it is enough to add the indicator to the chart, after that, you can change different timeframes in order to quickly find such figures on one of the timeframes. There are so
FREE
This EA using Trend Analyzer to trade follow the trend, not againts it No Martingale, No Grid, No Averaging All orders use fix SL and TP, with RRR 1:2
Recommendation Pairs :EURUSD
TimeFrame : H1
Balance : Recommended $500 with 0.01 lot
Risk Warning: Before you use this EA please be aware of the risks involved. Past performance is no guarantee of future profitability (EA could also make losses). Always run it on demo account at first
After Download please contact me for more instructi
FREE
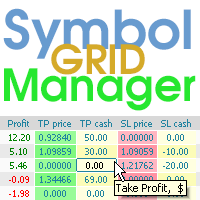
Symbol Manager or Grid Manager, designed to group orders into one position (by Symbol or by Magic Number). This utility will be useful to multi-currency traders (many EAs), who can have multiple orders on several pairs. You will be able to see the total number of lots, the total profit, and set virtual stop loss and virtual take profit. To set a real TP (or SL), you must first set the virtual value, and then enter the command in this cell: "set". If you want to set real TP/SL for all orders at

NeoPrescience AI: The Ultimate All-in-One Trading Dashboard & Scanner Main Dashboard on a clean chart. A Buy/Sell signal with TP/SL projection zones. Scanner Panel showing multiple high-confidence setups. A non-Forex chart (e.g., XAUUSD or BTCUSD) to highlight versatility.
Stop Guessing. Start Trading with Data-Driven Confidence. Cluttered charts. Dozens of conflicting indicators. Missed opportunities. NeoPrescience AI changes everything.
This is not just another indicator — it is your complet

Based on famous and useful indicator - Super Trend, we add some features to make this Indicator much easier to use and powerful. Ease to identify the trend of any chart. Suitable for both Scalping & Swing Better to use in the trending market be careful in sideway market, it might provide some fake signals Setting: ATR Multiplier ATR Period ATR Max Bars (Max 10.000) Show UP/DOWN node Nodes size Show Pull-back signals Pull-back filter ratio Period of MA1 Mode of MA1 Period of MA2 Mode of MA2 A
FREE

SRP (Strong Retracement/Reversal Points) is a powerful and unique support and resistance indicator. It displays the closest important levels which we expect the price retracement/reversal! If all level are broken from one side, it recalculates and draws new support and resistance levels, so the levels might be valid for several days depending on the market!
Key Features You can use it in all time-frames smaller than daily! Displays closest significant support and resistance levels Update the le
FREE

Are you looking to take your stock trading to the next level? With its smart algorithm and expert orders, you can make sure you're always ahead of the game. Make profits from up and down markets, easily predict trends, and stay on top of your investment portfolio - with Stock Flow, it's all possible! Input and output orders are given by a combination of two indicators that can be found on any MT4 platform: MACD Signal, Momentum indicator and Money Flow Index indicator. Indicators have period
FREE

This indicator is stand alone version from MP Pivot Levels (All in one) containing Demark's Pivots.
Calculations: PP = X / 4 R1 = X / 2 - LOWprev S1 = X / 2 - HIGHprev Uses: When the pair currency price may change the direction of movement. Possible constraints of support and resistance that creates plateaus for the currency pair prices. Tendency identification by comparing the present prices according to current day's pivot point and also the prior day's pivot points. ____________
FREE

Full automatic trading platform incorporating the best settings of BinaryMiner and Root-Diamond
Built-in configurations.
1. Automatic calculation of abyom from the deposit.
2.Opening only one position from the settlement level in Long or Short
3.Security for going to No Loss in cases of Contra trend
4 binary indicators filter the market and identify a nearby wave in the market movement.
All incorporating configurations guarantee long-term income
// --------- Configurable parameters -----
FREE

Trading Notes is an innovative tool designed for traders to streamline their decision-making process by allowing them to write and display important reminders or short details directly over their trading charts. This essential feature ensures that traders have quick access to their personalized checklist before opening any positions, enhancing their trading efficiency and accuracy. MT5 Version - https://www.mql5.com/en/market/product/120617 Key Features: Five Customizable Input Fields: Trading
FREE
The MetaTrader Market is a unique store of trading robots and technical indicators.
Read the MQL5.community User Memo to learn more about the unique services that we offer to traders: copying trading signals, custom applications developed by freelancers, automatic payments via the Payment System and the MQL5 Cloud Network.
You are missing trading opportunities:
- Free trading apps
- Over 8,000 signals for copying
- Economic news for exploring financial markets
Registration
Log in
If you do not have an account, please register
Allow the use of cookies to log in to the MQL5.com website.
Please enable the necessary setting in your browser, otherwise you will not be able to log in.