Watch the Market tutorial videos on YouTube
How to buy а trading robot or an indicator
Run your EA on
virtual hosting
virtual hosting
Test аn indicator/trading robot before buying
Want to earn in the Market?
How to present a product for a sell-through
Paid Technical Indicators for MetaTrader 4 - 4

Trend Cutter is a trend indicator which can be used with any time frame including the lower time frames like M1 and M5. The indicator is ideal for traders who prefer intraday trading and will be helpful to those who prefer long-term trading as well. You can use this indicator as a basis for your trading system or as a standalone trading solution. The indicator provides non-repaint signals on the close of the current candle. When the signal candle is closed, the signal will stay fixed on chart.

The indicator measures the imbalance between bulls and bears over a chosen period and shows a straight line in color between the two points right on your chart. Additionally indicator's window shows how exactly the volume developed in time. ( This is a manual indicator and contains features that are may not supported by the MetaTrader current testing environment )
If the bulls have more volume than the bears, the line turns green. If the bears have more volume, it is red. The line also shows

Introduction to Fractal Pattern Scanner Fractal Indicator refers to the technical indicator that makes use of the fractal geometry found in the financial market. Fractal Pattern Scanner is the advanced Fractal Indicator that brings the latest trading technology after the extensive research and development work in the fractal geometry in the financial market. The most important feature in Fractal Pattern Scanner is the ability to measure the turning point probability as well as the trend probabi

Greetings friends, it's been a long time since I had new products that I could confidently offer to you, and now that time has come. This is my new product based on my first indicator, an improved version with no unnecessary settings, optimized for Gold. I was often asked to create something convenient for trading, but I couldn't succeed; it's not easy, as testing and debugging take a lot of time. Like its predecessor, this indicator has its own nuances, but the main goal during optimization was
Delta Fusion Pro – Advanced Order Flow Analysis for Intraday Trading
Delta Fusion Pro is a professional indicator for MetaTrader 4 that reveals aggressive order flow, showing the intensity and direction of institutional pressure in real time. Unlike traditional volume indicators, it analyzes the delta between Ask and Bid volumes to anticipate reversals, confirm trends, and identify professional interest zones. Key Features Intelligent Auto-Tuning System
Automatically adjusts all parameters ba

This is based on Demark's TD Sequential and TD Combo set of indicators. It mostly has the TD Sequential features. It contains the Arrows Indicator showing Buy/Sell signals and the scanner dashboard. Both are for MT4 (Metatrader 4) Platform.
Read in detail in this blog post. And get extra indicators here: https://www.mql5.com/en/blogs/post/749596 and commentary about signals and how to wait for right time: https://www.mql5.com/en/blogs/post/759157
Feature List: - Set TD Setup (9), Countdown (13

BUY INDICATOR AND GET A PIVOT POINT EA FOR FREE AS A BONUS + SOME OTHER GIFTS! ITALO PIVOTS INDICATOR is the best pivot point indicator for strong price reversals and continuations of price movements ever created , and why is that? You will have for the first time inside a pivot point indicator the pivots above the monthly, so, you will have the 3-month pivot lines, 6 months, 1 year, 2 years, 3 years, 5 years and 10 years, very strong support and resistances. Not only that but for the fi

on demo mode use date to work. on version 13 wave added.13.1 histogram and trigger line can be changeble. wave can be set 200-500. can have different signal on wave 200 on version 14 ema used.so can see mountly chart signals also. up-down indicator is no repaint and works all pairs and all time frames charts. it is suitable also 1 m charts for all pairs. and hold long way to signal. dont gives too many signals. when red histogram cross trigger line that is up signal.and price probably will down
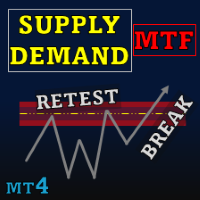
Special offer : ALL TOOLS , just $35 each! New tools will be $30 for the first week or the first 3 purchases ! Trading Tools Channel on MQL5 : Join my MQL5 channel to update the latest news from me Supply Demand Retest and Break Multi Timeframe , this tool plots supply and demand zones based on strong momentum candles, allowing you to identify these zones across multiple timeframes using the timeframe selector feature. With retest and break labels, along with customizable valid
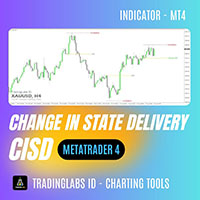
CISD (Change In State Delivery) Indicator TradingLabs ID – ICT Concept Tool The Change In State Delivery (CISD) Indicator is designed based on the ICT (Inner Circle Trader) concept, where price transitions from one delivery state to another often signal high-probability trade opportunities. This tool automatically detects and marks CISD levels on your MT4 charts, helping traders identify potential breakout and retest zones with great accuracy. It is especially useful for traders applying Smart

Please contact us after your purchase and we will send you the complimentary indicators to complete the system Cycle Sniper is not a holy grail but when you use it in a system which is explained in the videos, you will feel the difference. If you are not willing to focus on the charts designed with Cycle Sniper and other free tools we provide, we recommend not buying this indicator. We recommend watching the videos about the indiactor and system before purchasing.
Videos, settings and descri
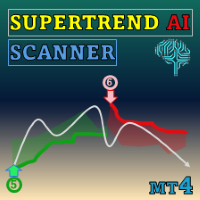
Special offer : ALL TOOLS , just $35 each! New tools will be $30 for the first week or the first 3 purchases ! Trading Tools Channel on MQL5 : Join my MQL5 channel to update the latest news from me Discover the power of AI with the SuperTrend AI Clustering with Scanner , a revolutionary trading tool for MetaTrader 4(MT4). This indicator redefines market analysis by combining K-means clustering with the widely popular SuperTrend indicator, giving traders an edge in navigating trends
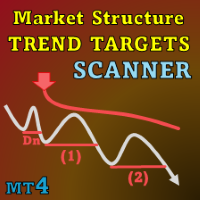
Special offer : ALL TOOLS , just $35 each! New tools will be $30 for the first week or the first 3 purchases ! Trading Tools Channel on MQL5 : Join my MQL5 channel to update the latest news from me I. Introduction
Market Structure Trend Targets Scanner is a powerful tool for analyzing market trends, identifying breakout points, and managing risk via a dynamic stop loss. By tracking previous highs and lows to pinpoint breakouts, this tool helps traders quickly recognize market tren

GoldRush Trend Arrow Signal V1.6 The GoldRush Trend Arrow Signal indicator V1.6 continues to provide precise, real-time trend analysis tailored for high-speed, short-term scalpers in XAU/USD , but it now has additional features and improved efficiency and reliability. Built specifically for the 1-minute time frame, this tool displays directional arrows for clear entry points, allowing scalpers to navigate volatile market conditions with confidence. The indicator consists of PRIMARY and SECONDARY

Introducing Quantum Trend Sniper Indicator , the groundbreaking MQL5 Indicator that's transforming the way you identify and trade trend reversals! Developed by a team of experienced traders with trading experience of over 13 years, Quantum Trend Sniper Indicator is designed to propel your trading journey to new heights with its innovative way of identifying trend reversals with extremely high accuracy.
***Buy Quantum Trend Sniper Indicator and you could get Quantum Breakout Indicator for

Dark Support Resistance is an Indicator for intraday trading. This Indicator is programmed to identify Support and Resistance Lines , providing a high level of accuracy and reliability.
Key benefits
Easily visible lines Only the most important levels will be displayed Automated adjustment for each timeframe and instrument Easy to use even for beginners Never repaints, never backpaints, Not Lag 100% compatible with Expert Advisor development All types of alerts available: Pop-up, Email, Push

Advanced Reversal Hunter Pro (ARH) is a powerful, innovative volatility-based momentum indicator designed to accurately identify key trend reversals. Developed using a special algorithm that provides a clear construction of the average volatility range, without redrawing its values and does not change them. The indicator adapts to any market volatility and dynamically adjusts the width of the band range, depending on current market conditions. Indicator advantages: Advanced Reversal Hunter Pro

Trading System Double Trend - an independent trading system consisting of several indicators. Determines the direction of the general trend and gives signals in the direction of price movement.
Can be used for scalping, intraday or weekly trading.
Features
Works on any time frames and trading instruments (forex, cryptocurrencies, metals, stocks, indices.) Simple visual reading of information that does not load the chart The indicator does not repaint and does not complete signals Works only wh

Reversal Pattern AI is a groundbreaking advancement in indicator development, combining artificial intelligence algorithms, multi-level market analysis, and classical technical analysis methods. It not only detects reversal patterns but also evaluates market inefficiencies, generating highly accurate trading signals.Thanks to its hybrid model, which utilizes price action analysis, volume, volatility, VWAP, and Volume AVG %, the indicator easily adapts to any market conditions. Reversal Pattern A

FOTSI is an indicator that analyzes the relative strength of currencies in major Forex pairs. It aims to anticipate corrections in currency pairs following strong trends by identifying potential entry signals through overbought and oversold target areas. Theoretical Logic of Construction: Calculation of Individual Currency Momentum: FOTSI starts by calculating the momentum for each currency pair that includes a specific currency, then aggregates by the currency of interest (EUR, USD, GBP, CHF,

Elliott Wave Trend was designed for the scientific wave counting. This tool focuses to get rid of the vagueness of the classic Elliott Wave Counting using the guideline from the template and pattern approach. In doing so, firstly Elliott Wave Trend offers the template for your wave counting. Secondly, it offers Wave Structural Score to assist to identify accurate wave formation. It offers both impulse wave Structural Score and corrective wave Structure Score. Structural Score is the rating to sh

The Future Trend Channel is a dynamic and visually intuitive indicator designed to identify trend directions and inform potential price movements. Originally developed by ChartPrime for TradingView, this tool has been adapted for MetaTrader 4, offering traders a experience with similar functionality. Whether you're a swing trader, day trader, or long-term investor, the Future Trend Channel helps you visualize trend strength, anticipate reversals, and optimize entry/exit points.
Key Features Mul

Dark Breakout is an Indicator for intraday trading. This Indicator is based on Trend Following strategy, providing an entry signal on the breakout. The signal is provided by the arrow, which confirms the breaking of the level. We can enter in good price with this Indicator, in order to follow the main trend on the current instrument. It is advised to use low spread ECN brokers. This Indicator does Not repaint and N ot lag . Recommended timeframes are M5, M15 and H1. Recommended working pairs

ICT, SMC, Smart Money Concept, Support and Resistance, Trend Analysis, Price Action, Market Structure, Order Blocks, Breaker Blocks, Momentum Shift, Strong Imbalance, HH/LL/HL/LH, Fair Value Gap, FVG, Premium & Discount Zones, Fibonacci Retracement, OTE, Buyside Liquidity, Sellside Liquidity, Liquidity Voids, Market Sessions ,Market Time, , NDOG, NWOG,Silver Bullet,ict template In the financial market, accurate market analysis is crucial for investors. To help investors better understand mark
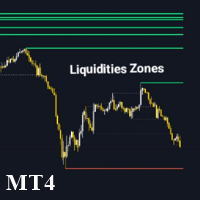
The Liquidity Zone Detector is an advanced technical indicator designed to identify and highlight key liquidity zones in the market using the ZigZag indicator. This tool pinpoints price levels where significant liquidity is likely present by drawing trendlines at the highs and lows detected by the ZigZag. The Liquidity Zone Detector assists traders in spotting potential reversal or trend continuation areas based on liquidity accumulation or release. Key Features: Automatic Liquidity Zone Identif

The indicator automatically identifies the 1-2-3 pattern on the chart. The indicator is able to monitor the formation of pattern in real time. It informs the trader when the pattern is completely formed (when the price breaks the line in point 2) and displays the completed patterns in history. The patterns are never redrawn. The indicator can identify patterns on any instruments (currency pairs, stock market, gold, etc.) without the need to adjust to each instrument. Simple and clear visualizati

Scalping monster - ready trading system in the form of an indicator. Scalping monster is designed for the Metatrader4 platform. When placed on a forex chart, the indicator automatically analyzes the market using an adaptation algorithm and displays the signals to the trader in the form of red and blue dots. The indicator also shows in the upper right corner information about potential profit / loss.
Our other products at https://www.mql5.com/en/users/master-mql4/seller
How to trade using S

Multicurrency and multi-timeframe indicator Inside Bar (IB). In the parameters, you can specify any desired currencies and timeframes. The panel displays the last found Inside Bar (and Mother Bar) pattern, the current price position and the breakout of the levels of the Mother and Inside Bars. You can set the size and color for bars and text in the cells. The indicator can also send notifications when levels are broken. The dashboard highlights Double Inside Bar in a special color. By clicking

The indicator defines a trading corridor, a flat market, and corrections.
Allows you to compare the significance of different flat and trend areas (by time of existence and by volatility). This makes it possible to assess the market cycle and its mood at a glance.
That is, how long does the flat last on average, and how long is the trend and what kind of volatility they have in points.
As a rule, the longer the flat lasts, the more likely it is to accumulate the potential for a strong movem

The ICT Asian Range Indicator is a powerful tool designed to help traders identify key market structures and liquidity zones based on the ICT Asian Range Trading Strategy. It marks the highest and lowest price levels of the Asian session (7 PM to midnight New York time) and provides critical insights into market movements for the following trading sessions. This indicator enhances trade accuracy by highlighting liquidity sweeps, and Fair Value Gaps (FVGs), making it an essential tool for ICT tra
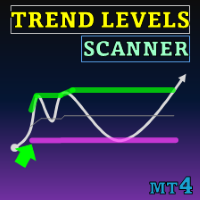
Special offer : ALL TOOLS , just $35 each! New tools will be $30 for the first week or the first 3 purchases ! Trading Tools Channel on MQL5 : Join my MQL5 channel to update the latest news from me The Trend Levels indicator is meticulously crafted to pinpoint critical trend levels—High, Mid, and Low—during market movements. With real-time calculations based on the highest, lowest, and mid-level values over a customizable lookback period, this tool provides traders with a structure

- Real price is 2000$ - 50% Discount (It is 99$ now) - It is enabled for 5 purchases. Contact me for extra bonus (Gann Trend indicator), instruction or any questions! - Non-repaint, No lag - I just sell my products in Elif Kaya Profile, any other websites are stolen old versions, So no any new updates or support. - Lifetime update free Gann Gold EA MT5 Introduction W.D. Gann’s theories in technical analysis have fascinated traders for decades. It offers a unique approach beyond traditional
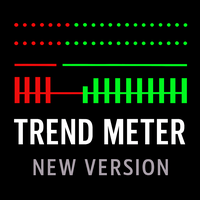
Trend Meter – Multicurrency Trend Power Analyzer Trend Meter is a multicurrency Forex trend indicator for MT4 designed to analyze trend strength and trend direction in real time.
It combines multiple timeframes, currency pairs, and internal trend signals into a compact, color-coded trend display. Trend Meter is a lightweight indicator that provides a clear overview of market conditions without delay.
It analyzes several timeframes, multiple currency pairs, and different internal trend signals,
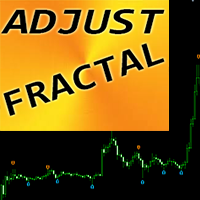
"Adjustable Fractals" - is an advanced version of fractal indicator, very useful trading tool! As we know Standard fractals mt4 indicator does not have settings at all - this is very inconvenient for traders. Adjustable Fractals has resolved that issue - it has all necessary settings: Adjustable period of indicator (recommended values - above 7). Adjustable distance from Highs/Lows of price. Adjustable design o f fractal arrows. Indicator has built-in Mobile and PC alerts.
Click here

FX Levels: Exceptionally Accurate Support & Resistance for All Markets Quick Overview
Looking for a reliable way to pinpoint support and resistance levels across any market—currencies, indices, stocks, or commodities? FX Levels merges our traditional “Lighthouse” method with a forward-thinking dynamic approach, offering near-universal accuracy. By drawing from real-world broker experience and automated daily plus real-time updates, FX Levels helps you identify reversal points, set profit targe
** All Symbols x All Time frames scan just by pressing scanner button ** After 18 years of experience in the markets and programming, Winner indicator is ready. I would like to share with you! *** Contact me to send you " Trend Finder indicator " free, instruction and add you in "M1 Signal Scanner group" for sharing or seeing experiences with other users. Introduction: M1 Signal Scanner is the indicator designed scalping M1 time frame to detect Small trend switching in the direction

Pipfinite creates unique, high quality and affordable trading tools. Our tools may or may not work for you, so we strongly suggest to try the Demo Version for MT4 first. Please test the indicator prior to purchasing to determine if it works for you. We want your good reviews, so hurry up and test it for free...we hope you will find it useful.
Combo Razor Scalper with Trend Laser Strategy: Scalp in the direction of the trend Watch Video: (Click Here)
Features Scalping indicator using a confirme

Multicurrency and multitimeframe modification of the indicator Bollinger Bands. On the dashboard you can see breakouts and touches of the Bollinger Bands. In the parameters you can specify any desired currencies and timeframes. The indicator can also send notifications when the price touches the Bollinger Bands, when the current volatility changes (expands or falls), and when the price touches all the bands. By clicking on a cell with a period, this symbol and period will be opened. This is MTF

Bitcoin Predictor is an arrow based indicator designed to predict price reversals. This tool can be used with BTC and other cryptos. It can also be used with other currencies. But you need to check first what pairs work best. Some pairs and time frames can work really great. Recommended time frame is H1. The indicator is very easy to use. All you need is to follow the arrows. The indicator can work as a standalone system or be a part of any system you are already using. The signals DO NOT REPA
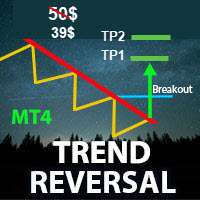
** All Symbols x All Timeframes scan just by pressing scanner button ** Discount: The price is $50$, But now it is just $39, Limited time offer is active.
*** Contact me to send you instruction and add you in "Trend Reversal group" for sharing or seeing experiences with other users. Introduction: Trendlines are the most famous technical analysis in trading . Trend lines continually form on the charts of markets across all the different timeframes providing huge opportunities for trader

SMT (Smart Money Technique) Divergence refers to the price divergence between correlated assets or their relationship to inversely correlated assets. By analyzing SMT Divergence, traders can gain insights into the market's institutional structure and identify whether smart money is accumulating or distributing assets. Every price fluctuation should be confirmed by market symmetry, and any price asymmetry indicates an SMT Divergence, suggesting a potential trend reversal. MT5 Version - https:/

Grab your copy while it’s still available at this price — it may increase at any time! The objective of the black horse indicator is to identify divergences between price action and the VWAP indicator. It employs filters to sift through potential false divergences and signals high-quality, accurate alerts.
Bearish divergences are denoted by red dots above the candle, while bullish divergences are represented by green dots below the candle.
The primary divergence filter revolves around ATR (Av

Use with disciplined risk management. Fibonacci entry system based on the golden zone 38.2 - 61.8 where the entry is confirmed at 23.6 with indications of Take Profit 3:1. Automatically plotted Fibonacci contains retracement and expansion Fibonacci in a single indicator. Up to 77% win rate with this system. FTMO challenge pass with 0.50% risk and 1.50% R:R.
SL Curruncy impulse https://www.mql5.com/en/market/product/82593 SL Session Strength 28 Pair flow of this intraday Asian London New York Sessions strength.SL Session Strength 28 indicator best for intraday scalper. market powerful move time you can catch best symbol. because you'll know which currencies are best to trade at that moment. Buy strong currencies and sell weak currencies (Diverging currencies). Suggested timeframes to trading : M5 - M15 - M30 - You can however just change session

Dark Oscillator is an Indicator for intraday trading. This Indicator is based on Counter Trend strategy, trying to intercept changes in direction, in advance compared trend following indicators. We can enter in good price with this Indicator, in order to follow the inversion of the trend on the current instrument. It is advised to use low spread ECN brokers. This Indicator does Not repaint and N ot lag . Recommended timeframes are M5, M15 and H1. Recommended working pairs: All. I nst

The Reversal Master is an indicator for determining the current direction of price movement and reversal points. The indicator will be useful for those who want to see the current market situation better. The indicator can be used as an add-on for ready-made trading systems, or as an independent tool, or to develop your own trading systems. The Reversal Master indicator, to determine the reversal points, analyzes a lot of conditions since the combined analysis gives a more accurate picture of t
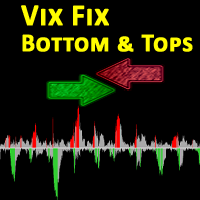
The VIX Fix is a volatility indicator developed by renowned trader Larry Williams. It's designed to measure volatility in assets that don't have options or futures, such as individual stocks and forex markets. Essentially, it acts as a synthetic VIX (Volatility Index) for any asset , providing a gauge of market uncertainty. This modified version of William's indicator helps you to find market bottoms and market tops. It comes with 2 styles: Stochastic and histogram style. Please see screenshot

INSTRUCTIONS RUS / INSTRUCTIONS ENG - VERSION MT5 Main functions: Displays active zones of sellers and buyers! The indicator displays all the correct first impulse levels/zones for purchases and sales. When these levels/zones are activated, where the search for entry points begins, the levels change color and are filled with certain colors. Arrows also appear for a more intuitive perception of the situation. LOGIC AI - Display of zones (circles) for searching entry points when activa

Objective: To notify/alert traders if price touched or closed above/below the moving average. Features/Settings: Moving average method supported: Simple, Exponential, Smoothed and Linear Weighted Works on all currency pairs. Set the Moving Average Period/Shift value Timeframe supported: 1m, 5m 15m, 30m, 1H, 4H, 1D, 1WK, 1Mo Set the Applied Price: Close, Open, High, Low, Price, etc. Set the Candle Size Type: Full Length or Body Length Set the Candle Size to Trigger an Alert Alert type: Popup, Se

This multicurrency strategy simultaneously determines the strength of the trends, entry points and the take profit levels for each trade. The indicator can determine entry points on any trading period from M1 to D1. For the convenience of users, the indicator renders the entry point (in the form of an arrow), recommended take profit levels (TP1, TP2, TP3) and the recommended stop loss level (SL1, SL2). The options for using the strategy are described below. Full description of the indicator Cosm

Or M oving A verage S upport R esistance Bands .
MASR Bands indicator is a moving average surrounded by two bands that work together as support and resistance levels. Statistically, MASR Bands contain price candles 93% of the time. Here is how it is calculated in steps: 1. The first step is to calculate the highest high (HHV) and the lowest low (LLV) for an X period of time.
2. The second step is to divide HHV by LLV to get how wide is the distance between them as a percentage. I call the resu
The High Low Cloud Trend indicator is a channel-based technical analysis tool that identifies trend direction and mean reversion opportunities through adaptive price boundaries. The system operates by calculating the highest high and lowest low over a specified lookback period, creating outer channel boundaries that define the overall price range. A secondary inner channel uses a shorter period (one-quarter of the main lookback) to capture more immediate price movements within the broader range.

SMARTMASS INDICATOR This indicator is different from all known volume indicators. It has a significant distinction; it is an algorithm that relates price movement to volume, attempting to find proportionality and efficient movement while filtering out noise and other movements that are more random and do not follow a trend or reversal. Ultimately, it reveals the true strength of the movement, indicating whether it has genuine support from bulls or bears or if it's merely a high-volume movement
Immerse yourself in a trading environment where adaptability meets precision. Dynamic Grid Pro v1.7 offers a suite of tools designed to refine your approach in the market. This system was developed with the intention of providing a flexible framework for the execution of grid trading strategies. Its core functionality lies in the ability to dynamically adjust grid parameters in response to ever-changing market conditions. Features of Dynamic Grid Pro v1.7: Dynamic Grid: The system automatically

"THE ULTIMATE TRADING SECRET - UNLOCK PROFITS FAST!" A new trading system. An amazing trading indicator. Bonus: You get the Forex Trend Commander Indicator absolutely free!
Most traders waste months chasing strategies and endless charts - only to miss opportunities and second-guess themselves.
Here’s the secret: You don’t need to struggle. You don’t need years of training. All you need is the right tool - one that shows you exactly when to buy and sell, every single time.
Introducing ProTrad

Divergence and Convergence are important harbingers of reversals in stock markets.
The Divergence Sync indicator is designed to automatically search for divergences on a large number of indicators with different parameters.
The search for divergences is carried out on these indicators: (CCI, CHO, DeMarker, MACD, MFI, Momentum, OBV, OsMA, RSI, Stochastic, WPR, Awesome Oscillator ).
To search for divergences, you can use one technical indicator or search simultaneously on any number of indicator

Description
SuperCCI is an indicator based on the standard CCI indicator. It identifies and displays convergences/divergences in the market and forms the corresponding entry points. Also, using the trading channel index, it determines the direction of the trend and displays the levels of support and resistance .
Features Not repaint. Shows entry points. Shows the direction of the current trend and support/resistance levels. Has notifications. Recommendations
Use convergence/divergence to ide

Algo Trading Indicaor
With this indicator , you’ll have zones and trends that hight probability the price will reverse from it. so will gives you all the help that you need
Why should you join us !? 1-This indicator is logical since it’s working in previous days movement , to predict the future movements.
2-Algo trading indicator will help you to draw trends which is special and are too strong than the basics trend , trends will change with the frame time that you work on .
3-We can use

KT MACD Alerts is a personal implementation of the standard MACD indicator available in Metatrader. It provides alerts and also draws vertical lines for the below two events: When MACD crosses above the zero line. When MACD crosses below the zero line.
Features It comes with an inbuilt MTF scanner, which shows the MACD direction on every time frame. A perfect choice for traders who speculate the MACD crossovers above/below the zero line. Along with the alerts, it also draws the vertical lines
Order Block Tracker is here to solve one of the biggest challenges traders face: identifying order blocks. Many traders fail to spot these critical zones, often missing out on key market entries. But with Order Block Tracker , you no longer have to worry about that. This advanced indicator automatically highlights these crucial zones for you, giving you the confidence to enter the market at the right time. MT5 Version - https://www.mql5.com/en/market/product/123362/ Key Features of Order Block
The FVG Zone Indicator is a powerful tool designed to identify Fair Value Gaps (FVG) in the market, highlighting price imbalances between fair value and market price. This precise identification of gaps enables traders to spot potential market entry and exit points, significantly enhancing their ability to make informed trading decisions. With its intuitive and user-friendly interface, the FVG Zone Indicator automatically scans charts for Fair Value Gaps, marking these zones on the price chart i
Special offer : ALL TOOLS , just $35 each! New tools will be $30 for the first week or the first 3 purchases ! Trading Tools Channel on MQL5 : Join my MQL5 channel to update the latest news from me In the ever-changing landscape of financial trading, accurately identifying and analyzing support and resistance levels is essential for making informed investment decisions. SnR Retest and Break Multi-Timeframe is a support and resistance indicator designed to enhance your trading analy

The Simple ICT Concepts Indicator is a powerful tool designed to help traders apply the principles of the Inner Circle Trader (ICT) methodology. This indicator focuses on identifying key zones such as liquidity levels, support and resistance, and market structure, making it an invaluable asset for price action and smart money concept traders. Key Features Market Structure : Market structure labels are constructed from price breaking a prior swing point. This allows a user to determine t

The Silent Edge of Smart Money
"It's not about how much you do, but how much love you put into what you do that counts." – Mother Teresa
They say the real money in trading is made in the shadows—where inefficiencies hide and only the most perceptive capitalize. That’s exactly where the Arbitrage Thief Index (ATI) thrives. For years, this tool has been my personal advantage , silently identifying low-risk, high-reward trades before the crowd even notices. It’s the kind of edge top fund managers

It would be good to always be aware of the "struggle" between buyers and sellers. Then it would be much easier to determine the best direction to go in order not to lose out. This indicator offers an original solution to this problem: the supply and demand values are compared with the High and Low prices for the selected period, thus trying to determine the market movement towards the stronger side without ignoring the strength of the opposite side. All this is displayed in a separate window usi

Key Zone Detector Key Level Supply & Demand Zone Detector Overview A sophisticated supply and demand zone detection indicator that identifies and rates key price levels where significant market activity occurs. The indicator uses fractal analysis and multiple validation methods to detect and classify trading zones. Key Features Zone Detection Auto-detects support and resistance zones Uses dual fractal system (fast and slow) for confirmation Dynamic zone thickness based on ATR (Average True Ran

Capture every opportunity: your go-to indicator for profitable trend trading Trend Trading is an indicator designed to profit as much as possible from trends taking place in the market, by timing pullbacks and breakouts. It finds trading opportunities by analyzing what the price is doing during established trends. [ Installation Guide | Update Guide | Troubleshooting | FAQ | All Products ]
Trade financial markets with confidence and efficiency Profit from established trends without getting whip

M1 EASY SCALPER is a scalping indicator specifically designed for the 1-minute (M1) timeframe, compatible with any currency pair or instrument available on your MT4 terminal. Of course, it can also be used on any other timeframe, but it works exceptionally well on M1 (which is challenging!) for scalping. Note: if you're going to scalp, make sure you have an account suitable for it. Do not use Cent or Standard accounts as they have too much spread! (use ECN, RAW, or Zero Spread accounts)
Robustn
- Real price is 80$ - 40% Discount (It is 49$ now) Contact me for instruction, add group and any questions! - Non-repaint - I just sell my products in Elif Kaya profile, any other websites are stolen old versions, So no any new updates or support. - Lifetime update free Related product: Bitcoin Expert
Introduction The breakout and retest strategy is traded support and resistance levels. it involves price breaking through a previous level. The break and retest strategy is designed to help tr
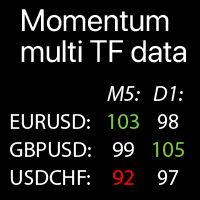
Multi-timeframe Momentum values on the selected Symbols: compare the current market trends The indicator displays Momentum indicator values from all selected timeframes and Symbols in a single table , which allows you to quickly analyze current market price trends .
Multifunctional trade manager : 66+ features | Contact me for any questions | MT5 version Each Symbol can be customized: removed / replaced. You can add up to 40 Symbols. Panel can be moved to any place of the chart (drag
Learn how to purchase a trading robot from the MetaTrader Market, the store of application for the MetaTrader platform.
The MQL5.community Payment System supports transactions via PayPal, bank cards and popular payment systems. We strongly recommend that you test the trading robot before buying, for a better customer experience.
You are missing trading opportunities:
- Free trading apps
- Over 8,000 signals for copying
- Economic news for exploring financial markets
Registration
Log in
If you do not have an account, please register
Allow the use of cookies to log in to the MQL5.com website.
Please enable the necessary setting in your browser, otherwise you will not be able to log in.