Watch the Market tutorial videos on YouTube
How to buy а trading robot or an indicator
Run your EA on
virtual hosting
virtual hosting
Test аn indicator/trading robot before buying
Want to earn in the Market?
How to present a product for a sell-through
Paid Technical Indicators for MetaTrader 4 - 9

The indicator builds a three-period semaphore and reversal pattern 123 from the extremum. The signal comes at the opening of the second candle. This pattern can be traded in different ways (test point 3, breakout and others). Exit from the channel or breakout of the trendline is the main trigger for finding an entry point. Icons are colored according to Fibonacci levels. Yellow icons indicate a test of a level at which the signal is amplified. Using the multi-currency dashboard, you can track w
The indicator finds the low, high, extreme volume based on the specified coefficients and paints them in the specified colors. This replaces the standard volume drawing function in the metatrader terminal. Bars can also be painted in the color of the volume. On bars with extreme volume, the maximum horizontal volume (cluster/POC) is determined. Depending on its location (pushing, neutral, stopping), the cluster also has its own color. If the cluster is in the shadow, and the bar has an extreme
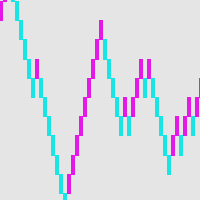
Brick diagram-an alternative way of trading If you are a trader who is confused by the candlesticks in countless charts, or don’t know how to draw lines or how to draw support and resistance lines, you should find another trading method that suits you at this time. NS. Just like a driver will stop for a full overhaul after repeated encounters, the same is true for a transaction. The brick chart provides a simple trading method for intraday traders. In fact, this method has the same history as K-
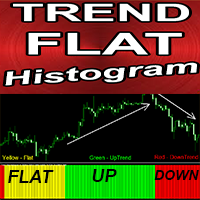
Crypto_Forex Indicator "Trend Flat Histogram" for MT4, No Repaint.
- Trend Flat Histogram indicator is very sensitive and much more efficient than any standard Moving Averages. - It is designed to show current market conditions: Flat, Uptrend, Downtrend. - Indicator has 3 colors: Yellow for Flat market conditions, Red for downtrend and Green for uptrend (colors can be changed in settings). - With Mobile and PC alerts. - It is great to combine this indicator with any other trading methods: Pri
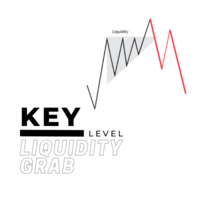
For a bullish move to occur for example, there should be alot of buying power. but you cannot buy if there is no sell on the other side, so the big players usually tend to manipulate the market in order to create available positions on the other side and be able to open their positions and one of the ways is by creating a fake breakout/ a liquidity grab. Before majority of big reversal moves and trends are formed, a liquidty grab would have occured in order to have enough orders to push for the

Automatically plots Fibo levels, based on the High & Low prices from the specified time frame Multiple bars may be united: e.g. you can get a Fibo based on the 10-days Highs and Lows My #1 Utility : 65+ features, including this indicator | Contact me for any questions | MT5 version Helps to see potential reversal levels; Patterns formed at the Fibo levels tend to be stronger; Significantly reduces the time spent on manual plotting ; Settings: Timeframe to calculate the base High & Low p

Candle Volume Strength is an advanced volume analysis indicator that provides insights into the ongoing battle between buyers and sellers. It calculates and visualizes real time volume shifts, helping traders confirm breakouts, trends, retracements, and reversals with greater accuracy.
Key Features: Volume Based Confirmation – The indicator monitors tick volume changes and alerts when market power shifts between buyers and sellers. Trend and Breakout Validation – By analyzing volume distributio
Unlock a new dimension of trading with our cutting-edge MQL4 indicator, Range BreakOut MT4
This powerful tool is designed to identify and capitalize on price movements as they break out of established ranges,
providing you with the precision and confidence needed to thrive in the dynamic world of financial markets.
MT5 Version : WH Range BreakOut MT5
Features:
Accurate Range Detection. Multi Symbols and multi TimeFrames (Scanner). Real-Time Breakout Signals. Customizable Parameters. Risk

The Multi Timeframe Candles indicator is a powerful visualization tool designed to help traders align their lower timeframe analysis with higher timeframe structure. By plotting candles from a selected higher timeframe (H1, H4, D1, etc.) directly on your current chart, this indicator gives you a clearer perspective of the overall market narrative without switching charts.
Who Needs This Indicator? This tool is ideal for: Smart Money Concept (SMC) / ICT Traders who rely on higher timeframe
Stop missing powerful breakout opportunities! The Advanced Breakout Scanner Dashboard is a professional-grade trading tool that monitors up to 28 currency pairs in real-time, scanning for ten unique high-probability breakout strategies simultaneously. Attach it to a single chart to get a complete overview of the entire market, instantly identifying the best trading setups as they happen. This is not just a signal indicator; it's a complete trading dashboard designed for serious breakout traders.

Special offer : ALL TOOLS , just $35 each! New tools will be $30 for the first week or the first 3 purchases ! Trading Tools Channel on MQL5 : Join my MQL5 channel to update the latest news from me Introducing the revolutionary RSI Kernel Optimized with Scanner , a cutting-edge tool that redefines traditional RSI analysis by integrating the powerful Kernel Density Estimation (KDE) algorithm. This advanced indicator not only provides real-time insights into market trends but also in

Multicurrency and multitimeframe modification of the Stochastic Oscillator — Stochastic Dashboard . You can specify any desired currencies and timeframes in the parameters. The panel displays the current values and intersections of the lines — Signal and Main (stochastics crossover). Also, the indicator can send notifications when crossing overbought and oversold levels. By clicking on a cell with a period, this symbol and period will be opened. This is MTF Scanner. Similar to the Currency Stre

[V 2.00] MTF NRPA 5 Moving Average RTD has been released! ( New sub buttons 2025 ) Non repaint arrow real time dashboard. If you are looking for the best moving average indicator then you are on the right page. Generally people will install two moving averages because the intersection of the two moving averages (the crossover) will determine the direction of the next price trend. If the fast moving average intersects with the slow moving average and fast > slow then the trend is up. Conversely,
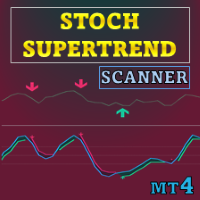
Special offer : ALL TOOLS , just $35 each! New tools will be $30 for the first week or the first 3 purchases ! Trading Tools Channel on MQL5 : Join my MQL5 channel to update the latest news from me This tool combines Stochastic RSI with SuperTrend logic to generate directional signals based on momentum shifts. It overlays a SuperTrend-style envelope on the Stochastic RSI and highlights turning points as momentum passes the overbought/oversold thresholds. See more MT5 version at: S
** All Symbols x All Timeframes scan just by pressing scanner button ** *** Contact me to send you instruction and add you in "RSI scanner group" for sharing or seeing experiences with other users.
Introduction RSI divergence is a main technique used to determine trend reversing when it’s time to sell or buy because prices are likely to drop or pick in the charts. The RSI Divergence indicator can help you locate the top and bottom of the market. This indicator finds Regular divergence for pul
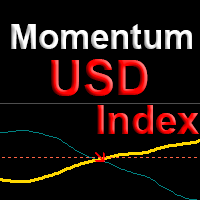
The indicator shows points for the continuation of the trend for currency pairs with the participation of the USD dollar with a probability of more than 80%. The algorithm is based on comparing the momentum of the current currency pair with the momentum of the DX dollar index at the current time. Using the dollar index allows us to evaluate not only the current pair, but the entire picture for all major currencies at once. This approach increases the reliability and reduces the number of false p
The indicator can be used with any time frame and forex pair. One easy to use parameter in the indicator will allow you to adapt the signals to any forex pair and time frame you want to trade.
The Arrows DO NOT REPAINT !
Information Panel: We've equipped this indicator with a user-friendly Panel. one side of the panel, the time frame is displayed, while on the other side, the currency pair is shown. Below that, the direction of the trend is identified, showing whether it is an uptrend or a d
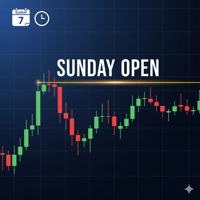
Russian version https://www.mql5.com/ru/market/product/148571?source=Site +Profile+Seller This guide is designed to help beginner traders understand how the "Sunday Open " indicator works and is configured, as well as how to properly interpret its signals for making informed trading decisions. Part 1: What is the Sunday Open Indicator and How to Use It? Core Concept The indicator is based on a simple but powerful concept: the weekly opening price is a key support and resistance level. Imagine t

This scanner is monitoring the entire market for Ichimoku trade opportunities for all symbols and for all time frames. You don't have to look to all the charts, for all symbols and for all time frames. This scanner will alert you on your computer, or on your mobile, when a trade opportunity has been found. You never have to miss a trade opportunity! This indicator is designed to scan all pairs and symbols, for all selected time frames, to find a Tenkan and Kijun Cross or a breakout of the Ich
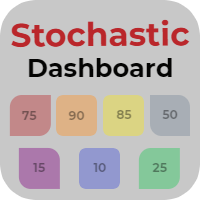
Stochastic Dashboard is an information panel which allows you to have a global market vision through a stochastic indicator. Stochastic Dashboard analyzes and tracks all the assets you want to invest in. Take advantage of this useful dashboard where you can open in a few seconds the chart and quickly invest in it.
Main features of Stochastic Dashboard Graphical panel that allows you to know the situation of many assets. 7 different stochastic situations to discover when an asset is overbought o

IMPORTANT NOTICE – LICENSE & ACTIVATION REQUIRED
Activation Instructions:
Upon completing your purchase, please contact us immediately to receive your license key, password, or activation details . Without these, the software will not function. We are here to ensure a seamless activation process and assist you with any questions. Multilingual Customization
To enhance your trading experience, we offer full customization of the software in multiple languages. Our team can provide tra
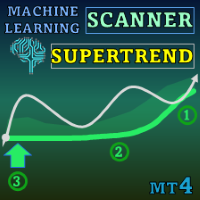
Special offer : ALL TOOLS , just $35 each! New tools will be $30 for the first week or the first 3 purchases ! Trading Tools Channel on MQL5 : Join my MQL5 channel to update the latest news from me Unlock the power of advanced machine learning with the Machine Learning Adaptive SuperTrend , a cutting-edge indicator designed to seamlessly adapt to changing market conditions. By integrating k-means clustering with the SuperTrend methodology, this indicator enables precise trend ident

LIMITED TIME SALE - 30% OFF!
WAS $50 - NOW JUST $35! The RSI / TDI alert dashboard allows you to monitor RSIs at once (selectable by you) on every major pair you trade. You can use it in two ways: 1. Select multiple time frames and the dash will show you when there are multiple time frames extended beyond normal trading conditions. A great indicator that price has pushed hard recently as it has achieved an overbought or oversold level across multiple time frames so a pullback or reversa
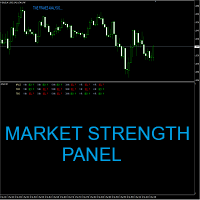
Market Strength Panel is a multi-timeframe indicator which can be helpful to forex and binary options traders. The panel represents market conditions on several time frames from M1 up to H4. The indicator provides info on three important market aspects. They are Trend, Force and Impulse. If all these 3 components align, the indicator will provide you with a BUY or a SELL signal depending on the market direction. The indicator plots signals right on your chart. You can choose what time frames it
The Strat Dashboard - Multi-Symbol Pattern Scanner for Rob Smith's Strat Strategy Transform Your Trading with Real-Time Multi-Symbol Strat Analysis The Strat Dashboard is a powerful, professional-grade indicator designed specifically for traders using Rob Smith's renowned "Strat" trading methodology. Monitor unlimited symbols across multiple timeframes simultaneously, identify high-probability setups instantly, and never miss another actionable pattern. MT5 Version :- https://www.mql5.com/en/ma
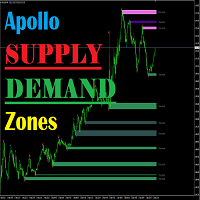
Apollo Supply Demand Zones with ALERTS is an indicator that calculates support and resistance levels. The indicator will be helpful to absolutely all traders, regardless of what strategy they use. This indicator can become one of the main elements of your trading system. The indicator calculates levels both on the current time frame and can work in MTF mode, displaying levels from a higher time frame. This indicator can be used absolutely on any time frame and with any trading instrument. The

The indicator searches for impulse candles and displays them on the chart. It includes a shadow filter. It also finds breakout levels of Bollinger Bands. You can enable multi-currency dashboard in the settings. Alerting choose between the current chart or the entire list. Blog-Link - Retest and Fake Breakout with UPD1
Trading patterns: Trend retest. False Breakout. Others.
EURUSD, GBPUSD, XAUUSD, ... M15, M30, H1.
Input parameters.
Basic. Bars Count - the number of history bars on which th

The SMC Sessions Indicator is a precision tool crafted for Smart Money traders who rely on ICT concepts, liquidity hunts, and session based strategies . It seamlessly maps out critical session based trading zones using the most proven and popular concepts used by institutional level traders. This all in one session indicator overlays your chart with the most effective and high probability range strategies, including: ICT Asian Range, London Breakout, New York Range, ICT London Op

The Grand Signal indicator is a unique tool that not only provides an understanding of market behavior but also precisely identifies trend entry points after intraday correction limits, with accuracy down to a five-minute candlestick! It includes individual settings for each currency pair. After purchasing, be sure to message me directly for instructions! Telegram: @Lapinsania or here in the Market! I
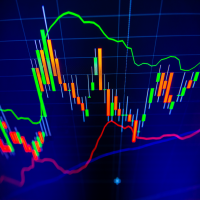
The indicator calculates reversal points based on the past trend and forms a channel (outer) on this basis. This elapsed time span from which the reversal points are determined can be specified in the settings.
An inner channel is also drawn in white. The trend continues in this channel, if there is a sideways trend. Here the upper / lower line form the possible turning point.
The indicator is suitable for all trading areas, whether forex, crypto, metals, indices or futures. All areas traded

This indicator analyzes the ranges in the selected LookBack Bars and shows the relative strength of the price movement with the Level percentage you set. The blue line indicates that the current price movement is strong, and the yellow line indicates that we are in a flat price movement. The blue line does not determine whether the price action is up or down, it just shows relative strength. Therefore, as seen in the picture, direction can be determined with a simple zigzag indicator on the main

缠中说禅在MT4的应用,该指标自动识别分型,划笔,划线段,显示笔中枢,线段中枢,也可以根据需求在参数中设置显示自己所需要的。 1.笔采用条件较为宽松的新笔。 2.当前分型与前面分型不能构成笔时,若与前面笔同向且创新高或新底时会延伸笔,若与前面笔异向且符合替换条件则去除倒数第一笔,直接倒数第二笔。 3.线段的终结第一类情况:缺口封闭,再次创新高或新底新低,则判为终结,同时破坏那一笔的右侧考虑特征序列包含。 4.线段终结的第二类情况,缺口未封闭,考虑后一段特征序列分型出现新的顶底分型,同时做了包含处理。 5.中枢显示笔中枢和段中枢可在参数选择 6.第一类买卖点两种方式可选,参数1为MACD动能柱面积,参数2为斜率
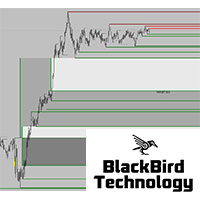
Dear Traders, check out my new multi level market liquidity indicator : https://www.mql5.com/en/market/product/73098
Many of you have been trading very good with this indicator, thanks for the support and positive feedbacks ! For more information about market liquidity, a manual on how to use this indicator please send me a message. A lot of information can be found on the net. (search liquidity trading/ inner circle trader)
https://www.youtube.com/watch?v=yUpDZCbNBRI
https://www.youtube.com/

Introducing a powerful, precision-engineered indicator that seamlessly combines Pivot Points, Moving Averages, and Multi-Timeframe Analysis to deliver high-probability Buy and Sell signals in real-time. This tool is your strategic edge, designed to identify trend reversals, market momentum, and optimal trade entries, no matter your preferred trading style.
Our algorithm goes beyond standard indicators—by analyzing multiple timeframes simultaneously, it spots true market turning points while fi

after getting indic ator cont act me for Bonus E a. Non Repaint TMA channel with special conditioned arrows on price cross of channel lines plus market Volatility factor, which makes product much more accurate than any usual tma channel indicators. It is proven to be profitable with Ea built based on it which you will get as a BONUS in case of indicator purchase. Good luck.
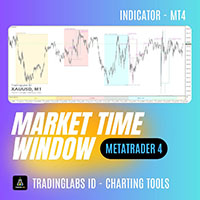
ICT Market Time Cycle – Complete Session & Time Window ICT Market Time Cycle is a professional trading indicator designed to help traders follow the ICT (Inner Circle Trader) methodology with ease.
It automatically displays the main market sessions (Asia, London, and New York), along with Killzones, Silver Bullet windows, and Macro times directly on your chart. With this tool, you no longer need to calculate session times manually – everything is plotted automatically in a clean and professional

Welcome to Propsense, the best solution for new and veteran traders with a simple FREE strategy! This indicator is a unique and affordable trading tool built on the teachings of a former bank trader. With this tool, you will be able to see inefficient points with ease. As well as this, traders will have an interactive display panel which will show your running and closed P/L in pips AND currency units. It also allows you to set your desired daily target/loss limit! IMPORTANT INFORMATION
Maximi

This all-in-one indicator displays real-time market structure (internal & swing BOS / CHoCH), order blocks, premium & discount zones, equal highs & lows, and much more...allowing traders to automatically mark up their charts with widely used price action methodologies. Following the release of our Fair Value Gap script, we received numerous requests from our community to release more features in the same category. //------------------------------------// Version 1.x has missing functions + PDAr

Chart Patterns Detect 15 patterns (Ascending Triangle, Descending Triangle, Rising Wedge, Falling Wedge, Bullish Flag, Bearish Flag, Bullish Rectangle, Bearish Rectangle Symmetrical triangle, Head and Shoulders, Inverted Head and Shoulders, Triple top, Triple Bottom, Double Top, Double Bottom) Use historical data to calculate the probability of each pattern to succeed (possibility to filter notification according to the chance of success) gives graphic indication about the invalidation level and

PipsZenith Smart Money Momentum Zones (SM-MZ) v1.0 Brand: PipsZenith
Platform: MetaTrader 4 (MT4)
Type: Momentum / Smart Money / Swing Zone Indicator
Version: 1.0 Overview Unlock the secrets of the market with PipsZenith SM-MZ , a revolutionary momentum-based indicator inspired by Smart Money and liquidity concepts . SM-MZ detects areas where momentum accelerates near swing highs and lows—highlighting potential explosive price zones before big market moves. Perfect for traders looking to anticip
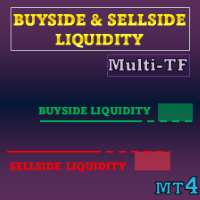
Special offer : ALL TOOLS , just $35 each! New tools will be $30 for the first week or the first 3 purchases ! Trading Tools Channel on MQL5 : Join my MQL5 channel to update the latest news from me This indicator visualizes liquidity levels and liquidity zones based on ICT concepts, plus Liquidity Voids to highlight one-direction price displacements. It focuses on where stop or pending orders tend to cluster and how those areas evolve once price trades through them.
Se
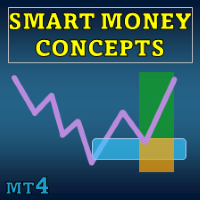
Special offer : ALL TOOLS , just $35 each! New tools will be $30 for the first week or the first 3 purchases ! Trading Tools Channel on MQL5 : Join my MQL5 channel to update the latest news from me SMC is a trading approach that helps traders identify liquidity zones, institutional order placements, and key market turning points. By leveraging SMC principles, traders can navigate the market more effectively, finding optimal entries and exits. The SMC System indicator automates th
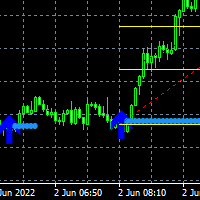
Here is the Double Arrow ArrZZx2 indicator that works best on 5 minutes time frame with Alerts. Good for pairs like NAS100, US30, GER30 and XAUUSD Your buy entry or Sell entry is on the second arrow of the Arr zzz You can confirm your second arrow with Fibonacci retracement levels the 50% level and the 61.8% which is the golden zone The double is good on strong trending markets look for the breakout on the second arrow Look at the screenshots for examples.

EMA Cloud System is a Trading System Invented by Ripster where areas are shaded between two desired EMAs. The concept that the EMA cloud area serves as support or resistance for Intraday & Swing Trading. Can be utilized effectively on 10 Min for day trading and 1Hr/Daily for Swings. Ripster utilizes various combinations of 5-12 EMA clouds 34-50 EMA clouds among others. 8-9, 20-21 EMA clouds can be used as well. Adjust what works for you. Ideally 5-12 or 5-13 EMA cloud acts as sold fluid Trendlin

The principle of the indicator. The StatChannel ( SC ) indicator is a development of the Bollinger Bands indicator ( ВВ ). BB is a moving average, on both sides of which two lines are drawn, separated from it by standard deviations std multiplied by the corresponding coefficient. At the same time, a moving average with an averaging period (2n + 1) bars is always obtained lagging behind n bars. Sliding std is also lagging behind on n bars, also calculated by (2n + 1) points. Such

The principle of constructing indicator lines . Profit Trade indicator is very effective for trading. Profit Trade is a deep development of the well-known Donchian channel indicator. The upper (BlueViolet color) Dup and the lower (IndianRed) Ddn lines of the indicator are constructed in the same way as in the Donchian channel , based on the highest (high of High) and lowest (low of Low) prices for the previous n1 = 20 periods. The middle line (Gold) Dm is constructed in the sam
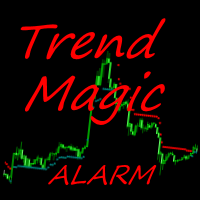
The Trend Magic Alarm shows the direction of a trend and indicates when it changes with a sound, popup window, push or email notice. Blue dots in the chart indicate an uptrend, red dots indicate a downtrend. Levels of former highs + lows give orientation in a chart. Trend Magic Alarm can draw these levels as lines in the chart, see inputs.
Input Parameters Counter : number of bars used for calculation PowerSet : shows how near to the bars the trigger dots are placed DotSize : size of the shown
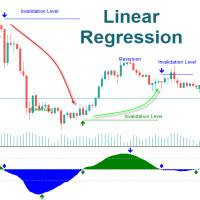
The Linear Regression Oscillator (LRO) is a technical indicator based on linear regression analysis, commonly used in financial markets to assess the momentum and direction of price trends. It measures the distance between the current price and the value predicted by a linear regression line, which is essentially the best-fit line over a specified period. Here’s a breakdown of how it works and its components: Key Components of the Linear Regression Oscillator Linear Regression Line (Best-Fit
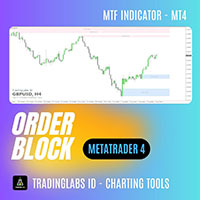
Order Block + Fair Value Gap (FVG) Indicator Multi-Timeframe Order Block + FVG Tool In the ICT (Inner Circle Trader) concept, Order Blocks (OB) + Fair Value Gaps (FVG) are among the most critical areas used by professional traders to read market structure, identify supply & demand zones, and spot high-probability entry points. The Order Block + FVG Indicator automatically detects and displays both Order Block zones and Fair Value Gaps directly on your MT4 charts. With multi-timeframe support, yo

"The Squeeze indicator attempts to identify periods of consolidation in a market. In general the market is either in a period of quiet consolidation or vertical price discovery. By identifying these calm periods, we have a better opportunity of getting into trades with the potential for larger moves. Once a market enters into a "squeeze," we watch the overall market momentum to help forecast the market direction and await a release of market energy." The StdATR Squeeze Channel combines standard

Forex Meter Oscillator is an indicator that can give a whole view of forex market from a single chart, measuring currency strenghts among 28 forex pairs (majors and minors). The "oscillator" word is very meaningful: it normalizes currency strenghts in order to provide values in a predefined range (from -1 to 1).
What are normalization's advantages? It's so simple, values will always be in a pre-defined range that reflect exactly the current value compared to the last N values. In this way you w
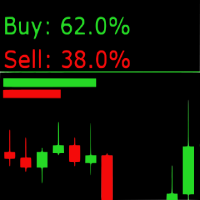
Sentiment Market Indicator: Real-Time Market Sentiment Display The Sentiment Market Indicator is a real-time MQL4 tool that displays current buy/sell sentiment directly on your MetaTrader 4 chart. Designed to support your technical analysis, it provides a visual representation of market positioning to help inform your decision-making process. Key Features Live Sentiment Display
View real-time percentage breakdowns of buy vs. sell sentiment. Customizable Alerts
Set specific thresholds for buy o

This indicator identifies No Demand –No Supply candles to your chart and plots volume bars colored according to the signal. It can be applied to all timeframes or to a specific one only. It can also be used as regular volume indicator but with exceptional future of WEIGHTED VOLUME. Furthermore is has an alert notification, sound and email when a signals occurs. The indicator does not repaint but the alert will come on two candles back due to the definition of No Demand No Supply. The VSA (Volum
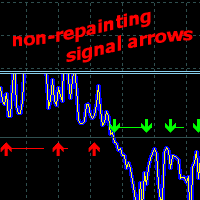
Price Direction Oscillator - indicator designed to detect short- and medium-term market movements. Adaptable to any market and timeframe,
It consists of a trend line, a market volatility oscillator, and a potential trading signal generator.
Indicator Use
It determines the trend based on market volatility and provides signals for opening BUY or SELL orders. Without redrawing its historical data, the signal arrows do not change color and appear at the close of the candle. Following the signal, t

Sniper Entries AI is a powerful, intelligent indicator designed for traders seeking precise entry points at potential market reversals. Leveraging advanced AI algorithms, this tool analyzes price patterns across multiple timeframes, allowing traders to stay informed of trend shifts, no matter the scale of their trades. Key Features of Sniper Entries AI: High-Precision Reversal Signals : The indicator scans market movements to identify precise reversal points and continuation, giving you a compe

The EasyTrend is a seemingly simple but quite powerful trend indicator. Everyone has probably come across indicators or Expert Advisors that contain numerous input parameters that are difficult to understand. Here you will not see dozens of input parameters, the purpose of which is only clear to the developer. Instead, an artificial neural network handles the configuration of the parameters.
Input Parameters The indicator is as simple as possible, so there are only 2 input parameters: Alert - i
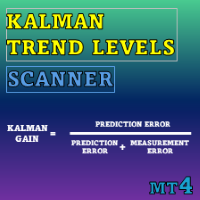
Special offer : ALL TOOLS , just $35 each! New tools will be $30 for the first week or the first 3 purchases ! Trading Tools Channel on MQL5 : Join my MQL5 channel to update the latest news from me Kalman Trend Levels is an advanced trend-following indicator that leverages cutting-edge Kalman filter technology to provide traders with powerful analytical signals. Designed for accuracy and adaptability, this tool not only identifies critical support and resistance zones but also offe
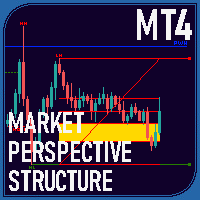
Overview The Market Perspective Structure Indicator is a comprehensive MetaTrader indicator designed to provide traders with a detailed analysis of market structure across multiple timeframes. It identifies and visualizes key price action elements, including swing highs and lows, Break of Structure (BOS), Change of Character (CHOCH), internal structures, equal highs/lows, premium/discount levels, previous levels from higher timeframes, and trading session zones. With extensive customization opt

About:
QQE Dual Pulse is best for people who are using QQE with their existing trading strategies to validate trends. It is an oscillator that combines two QQE calculations with Bollinger Band filtering to identify high-probability trading signals. This indicator helps traders spot momentum shifts and trend changes with reduced false signals.
Detailed description with screenshots is in blog post: https://www.mql5.com/en/blogs/post/763582
What is QQE and QQE Mod?
QQE original: is an enhanced

The We-Spread mt4 indicator is a spread trading tools and it is suitable for those who want to study the markets with a different approach to the contents that are normally available in online trading bookstores. I think the Spread Trading strategy is one of the best I've ever used in the last few years. This is a unique indicator for spread trading because allow you to study till 3 spreads in one time. What is Spread Trading on forex The Spread Trading is the study of the strength of 2 currency

Stop Trading Random Signals. Start Trading with Real Confluence Are you tired of indicators that repaint, give conflicting signals, and leave you more confused than confident? The Quantum Regime Indicator is a professional, standalone trading tool designed for serious traders who demand a systematic edge. It solves the biggest problem in technical analysis— false signals —by using a powerful multi-engine framework. Every signal is confirmed by a confluence of market conditions , ensuring you onl

VWAP Ultimate Pro MT4 – Anchored VWAP | Session VWAP | Dynamic Bands & Smart Alerts Bring Institutional‑Grade VWAP Precision to the Classic MetaTrader 4 Platform
WHY TRADERS CHOOSE VWAP ULTIMATE PRO MT4?
VWAP (Volume‑Weighted Average Price) is the benchmark used by banks, prop desks, and hedge funds to gauge fair value. VWAP Ultimate Pro MT4 delivers that same power to retail traders, optimised for MT4’s architecture while preserving every professional feature you expect. This Indicator is cu
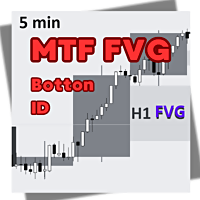
Briefly about FVG mtf btn:
The " FVG mtf btn " indicator is a technical analysis tool that identifies and displays Fair Value Gaps (FVG) on the chart. FVG is an area of price imbalance where the market has moved quickly, leaving a gap between price levels that have not been fully tested by the market. Such gaps often act as areas of interest for traders, as the price tends to return to these areas to "fill" them before continuing to move.
The indicator supports multi-timeframe (MTF) analysi

This indicator presents an alternative approach to identify Market Structure. The logic used is derived from learning material created by DaveTeaches (on X) Upgrade v1.10: add option to put protected high/low value to buffer (figure 11, 12)
When quantifying Market Structure, it is common to use fractal highs and lows to identify "significant" swing pivots. When price closes through these pivots, we may identify a Market Structure Shift (MSS) for reversals or a Break of Structure (BOS) for co
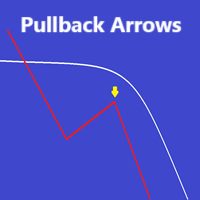
The indicator provides buy and sell arrows with a moving average and bar color based on EMA
Only buy arrows are shown above the moving average and only sell arrows are shown below the moving average
The arrows are based on a reversal algorithm and therefore trying to find the pullback points
Alerts can be activated as preferred
Suitable to any timeframe or instrument of choice
Please test in demo before purchase
Enjoy -----------------------

Descption: The Volume Profile displays detailed informations of historical trading activities at certain price levels (Market Profile). So you can locate the areas with the best prices in the market and get an advantage about other market participants.
Features: Customizable Volume Profile / Market Profile Shows the "fair" Value Area with 70% of all Volume
Shows critical low volume zones
Shows VPOC, VAL and VAH Points Works on all timeframes Also available for MT5 ( https://www.mql5.com/en/mark

AIS Correct Averages indicator allows you to determine the beginning of the trend movement in the market. Another important quality of the indicator is a clear signal of the end of the trend. The indicator is not redrawn or recalculated.
Displayed values h_AE - the upper limit of the AE channel
l_AE - the lower boundary of the AE channel
h_EC - High value projected for the current bar l_EC - Low predicted value for the current bar
Signals for the indicator The main channel signal is the inters

Balance Levels is an easy-to-use trading indicator that provides clear buy and sell signals along with dynamic price levels, helping traders plan their entries and exits with more confidence. The tool is highly flexible – it can be used as a standalone strategy or integrated into any existing trading system. It works on all timeframes and across all markets: Forex, Gold, Indices, Crypto, or Stocks. Balance Levels suits every trading style – from scalping and intraday, to swing trading and even
Enhance your trading precision with the WaveTrend Oscillator Indicator MT4, a momentum-based tool adapted from LazyBear's iconic 2014 TradingView script, renowned for its accuracy in spotting market reversals and momentum shifts. Widely celebrated in the trading community for over a decade, this oscillator combines elements similar to RSI and MACD to detect overbought/oversold conditions, making it a staple for traders in forex, cryptocurrencies, stocks, and commodities. Its popularity stems fro
Enhance your trading edge with the Super Woodies CCI Indicator MT4, an advanced momentum oscillator inspired by Ken Wood's renowned Woodies CCI system, which gained popularity in the early 2000s among day traders for its dual-CCI approach to spotting cyclical patterns and high-probability setups. Widely favored by forex, stocks, and commodities traders, this indicator leverages the Commodity Channel Index (CCI) to detect overbought/oversold conditions, trend continuations, and reversals, with c
The MetaTrader Market is a unique store of trading robots and technical indicators.
Read the MQL5.community User Memo to learn more about the unique services that we offer to traders: copying trading signals, custom applications developed by freelancers, automatic payments via the Payment System and the MQL5 Cloud Network.
You are missing trading opportunities:
- Free trading apps
- Over 8,000 signals for copying
- Economic news for exploring financial markets
Registration
Log in
If you do not have an account, please register
Allow the use of cookies to log in to the MQL5.com website.
Please enable the necessary setting in your browser, otherwise you will not be able to log in.