适用于MetaTrader 4的付费技术指标 - 4

SURE REVERSAL是一种直方图超买/超卖类型的指标,提供关键反转点,表明牛市或熊市的走势 ,该指标是移动平均线与RSI指标的融合,非重绘指标,且不延迟。 参数 : 马周期 马方法 马 价格 确定期(Rsi) 确定价格 (Rsi) ============== -----------------------------------------------------------------------------------------------------------------------------------------------------------------------------------

Gold Scalper Super is an easy-to-use trading system. The indicator can be used as a standalone scalping system on the M1 time frame, as well as part of your existing trading system. Bonus: when purchasing an indicator, Trend Arrow Super is provided free of charge, write to us after purchase. The indicator 100% does not repaint!!! If a signal appears, it does not disappear! Unlike indicators with redrawing, which lead to the loss of a deposit, because they can show a signal and then remove it.

Exclusive Arrival: Presenting for the First Time . This is your secret weapon for predicting which way the wind will blow with the next market shift. It assists you in developing your trading strategy by predicting the direction of the next candle. Compatible with forex, stocks, and cryptocurrencies on all timeframes, but higher timeframes are recommended. MT5 Version - https://www.mql5.com/en/market/product/108937/ How does it work ? It's pretty neat. The algorithm separates green and red can

The Netsrac Supply&Demand Dashboard shows you at a glance where relevant zones are located on your favorite assets. Open your chart directly from the dashboard and trade zones that really matter. Features
Finds the next relevant supply and demand zone and displays the distance to this zone (in pips) Finds and displays the zones in three different timeframes Calculates a trend indicator for the current and past candle for each configured time frame Opens a chart with your chart template directly

SMC Venom 模型 BPR 指標是針對在智慧貨幣 (SMC) 概念內工作的交易者的專業工具。它會自動辨識價格圖表上的兩種關鍵模式: FVG (公平價值缺口)是三根蠟燭的組合,其中第一根和第三根蠟燭之間存在缺口。它在水平之間形成一個沒有成交量支撐的區域,這通常會導致價格調整。 BPR (平衡價格區間)是兩種 FVG 模式的組合,形成一個「橋樑」 - 當價格以低成交量活動移動時,突破並返回到水平的區域,從而在蠟燭之間產生間隙。 這些模式可協助交易者透過分析圖表上的交易量和價格動態(大型市場參與者和普通參與者之間的互動)來識別關鍵的支撐/阻力位、突破區域和切入點。 此指標以矩形和箭頭的形式可視化模式,也支援靈活的警報設定。 主要特點:
模式顯示模式:選擇顯示 BPR 模式(看漲和看跌)或 FVG 模式(看漲和看跌)。 可以隱藏所有圖表分析模式。 以條數過濾:BPR 結構中 FVG 之間的最小/最大距離。
訊號的附加視覺化:
箭頭有 9 種類型可供選擇(標準、細、分形等)或手動輸入 Wingdings 代碼,其表格可以選擇性地顯示在圖表上。 使用 ATR 配置顏色、尺寸及其相對於價格

Attention! Friends, since there have been many scammers on the Internet recently selling indicators called ForexGump, we decided to warn you that only on our page is the LICENSE AUTHOR'S VERSION of the INDICATOR sold! We do not sell this indicator on other sites at a price lower than this! All indicators are sold cheaper - fakes! And even more often sold demo versions that stop working in a week! Therefore, in order not to risk your money, buy this indicator only on this site!
Forex Gump Pro is

SENSE 是一个自动系统,它将选定的 GANN 方法与分形计算相结合。系统会告诉我们在哪里开仓,在哪里平仓。无需再将时间浪费在复杂的计算上 - SENSE 会为您完成一切。只需安装指标即可。
基本原则:
当价格高于白线时,市场看涨
在白线上方买入,在白线下方止损 绿线为上涨目标 当价格低于白线时,市场看跌。
在白线下方卖出,在白线上方止损 红线为下行目标 双绿线或红线表示较强的区域。
为什么是 SENSE?
获利目标: SENSE 自动设置获利目标,帮助您最大限度地提高交易成功率。 自动适应: 该指标可自动重新计算任何时间框架,提供准确可靠的信号,无需手动调整。
非常适合剥头皮交易。
查看演示版!
SENSE 是一个自动系统,它将选定的 GANN 方法与分形计算相结合。系统会告诉我们在哪里开仓,在哪里平仓。无需再将时间浪费在复杂的计算上 - SENSE 会为您完成一切。只需安装指标即可。
基本原则:
当价格高于白线时,市场看涨
在白线上方买入,在白线下方止损 绿线为上涨目标 当价格低于白线时,市场看跌。
在白线下方卖出,在白线上方止损 红线为下行目标
How To Determine If The Market is Strong Or Weak?
Strength Meter uses an Adaptive Algorithm That Detect Price Action Strength In 4 Important Levels! This powerful filter gives you the ability to determine setups with the best probability.
Features Universal compatibility to different trading systems Advance analysis categorized in 4 levels Level 1 (Weak) - Indicates us to WAIT. This will help avoid false moves Weak Bullish - Early signs bullish pressure Weak Bearish - Early signs bearish press

Trend Cutter 是一种趋势指标,可用于任何时间范围,包括 M1 和 M5 等较低时间范围。该指标对于喜欢日内交易的交易者来说是理想的选择,并且对那些喜欢长期交易的交易者也有帮助。您可以使用该指标作为您的交易系统的基础或作为独立的交易解决方案。
该指标提供所有类型的警报,包括推送通知。 指标中有一个易于使用的输入参数,可让您按照您希望的方式调整信号。此选项将为您提供交易的灵活性。 您也可以在任何您想要的市场进行交易。
该指标非常容易使用。您只需遵循信号即可。我还将免费向该指标的所有用户提供附加指标,这将帮助您尽可能高效地使用该方法。 购买后请联系我以获得我的交易提示和丰厚奖金! 感谢您的关注! 祝您交易顺利、盈利!

该指标测量所选时段内牛市和熊市之间的不平衡,并在两点之间显示一条直线。
如果牛市的成交量大于熊市,则该线变为绿色。 如果熊市成交量更大,则为红色。 直线还显示成交量的百分比差异。
该指标在单独的窗口中显示相同的数据。您还可以看到分割后的成交量。
该指标有两种模式。
为此,左上方有一个按钮、
- 如果不按下,它将测量市场任意点与当前价格之间的不平衡。 - 如果按下按钮,则可以测量市场任意两点之间的平衡。
该指标测量所选时段内牛市和熊市之间的不平衡,并在两点之间显示一条直线。
如果牛市的成交量大于熊市,则该线变为绿色。 如果熊市成交量更大,则为红色。 直线还显示成交量的百分比差异。
该指标在单独的窗口中显示相同的数据。您还可以看到分割后的成交量。
该指标有两种模式。
为此,左上方有一个按钮、
- 如果不按下,它将测量市场任意点与当前价格之间的不平衡。 - 如果按下按钮,则可以测量市场任意两点之间的平衡。

Introduction to Fractal Pattern Scanner Fractal Indicator refers to the technical indicator that makes use of the fractal geometry found in the financial market. Fractal Pattern Scanner is the advanced Fractal Indicator that brings the latest trading technology after the extensive research and development work in the fractal geometry in the financial market. The most important feature in Fractal Pattern Scanner is the ability to measure the turning point probability as well as the trend probabi

朋友们好,我很久没有推出能自信地推荐给大家的新产品了,现在这个时刻终于到来了。 这是我的新产品,它基于我的第一个指标,是一个优化了的升级版,专为黄金交易设计,没有多余的设置。我经常被要求制作一些便于交易的工具,但一直未能成功,这并不容易,测试和调试需要花费大量时间。 和前代产品一样,这个指标也有它自己的特点,但在优化过程中的主要目标是使指标更具实用性。 该指标支持发送通知。 使用建议: 交易品种 - XAUUSD (主要,已为其优化) 交易品种 - XAUEUR (次要,未为其优化,但我对结果很满意) 图表周期 - H4。 将指标加载到图表上就不用管它了,不要去动它。 购买信号 - 蓝色箭头。 卖出信号 - 红色箭头。 可以作为寻找入场点的主要来源。 止损 (黄点) - 我建议遵循它们。 使用场景 - 预测下一根K线的方向和收盘价。因此,当收到信号时,应根据您收到信号那根K线的收盘价来确定平仓时间。 止盈 - 是参考性的,但总比没有好。如果您不知道在哪里设置止盈或平仓,请参考最后一根已收盘K线的最高点/最低点。 没有多余的东西。 可用的指标设置: SL

Delta Fusion Pro – 高级订单流分析,专为日内交易设计
Delta Fusion Pro 是一款专业的 MetaTrader 4 指标,能够揭示市场中的主动订单流,实时显示机构压力的强度和方向。与传统的成交量指标不同,它分析买盘(Ask)与卖盘(Bid)之间的成交量差值(Delta),用于提前预测反转、确认趋势并识别专业兴趣区域。 主要特点 智能自动调节系统
根据以下条件自动调整所有参数: 交易品种类型(外汇、加密货币、指数、大宗商品、股票) 操作周期 市场波动率(ATR) 最近平均成交量 无需手动配置,适合新手交易者——指标自动完成校准! 核心功能 净Delta与累计Delta 计算主动买盘/卖盘成交量差值,支持自定义 EMA 平滑 实时显示方向性压力 可自定义直方图颜色(买入/卖出) 价格/成交量背离 自动检测常规与隐藏背离 强度分类:强/中/弱 高级过滤:成交量确认、趋势、时间距离 图形信号(彩色箭头) 市场失衡 识别显著的买盘/卖盘比例失衡(可配置比率) 最小成交量阈值验证 图表显示彩色点(多头/空头) Infusion Volume 检测异常成交量峰值(

This is based on Demark's TD Sequential and TD Combo set of indicators. It mostly has the TD Sequential features. It contains the Arrows Indicator showing Buy/Sell signals and the scanner dashboard. Both are for MT4 (Metatrader 4) Platform.
Read in detail in this blog post. And get extra indicators here: https://www.mql5.com/en/blogs/post/749596 and commentary about signals and how to wait for right time: https://www.mql5.com/en/blogs/post/759157
Feature List: - Set TD Setup (9), Countdown (13

BUY INDICATOR AND GET A PIVOT POINT EA FOR FREE AS A BONUS + SOME OTHER GIFTS! ITALO PIVOTS INDICATOR is the best pivot point indicator for strong price reversals and continuations of price movements ever created , and why is that? You will have for the first time inside a pivot point indicator the pivots above the monthly, so, you will have the 3-month pivot lines, 6 months, 1 year, 2 years, 3 years, 5 years and 10 years, very strong support and resistances. Not only that but for the fi

on demo mode use date to work. on version 13 wave added.13.1 histogram and trigger line can be changeble. wave can be set 200-500. can have different signal on wave 200 on version 14 ema used.so can see mountly chart signals also. up-down indicator is no repaint and works all pairs and all time frames charts. it is suitable also 1 m charts for all pairs. and hold long way to signal. dont gives too many signals. when red histogram cross trigger line that is up signal.and price probably will down

ADX 指标用于确定趋势及其强度。 价格的方向由 +DI 和 -DI 值显示,ADX 值显示趋势的强度。 如果+DI高于-DI,则市场处于上升趋势,如果相反,则市场处于下降趋势。 如果 ADX 低于 20,则没有明确的方向。 一旦指标突破该水平,中等强度的趋势就会开始。 值高于 40 表示强劲趋势(下降趋势或上升趋势)。
平均方向运动指数 (ADX) 指标的多货币和多时间框架修改。 您可以在参数中指定任何所需的货币和时间范围。 此外,当趋势强度水平被交叉时,以及当 +DI 和 -DI 线被交叉时,指标可以发送通知。 通过单击带有句点的单元格,将打开该符号和句点。 这是 MTF 扫描仪。
与货币强度计类似,仪表板可以自动选择包含指定货币的货币对,或以该货币为基础货币的货币对。该指标在“货币对集合”中指定的所有货币对中搜索货币;其他货币对将被忽略。并根据这些货币对计算该货币的总 ADX。您可以看到该货币的强弱程度。
默认情况下,从图表中隐藏仪表板的键是“D”. 您可以将数据从 ADX 仪表板导出到 CSV 文件。该文件将保存到终端文件夹:\MQL4\Files。 数据将根据计时器
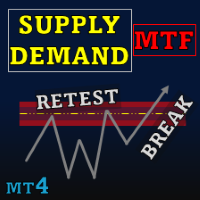
Special offer : ALL TOOLS , just $35 each! New tools will be $30 for the first week or the first 3 purchases ! Trading Tools Channel on MQL5 : Join my MQL5 channel to update the latest news from me Supply Demand Retest and Break Multi Timeframe ,此工具基于强劲的动量蜡烛绘制供需区,允许您使用 timeframe selector 功能在多个时间框架中识别这些区域。通过重新测试和突破标签,以及可自定义的验证和样式选项,此工具支持有效的交易分析。 查看更多 MT5 版本请访问: Supply Demand Retest and Break MT5 Multi Timeframe 查看更多产品请访问: All Products 主要功能 灵活的时间框架选择: 利用时间框架选择器,根据您的交易需求在不同的时

Please contact us after your purchase and we will send you the complimentary indicators to complete the system Cycle Sniper is not a holy grail but when you use it in a system which is explained in the videos, you will feel the difference. If you are not willing to focus on the charts designed with Cycle Sniper and other free tools we provide, we recommend not buying this indicator. We recommend watching the videos about the indiactor and system before purchasing.
Videos, settings and descri
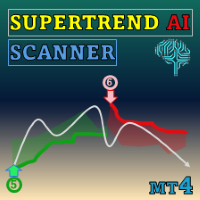
Special offer : ALL TOOLS , just $35 each! New tools will be $30 for the first week or the first 3 purchases ! Trading Tools Channel on MQL5 : Join my MQL5 channel to update the latest news from me 通过 SuperTrend AI Clustering with Scanner ,体验人工智能的强大力量。这款革命性的交易工具适用于 MetaTrader4 (MT4),结合了 K-means 聚类和广受欢迎的 SuperTrend 指标,帮助交易者在趋势和信号中掌握主动。 See more MT5 version at: SuperTrend AI Clustering MT5 with Scanner See more products at: https://www.mql5.com/en/users/ndhsfy/seller
为何此工具独树一帜 虽
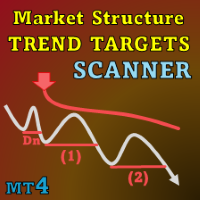
Special offer : ALL TOOLS , just $35 each! New tools will be $30 for the first week or the first 3 purchases ! Trading Tools Channel on MQL5 : Join my MQL5 channel to update the latest news from me I. 介绍
Market Structure Trend Targets Scanner 是一个强大的工具,用于分析市场趋势、识别突破点,并通过动态止损管理风险。通过跟踪之前的高点和低点以确定突破点,这个工具帮助交易者以直观的方式快速识别市场趋势和潜在的反转。 查看更多MT5版本: Market Structure Trend Targets MT5 Scanner 查看更多产品: 所有 产品 II. 主要特点 通过顺序编号识别突破点 清晰区分上升趋势 当价格突破之前的高点,以及下降趋势当价格突破之前的低点。 用入场价标记初始突破 ,而后续的突破标记为(1, 2,

GoldRush 趨勢箭頭信號
GoldRush 趨勢箭頭信號 指標為 XAU/USD 中的高速、短期短線交易者提供精確、實時的趨勢分析。
專為1分鐘時間框架設計,此工具顯示方向箭頭以明確顯示入場點,使短線交易者能在波動市場中自信操作。
該指標包含主要和次要警示箭頭。主要信號為白色和黑色方向箭頭,用於指示趨勢方向的轉變;次要信號為藍色和紅色箭頭,用於確認主要箭頭指示的方向並提示潛在交易入場點。
注意:當趨勢方向發生變化後僅出現一個主要警報箭頭時,請注意可能會出現多個次要藍/紅箭頭。次要信號將在滿足信號標準的任何蠟燭圖後出現,因此在長期趨勢移動中,螢幕上將顯示大量次要箭頭(如附帶的截圖所示)。您可在設置中開啟或關閉任一箭頭類型。
以下是我使用此指標進行交易的方式:
- 對於買入入場,我會耐心等待白箭頭在蠟燭收盤時出現,並在下一根可用蠟燭收盤時出現藍箭頭時進行買入交易。
- 對於賣出入場,我會耐心等待黑箭頭在蠟燭收盤時出現,並在下一根可用蠟燭收盤時出現紅箭頭時進行賣出交易。
- 獲利了結/止損設置由使用者自行負責,但我個人使用最低R:R為1:2,並發現這在倫敦/紐約開盤等

介绍 量子趋势狙击指标 ,突破性的 MQL5 指标,正在改变您识别和交易趋势反转的方式!由拥有超过13年交易经验的资深交易员团队开发, 量子趋势狙击指标 旨在通过其创新的方式以极高的准确度识别趋势反转,将您的交易之旅推向新的高度。
***购买量子趋势狙击指标,即可免费获得量子突破指标!***
当量子突破指标识别出趋势反转时,它会向您发出警报和信号箭头,并建议您三个止盈水平。
它既适合新手交易者,也适合专业交易者。
量子 EA 通道: 点击这里
MT5版本: 点击这里
建议:
时间范围: 所有时间范围。为了获得最佳结果,我们建议在 M15、M30 和 H1 时间范围内使用它。 货币对:欧元兑美元、英镑兑美元、澳元兑美元、欧元兑英镑, EURAUD, XAUUSD 账户类型:ECN、Raw 或 Razor,点差极低 经纪时间:任意 经纪商:IC Markets、Pepperstone with Raw 和 Razor 的点差最低
建议止损:50 点
建议止盈水平:20 点、50 点和 100 点
规格:
不重漆! 最多

Dark Support Resistance is an Indicator for intraday trading. This Indicator is programmed to identify Support and Resistance Lines , providing a high level of accuracy and reliability.
Key benefits
Easily visible lines Only the most important levels will be displayed Automated adjustment for each timeframe and instrument Easy to use even for beginners Never repaints, never backpaints, Not Lag 100% compatible with Expert Advisor development All types of alerts available: Pop-up, Email, Push

Advanced Reversal Hunter Pro (ARH) is a powerful, innovative volatility-based momentum indicator designed to accurately identify key trend reversals. Developed using a special algorithm that provides a clear construction of the average volatility range, without redrawing its values and does not change them. The indicator adapts to any market volatility and dynamically adjusts the width of the band range, depending on current market conditions. Indicator advantages: Advanced Reversal Hunter Pro

Trading System Double Trend - 个由多个指标组成的独立交易系统。它能够判断总体趋势,并发出价格变动方向的信号。
可用于剥头皮交易、日内交易或周内交易。
功能
适用于任何时间框架和交易工具(外汇、加密货币、贵金属、股票、指数)。 信息直观易读,无需加载图表 指标不会重绘,也不会完成信号 仅在 K 线收盘时生效 提供多种信号提醒类型 直观易懂,只需将其附加到图表上并遵循信号的简单建议即可。
系统中每个趋势的输入参数均可配置。
General trend - 判断总体趋势 Signal trend - 发出入场和出场信号。 Play sound / Display pop-up message / Send push notification / Send email - 出现信号箭头和止损时使用提醒。 Sound for signals - 信号声音文件。
使用方法
General trend - 浅绿色线,如果高于价格 - 趋势为下行;如果低于价格 - 趋势为上行。当趋势发生变化时,会出现信号箭头。
Signal trend - 跟随价格走势的

Introducing the Delta Volume Profile Indicator - Unleash the Power of Institutional Precision! Technical Indicator: Are you ready to trade like the pros? The Delta Volume Profile Indicator is no ordinary tool. It’s a high-precision, cutting-edge indicator that puts the power of institutional-grade trading in your hands. This unique indicator analyses delta volume distribution in real-time, revealing the market's hidden buy/sell imbalances that the biggest financial institutions rely on to antic

Reversal Pattern AI is a groundbreaking advancement in indicator development, combining artificial intelligence algorithms, multi-level market analysis, and classical technical analysis methods. It not only detects reversal patterns but also evaluates market inefficiencies, generating highly accurate trading signals.Thanks to its hybrid model, which utilizes price action analysis, volume, volatility, VWAP, and Volume AVG %, the indicator easily adapts to any market conditions. Reversal Pattern A

FOTSI is an indicator that analyzes the relative strength of currencies in major Forex pairs. It aims to anticipate corrections in currency pairs following strong trends by identifying potential entry signals through overbought and oversold target areas. Theoretical Logic of Construction: Calculation of Individual Currency Momentum: FOTSI starts by calculating the momentum for each currency pair that includes a specific currency, then aggregates by the currency of interest (EUR, USD, GBP, CHF,

Elliott Wave Trend was designed for the scientific wave counting. This tool focuses to get rid of the vagueness of the classic Elliott Wave Counting using the guideline from the template and pattern approach. In doing so, firstly Elliott Wave Trend offers the template for your wave counting. Secondly, it offers Wave Structural Score to assist to identify accurate wave formation. It offers both impulse wave Structural Score and corrective wave Structure Score. Structural Score is the rating to sh

Future Trend Channel 是一款动态直观的趋势指标,专为识别趋势方向和预测潜在价格走势而设计。该工具最初由ChartPrime为TradingView开发,现已适配MetaTrader 4平台,为交易者提供同等强大的功能。无论您是波段交易者、日内交易者还是长线投资者,Future Trend Channel都能帮助您直观判断趋势强度、预判反转时机并优化进出场点位。 主要特点
• 全周期兼容 - 适用于所有时间周期和金融品种,包括外汇、股票、大宗商品和加密货币
• 智能趋势检测 - 结合SMA、ATR和HL2(高低均价)动态绘制多空趋势通道
• 未来价格预测 - 根据当前趋势斜率投射潜在价格区间,辅助交易规划
• 清晰视觉信号 - 多空信号标记趋势确认,色码通道随市况自动调整
• 可调参数 - 可自定义通道长度、宽度和未来价格索引值以匹配交易策略
• 无重绘 - 所有信号和通道实时计算且绝不重绘,确保回测和实盘可靠性
• 轻量高效 - 经过优化不会拖慢MT4平台运行速度 参数设置
Trend Length(趋势长度) - 调整SMA周期以改变趋势灵敏度
Channel W

Dark Breakout is an Indicator for intraday trading. This Indicator is based on Trend Following strategy, providing an entry signal on the breakout. The signal is provided by the arrow, which confirms the breaking of the level. We can enter in good price with this Indicator, in order to follow the main trend on the current instrument. It is advised to use low spread ECN brokers. This Indicator does Not repaint and N ot lag . Recommended timeframes are M5, M15 and H1. Recommended working pairs

ICT,SMC,智能货币概念,支撑和阻力,趋势分析,价格行为,市场结构,订单区块,突破区块,动量转变,强大的不平衡,HH/LL/HL/LH,公允价值差距,FVG,溢价和折扣区域,斐波那契回撤,OTE,买方流动性,卖方流动性,流动性空白,市场交易时间段,NDOG,NWOG,银弹,ICT模板。 在金融市场中,准确的市场分析对于投资者来说至关重要。为了帮助投资者更好地理解市场趋势和流动性,我们提供了一份使用教程,旨在实现高级市场分析功能。以下是一些功能的简要介绍和实现方法: 1. 显示高时间框架市场结构: 通过设置参数,您可以在图表上显示高时间框架市场结构。这将帮助您更好地理解市场的整体走势和结构。您可以根据自己的需求设置时间周期,并在图表上显示市场结构。 2. 显示流动性: 流动性是市场的重要指标之一。通过设置参数,您可以在图表上显示买方和卖方的流动性。您可以自定义文本和颜色,以便更好地识别不同的流动性水平。您还可以选择显示伦敦AM会话和纽约午餐时间的流动性。 3. 显示公平价值差距: 公平价值差距是指市场价格与公平价值之间的差异。通过设置参数,您可以在图表上显示公平价值
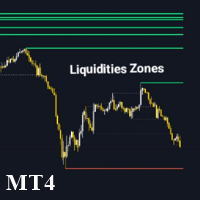
Liquidity Zone Detector 是一款高级技术指标,旨在通过使用 ZigZag 指标来识别和标注市场中的关键流动性区域。该工具通过在 ZigZag 检测到的高点和低点绘制趋势线来定位可能存在显著流动性的价格水平。Liquidity Zone Detector 帮助交易者根据流动性的累积或释放发现潜在的反转或趋势延续区域。 主要特点: 自动识别流动性区域 :在 ZigZag 指标识别的高点和低点绘制趋势线。 高级定制 :可配置流动性线的颜色、厚度和样式。 动态颜色变化 :当流动性水平被突破时,可选择更改线条颜色。 可调 ZigZag 参数 :调整 ZigZag 的深度、偏差和回溯步长以获得更精确的检测。 Liquidity Zone Detector 是分析市场结构并识别可能发生显著价格变动的关键区域的交易者的必备工具。

The indicator automatically identifies the 1-2-3 pattern on the chart. The indicator is able to monitor the formation of pattern in real time. It informs the trader when the pattern is completely formed (when the price breaks the line in point 2) and displays the completed patterns in history. The patterns are never redrawn. The indicator can identify patterns on any instruments (currency pairs, stock market, gold, etc.) without the need to adjust to each instrument. Simple and clear visualizati

Scalping monster - ready trading system in the form of an indicator. Scalping monster is designed for the Metatrader4 platform. When placed on a forex chart, the indicator automatically analyzes the market using an adaptation algorithm and displays the signals to the trader in the form of red and blue dots. The indicator also shows in the upper right corner information about potential profit / loss.
Our other products at https://www.mql5.com/en/users/master-mql4/seller
How to trade using S

多货币和多时间范围指标 Inside Bar (IB)。 在参数中,您可以指定任何所需的货币和时间范围。 该面板显示最后找到的内部柱线(和母柱线)形态、当前价格位置以及母线和内部柱线水平的突破。 您可以设置单元格中的条形和文本的大小和颜色。 当水平被突破时,该指标还可以发送通知。 通过单击带有句点的单元格,将打开指定的交易品种和句点。 这是 MTF 扫描仪。
默认情况下,从图表中隐藏仪表板的键是“D”.
参数 How long pattern will be valid after first breakout (bars) — 信号将在单元格中显示多少柱 IB body must be inside of the MB body - IB 主体必须位于 MB 主体内部。 IB body and wicks must be inside the MB body - IB 主体和灯芯必须位于 MB 主体内。 If MB is IB, choose the next MB — 如果找到的母柱是前一个信号的内柱,则将显示前一个信号。 MB body must be large tha
CISD (Change In State Delivery) Indicator TradingLabs ID – ICT Concept Tool The Change In State Delivery (CISD) Indicator is designed based on the ICT (Inner Circle Trader) concept, where price transitions from one delivery state to another often signal high-probability trade opportunities. This tool automatically detects and marks CISD levels on your MT4 charts, helping traders identify potential breakout and retest zones with great accuracy. It is especially useful for traders applying Smart

The indicator defines a trading corridor, a flat market, and corrections.
Allows you to compare the significance of different flat and trend areas (by time of existence and by volatility). This makes it possible to assess the market cycle and its mood at a glance.
That is, how long does the flat last on average, and how long is the trend and what kind of volatility they have in points.
As a rule, the longer the flat lasts, the more likely it is to accumulate the potential for a strong movem

ICT 亚洲区间指标 是一款功能强大的工具,旨在帮助交易者根据 ICT 亚洲区间交易策略识别关键市场结构和流动性区域。它标记了亚洲交易时段(纽约时间晚上 7 点至午夜)的最高价和最低价,并为接下来的交易时段的市场走势提供了重要见解。该指标通过突出流动性扫荡和公允价值缺口 (FVG) 来提高交易准确性,使其成为 ICT 交易者必不可少的工具。
为什么亚洲范围如此重要? 亚洲交易时段为后续交易时段的价格走势奠定了基础。了解这一范围可让交易者预测市场情绪、找到流动性区域并制定战略性交易入场和出场。
ICT 亚洲指数的主要优势及使用方法 ICT 亚洲区间指标为交易者提供早期市场洞察,帮助他们在伦敦和纽约交易时段开始前预测每日趋势和情绪。通过识别流动性定位,该指标突出了机构交易者可能进入或退出头寸的区域,从而更深入地了解市场行为。该指标还有助于预测波动性和潜在突破点,让交易者为即将到来的交易时段的价格变动做好准备。此外,它还是一种有价值的风险管理工具,为止损和止盈设置提供了明确的参考点,从而降低了整体交易风险。
要有效使用 ICT 亚洲区间指标,交易者首先应确定亚洲区间,即交易时段内
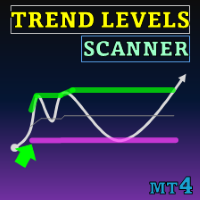
Special offer : ALL TOOLS , just $35 each! New tools will be $30 for the first week or the first 3 purchases ! Trading Tools Channel on MQL5 : Join my MQL5 channel to update the latest news from me 趋势水平 (Trend Levels) 指标精心设计,帮助在市场波动中确定关键的趋势水平——高、中、低。在自定义回溯期内基于最高、最低和中位值的实时计算,该工具为交易者提供了关于趋势动态和强度的结构化视图,帮助他们做出精确的交易决策。 查看更多 MT5 版本: Trend Levels MT5 查看更多产品: 所有产品 趋势水平指标的主要特点及使用方法 趋势变化信号 该指标通过追踪选定输入周期内的最高和最低值来识别趋势变化。当当前的最高值达到最大值时,指标显示上升趋势;相反,当当前的最低值达到最低水平时,显示下降趋势。这些趋势变化会在图表上以视觉方式呈现,帮助交易者
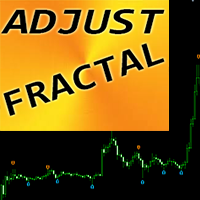
“可调分形” - 是分形指标的高级版本,非常有用的交易工具! .......................................................................................... - 众所周知,标准分形 mt4 指标根本没有设置 - 这对交易者来说非常不方便。 - 可调分形解决了这个问题 - 它具有所有必要的设置: - 指标的可调周期(建议值 - 高于 7)。 - 价格高点/低点的距离可调。 - 可调分形箭头设计。 - 指标内置移动和 PC 警报。 点击这里查看高质量的交易机器人和指标! 这是仅在此 MQL5 网站上提供的原创产品。 ....................................................

FX Levels:适用于所有市场的高精度支撑与阻力 快速概览
想要精准确定适用于任何市场(外汇、指数、股票或大宗商品)的支撑与阻力吗? FX Levels 将传统的“Lighthouse”方法与前沿的动态分析相结合,实现近乎通用的准确性。依托真实经纪商经验和自动化的每日与实时更新, FX Levels 帮助您捕捉价格反转点、设置合理的盈利目标,并自信地管理交易。立即使用,体验更准确的支撑/阻力分析如何助力您的交易更上层楼!
1. 为什么 FX Levels 对交易者非常有利 极度精准的支撑 & 阻力区
• FX Levels 专为不同经纪商提供的行情源和时间设置而设计,可生成几乎相同的价位区,解决数据不一致的常见问题。
• 这意味着无论您在哪里交易,都能获得稳定一致的水平线,为策略打下更加牢固的基础。 结合传统与先进技术
• 通过将久经考验的“Lighthouse”方法与动态分析相融合, FX Levels 不仅限于每日刷新,还可针对新的价格波动进行即时更新。
• 您可以选择经典的静态方式,或实时捕捉新出现的水平,以贴近最新的市场行为。 识别清晰的反转点
• FX Lev
** All Symbols x All Time frames scan just by pressing scanner button ** After 18 years of experience in the markets and programming, Winner indicator is ready. I would like to share with you! *** Contact me to send you " Trend Finder indicator " free, instruction and add you in "M1 Signal Scanner group" for sharing or seeing experiences with other users. Introduction: M1 Signal Scanner is the indicator designed scalping M1 time frame to detect Small trend switching in the direction

Pipfinite creates unique, high quality and affordable trading tools. Our tools may or may not work for you, so we strongly suggest to try the Demo Version for MT4 first. Please test the indicator prior to purchasing to determine if it works for you. We want your good reviews, so hurry up and test it for free...we hope you will find it useful.
Combo Razor Scalper with Trend Laser Strategy: Scalp in the direction of the trend Watch Video: (Click Here)
Features Scalping indicator using a confirme

布林带指标的多货币和多时间框架修改。 在仪表板上,您可以看到布林带的突破和触及。 在参数中,您可以指定任何所需的货币和时间范围。 当价格触及布林线、当前波动率发生变化(扩大或下跌)以及价格触及所有布林线时,该指标还可以发送通知。 通过单击带有句点的单元格,将打开该符号和句点。 这是 MTF 扫描仪。
默认情况下,从图表中隐藏仪表板的键是“D”.
参数 Bollinger Bands Settings Averaging period — 计算指标的平均周期。 Standard deviations — 与主线的标准差数。 Bands shift — 指标相对于价格图表的移动。 Applied price — 用于计算的价格。 Show BB on the current chart — 在当前图表上显示 BB
仪表板 Clear the chart at startup — 启动时清除图表。 Set of Pairs — 符号集 — Market Watch — 来自 MT 的“市场观察”的货币对。 — Specified manually — 在参数“Pairs”中手动指定对

比特币预测器是一个基于箭头的指标,旨在预测价格反转。 此工具可与 BTC 和其他加密货币一起使用。它也可以与货币一起使用。但是您需要首先检查哪些配对最有效。一些配对和时间框架可以工作得非常好。您可以自由测试并自己查看。 该指标非常易于使用。所有你需要的是按照箭头。该指标可以作为独立系统工作,也可以作为您已经在使用的任何系统的一部分。购买后我将与您分享我的交易建议和奖金指标! 指示信号可以很容易地调整。您可以使指标算法适应任何时间范围,以及加密货币以外的其他货币对。 信号不要重绘!无论您目前拥有何种级别的交易经验,该交易指标都会对您有所帮助。 购买后请联系我!我将与您分享我的交易建议和奖金! 感谢您对我的指标的关注和兴趣!
** All Symbols x All Timeframes scan just by pressing scanner button ** Discount: The price is $50$, But now it is just $39, Limited time offer is active.
*** Contact me to send you instruction and add you in "Trend Reversal group" for sharing or seeing experiences with other users. Introduction: Trendlines are the most famous technical analysis in trading . Trend lines continually form on the charts of markets across all the different timeframes providing huge opportunities for trader

SMT (Smart Money Technique) Divergence refers to the price divergence between correlated assets or their relationship to inversely correlated assets. By analyzing SMT Divergence, traders can gain insights into the market's institutional structure and identify whether smart money is accumulating or distributing assets. Every price fluctuation should be confirmed by market symmetry, and any price asymmetry indicates an SMT Divergence, suggesting a potential trend reversal. MT5 Version - https:/

Use with disciplined risk management. Fibonacci entry system based on the golden zone 38.2 - 61.8 where the entry is confirmed at 23.6 with indications of Take Profit 3:1. Automatically plotted Fibonacci contains retracement and expansion Fibonacci in a single indicator. Up to 77% win rate with this system. FTMO challenge pass with 0.50% risk and 1.50% R:R.
SL Curruncy impulse https://www.mql5.com/en/market/product/82593 SL Session Strength 28 Pair flow of this intraday Asian London New York Sessions strength.SL Session Strength 28 indicator best for intraday scalper. market powerful move time you can catch best symbol. because you'll know which currencies are best to trade at that moment. Buy strong currencies and sell weak currencies (Diverging currencies). Suggested timeframes to trading : M5 - M15 - M30 - You can however just change session

Dark Oscillator is an Indicator for intraday trading. This Indicator is based on Counter Trend strategy, trying to intercept changes in direction, in advance compared trend following indicators. We can enter in good price with this Indicator, in order to follow the inversion of the trend on the current instrument. It is advised to use low spread ECN brokers. This Indicator does Not repaint and N ot lag . Recommended timeframes are M5, M15 and H1. Recommended working pairs: All. I nst

The Reversal Master is an indicator for determining the current direction of price movement and reversal points. The indicator will be useful for those who want to see the current market situation better. The indicator can be used as an add-on for ready-made trading systems, or as an independent tool, or to develop your own trading systems. The Reversal Master indicator, to determine the reversal points, analyzes a lot of conditions since the combined analysis gives a more accurate picture of t
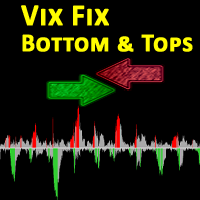
The VIX Fix is a volatility indicator developed by renowned trader Larry Williams. It's designed to measure volatility in assets that don't have options or futures, such as individual stocks and forex markets. Essentially, it acts as a synthetic VIX (Volatility Index) for any asset , providing a gauge of market uncertainty. This modified version of William's indicator helps you to find market bottoms and market tops. It comes with 2 styles: Stochastic and histogram style. Please see screenshot

俄语说明 / 英文 说明 - MT5 版本 主要功能: 显示卖家和买家的活跃区域! 该指标显示所有正确的买入和卖出的初始脉冲水平/区域。当这些水平/区域被激活时,即开始寻找入场点的位置,水平线会改变颜色,并填充特定颜色。此外,还会显示箭头,以便更直观地了解情况。 LOGIC AI - 激活模板时显示用于搜索入口点的区域(圆圈) 为了提高视觉清晰度,添加了使用人工智能搜索入口点的显示区域的功能。 显示更高时间范围内的级别/区域(MTF 模式) 新增使用更高时间间隔显示级别/区域的功能。此外,该指标还具有自动趋势检测功能 ( TPSproTREND PRO )。 独立的专业分步交易算法 该算法专为顺势和逆势的日内交易而设计。每个活动模板均提供详细的说明。 适用于不同的时间范围 TPSpro RFI 水平指标可用于图表上的任何时间间隔,从分钟(M1)到每月(MN)。 图形和声音警报 该指标提供图形和声音提示,让您不会错过交易信号。 此外,还支持手机通知。 简单有效的活性模板扫描器 这是一个非常紧凑的主动模式扫描仪,当在一个方向上的所有时间间隔内激活模式时,它会自动发出警报并

This multicurrency strategy simultaneously determines the strength of the trends, entry points and the take profit levels for each trade. The indicator can determine entry points on any trading period from M1 to D1. For the convenience of users, the indicator renders the entry point (in the form of an arrow), recommended take profit levels (TP1, TP2, TP3) and the recommended stop loss level (SL1, SL2). The options for using the strategy are described below. Full description of the indicator Cosm

或 M oving 一个 verage 小号 upport [R esistance 带 。
MASR Bands 指标是一条移动平均线,由两条带共同作为支撑位和阻力位。据统计,MASR 波段 93% 的时间都包含价格蜡烛。以下是分步计算的方法: 1. 第一步是计算 X 时间段内的最高价 (HHV) 和最低价 (LLV)。
2. 第二步是用HHV除以LLV,得到它们之间的距离有多宽的百分比。我称这一步的结果为 MASR Filter。
3. MASR 过滤器 = 总和 ((HHV / LLV)-1) / 柱数
4. 我将上带称为 MAR,这是移动平均阻力的捷径。我将下频带 MAS 称为移动平均线支持的捷径。波段之间的移动平均线称为中心线。
5. MAR = MASR 中心 + (75% x MASR 过滤器 x MASR 中心)
6. MASR 中心是移动平均线。
7. MAS = MASR 中心 - (75% x MASR 过滤器 x MASR 中心)
重要链接
MASR 工具手册: https://www.mql5.com/en/blogs/post/721889

High Low Cloud Trend指标是一种基于通道的技术分析工具,通过自适应价格边界识别趋势方向和均值回归机会。该系统通过计算指定回溯期内的最高高点和最低低点来运作,创建定义整体价格区间的外部通道边界。次级内部通道使用较短周期(主回溯期的四分之一)来捕捉更广泛区间内更即时的价格波动。该指标的核心逻辑通过将收盘价与参考值进行比较来确定趋势方向,该参考值根据价格触及这些极值的位置在最高点和最低点之间翻转 - 当价格触及最低低点时,参考值切换到最高高点,反之亦然。这创建了一个二元趋势状态,指标以填充直方图或线条的形式显示下通道(上升趋势)或上通道(下降趋势)。均值回归检测机制识别特定的交叉模式,即价格在触及外部边界后向内部通道回移,生成指向潜在反转入场点的箭头信号。双时间框架通道方法结合基于翻转的趋势逻辑,使该指标在区间震荡市场中特别有效,同时仍能捕捉趋势性走势,并为趋势变化和均值回归设置提供可自定义的警报。
沉浸在适应性与精确性相结合的交易环境中。Dynamic Grid Pro v1.7 提供一套旨在优化您市场交易方法的工具。 该系统的开发旨在为网格交易策略的执行提供一个灵活的框架。其核心功能在于能够根据不断变化的市场条件动态调整网格参数。 Dynamic Grid Pro v1.7 的特点: 动态网格: 系统根据波动性和价格变动自动调整网格水平,旨在优化订单执行。 订单管理: 允许精确控制网格内订单的下单和管理,提供多种配置选项。 多种入场策略: 集成不同的订单入场方法,为实施您的策略提供灵活性。 可自定义设置: 提供广泛的可调参数,以使系统适应您的偏好和交易风格。 信息面板: 显示有关网格和仓位的相关数据,方便监控和决策。 MetaTrader 集成: 旨在 MetaTrader 平台内无缝运行,充分利用其功能和工具。 Dynamic Grid Pro v1.7 致力于成为您交易旅程中的盟友,提供有条不紊且适应性强地实施和管理网格策略所需的资源。探索其功能,了解它如何融入您的工作流程。

- Real price is 2000$ - 50% Discount (It is 99$ now) - It is enabled for 5 purchases. Contact me for extra bonus (Gann Trend indicator), instruction or any questions! - Non-repaint, No lag - I just sell my products in Elif Kaya Profile, any other websites are stolen old versions, So no any new updates or support. - Lifetime update free Gann Gold EA MT5 Introduction W.D. Gann’s theories in technical analysis have fascinated traders for decades. It offers a unique approach beyond traditional

"THE ULTIMATE TRADING SECRET - UNLOCK PROFITS FAST!" A new trading system. An amazing trading indicator. Bonus: You get the Forex Trend Commander Indicator absolutely free!
Most traders waste months chasing strategies and endless charts - only to miss opportunities and second-guess themselves.
Here’s the secret: You don’t need to struggle. You don’t need years of training. All you need is the right tool - one that shows you exactly when to buy and sell, every single time.
Introducing ProTrad

Divergence and Convergence are important harbingers of reversals in stock markets.
The Divergence Sync indicator is designed to automatically search for divergences on a large number of indicators with different parameters.
The search for divergences is carried out on these indicators: (CCI, CHO, DeMarker, MACD, MFI, Momentum, OBV, OsMA, RSI, Stochastic, WPR, Awesome Oscillator ).
To search for divergences, you can use one technical indicator or search simultaneously on any number of indicator

Description
SuperCCI is an indicator based on the standard CCI indicator. It identifies and displays convergences/divergences in the market and forms the corresponding entry points. Also, using the trading channel index, it determines the direction of the trend and displays the levels of support and resistance .
Features Not repaint. Shows entry points. Shows the direction of the current trend and support/resistance levels. Has notifications. Recommendations
Use convergence/divergence to ide

Algo Trading Indicaor
With this indicator , you’ll have zones and trends that hight probability the price will reverse from it. so will gives you all the help that you need
Why should you join us !? 1-This indicator is logical since it’s working in previous days movement , to predict the future movements.
2-Algo trading indicator will help you to draw trends which is special and are too strong than the basics trend , trends will change with the frame time that you work on .
3-We can use

KT MACD Alerts 是 MetaTrader 中标准 MACD 指标的个性化实现。它在以下两个重要事件发生时提供提醒并绘制垂直线,以帮助交易者更轻松地识别交易信号: 当 MACD 指标向上穿越零轴线时。 当 MACD 指标向下穿越零轴线时。
功能亮点 内置多周期扫描器,可在所有时间周期中显示 MACD 的方向变化,帮助交易者实现多周期共振分析。 非常适合关注 MACD 穿越零线交易信号的趋势跟随型交易者。 除了提供声音、图表、邮件等提醒方式外,还会在图表上绘制清晰的垂直线,方便快速定位交叉点。 本指标采用轻量级代码编写,占用资源少,运行流畅不卡顿。 全面支持 MetaTrader 的所有默认提醒系统,适用于不同交易场景。
MACD 的由来与发展 MACD,全称为移动平均收敛背离指标(Moving Average Convergence Divergence),是一种经典的技术分析工具,广泛用于分析股票、外汇和加密货币等市场。由 Gerald Appel 在1970年提出,MACD 能有效识别趋势的变化、强度与持续时间,是交易者不可或缺的趋势型指标之一。
Order Block Tracker is here to solve one of the biggest challenges traders face: identifying order blocks. Many traders fail to spot these critical zones, often missing out on key market entries. But with Order Block Tracker , you no longer have to worry about that. This advanced indicator automatically highlights these crucial zones for you, giving you the confidence to enter the market at the right time. MT5 Version - https://www.mql5.com/en/market/product/123362/ Key Features of Order Block

FVG 区域指标是一种强大的工具 ,旨在识别市场中的公允价值缺口 (FVG),突出公允价值和市场价格之间的价格不平衡。这种对缺口的精确识别使交易者能够发现潜在的市场进入点和退出点,从而大大增强他们做出明智交易决策的能力。
FVG 区域指标具有直观且用户友好的界面,可自动扫描图表中的公允价值缺口,并在价格图表上实时标记这些区域。这使交易者能够快速轻松地识别可能预示即将到来的价格调整或趋势延续的潜在价格不平衡。
主要功能包括: 实时缺口检测 :自动识别并标记出现的 FVG。 以点为单位显示缺口大小 :该指标以点为单位显示每个已识别缺口的大小,帮助交易者了解缺口的重要性。 与当前价格的点差 :即时计算并显示当前价格与已识别的公允价值缺口之间的点差。 清晰的可视化: 视觉上不同的 FVG 区域采用颜色编码以便快速参考,帮助交易者专注于关键市场领域。
无论您是经验丰富的交易者还是技术分析新手,FVG 区域指标都能提供对市场价格不平衡的重要见解,帮助您准确而自信地完善交易策略。
参数 缺口参数 缺口填补检测百分比 - 设置将缺口视为已填补的百分比 以点为单位显示缺口 - 启用或禁用以点为
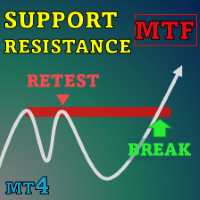
Special offer : ALL TOOLS , just $35 each! New tools will be $30 for the first week or the first 3 purchases ! Trading Tools Channel on MQL5 : Join my MQL5 channel to update the latest news from me 在瞬息万变的金融交易领域,准确识别和分析支撑与阻力位对于做出明智的投资决策至关重要。 SnR Retest and Break Multi-Timeframe 是一个支撑与阻力指标,旨在增强您的交易分析。利用创新的 Timeframe Selector 功能,该工具提供了多个时间框架下的市场动态全面视图,帮助您做出精确的交易选择。 查看更多 MT5 版本请访问: SnR Retest and Break MT5 Multi Timeframe 查看更多产品请访问: All P roducts 主要功能 SnR Retest and Break Multi-Time

The Simple ICT Concepts Indicator is a powerful tool designed to help traders apply the principles of the Inner Circle Trader (ICT) methodology. This indicator focuses on identifying key zones such as liquidity levels, support and resistance, and market structure, making it an invaluable asset for price action and smart money concept traders. Key Features Market Structure : Market structure labels are constructed from price breaking a prior swing point. This allows a user to determine t

The Silent Edge of Smart Money
"It's not about how much you do, but how much love you put into what you do that counts." – Mother Teresa
They say the real money in trading is made in the shadows—where inefficiencies hide and only the most perceptive capitalize. That’s exactly where the Arbitrage Thief Index (ATI) thrives. For years, this tool has been my personal advantage , silently identifying low-risk, high-reward trades before the crowd even notices. It’s the kind of edge top fund managers
MetaTrader 市场 - 在您的交易程序端可以直接使用为交易者提供的自动交易和技术指标。
MQL5.community 支付系统 提供给MQL5.com 网站所有已注册用户用于MetaTrade服务方面的事务。您可以使用WebMoney,PayPal 或银行卡进行存取款。
您错过了交易机会:
- 免费交易应用程序
- 8,000+信号可供复制
- 探索金融市场的经济新闻
注册
登录