MetaTrader 4용 유료 기술 지표 - 4

VeMAs는 거래량 역학 및 시장 구조를 분석하여 트레이딩 전략을 개선하도록 설계된 혁신적인 트레이딩 도구입니다. 초보자이든 숙련된 트레이더이든 VeMAs는 우위를 점할 수 있게 해줍니다. VeMAs 인디케이터는 단 $50 에 구입할 수 있습니다 . 인디케이터의 원래 가격은 299 달러입니다 . 기간 한정 혜택 . 구매 후 저에게 연락하여 맞춤형 보너스를 받으세요 ! VeMAs 인디케이터를 멀티 타임프레임으로 만드는 멋진 유틸리티 (VeMAs 유틸리티 MTF) 를 무료로 받으실 수 있으니 비공개 메시지를 보내주세요 !
Version MT5
Here are some blogs on the VeMAs indicator
시장 규모와 구조는 주목해야 할 몇 가지 주요 사항 중 일부입니다.
VeMAs는 고급 알고리즘을 사용해 거래량 변화와 가격 변동을 평가합니다. 정확성과 효율성을 추구하는 트레이더를 위해 설계되었습니다. 이 지표는 자산의 거래량 가격의 움직임을 분석하고 이상적인 진입

자동화된 수요 및 공급 구역의 차세대. 모든 차트에서 작동하는 새롭고 혁신적인 알고리즘. 모든 구역은 시장의 가격 움직임에 따라 동적으로 생성됩니다.
두 가지 유형의 경고 --> 1)가격이 영역에 도달할 때 2)새로운 영역이 형성될 때
당신은 더 이상 쓸모없는 지표를 얻을 수 없습니다. 입증된 결과로 완벽한 거래 전략을 얻을 수 있습니다.
새로운 기능:
가격이 공급/수요 영역에 도달하면 경고
새로운 공급/수요 구역이 생성되면 알림
푸시 알림 알림
핍의 영역 너비 레이블
기동특무부대에 한 번 더 시간이 주어집니다. 따라서 현재보다 위의 2개의 시간 프레임 대신 현재보다 높은 3개의 시간 프레임을 볼 수 있습니다.
Alerts/Zones/MTF 기능을 활성화/비활성화하는 버튼
당신이 얻는 이점:
거래에서 감정을 제거하십시오.
거래 항목을 객관화하십시오.
높은 확률 설정을 사용하여 수익

ADR 반전 표시기는 가격이 정상적인 일일 평균 범위와 관련하여 현재 거래되고 있는 위치를 한 눈에 보여줍니다. 가격이 평균 범위를 초과하고 선택한 수준보다 높을 때 팝업, 이메일 또는 푸시를 통해 즉각적인 알림을 받을 수 있으므로 신속하게 철회 및 반전에 뛰어들 수 있습니다. 지표는 평균 일일 범위 극단에서 차트에 수평선을 그리고 가격이 초과하는 수학적 확률이 첨부된 수준 위의 확장을 그립니다. 자세한 내용은 아래에서... 표시기를 보완하고 모든 쌍을 모니터링하기 위한 ADR 경고 대시보드: https://www.mql5.com/en/market/product/62756
MT5 버전도 여기에서 사용 가능: https://www.mql5.com/en/market/product/64477/
시간의 약 60%는 가격이 정상적인 일일 평균 범위(ADR) 내에서 거래되고 이 수준 이상으로 상승하면 일반적으로 급격한 가격 변동의 지표이며 일반적으로 이에 따라 후퇴(이익 차감) 움직임이

Introducing the Delta Volume Profile Indicator - Unleash the Power of Institutional Precision! https://youtube.com/shorts/znUdz5PEBAY Technical Indicator: Are you ready to trade like the pros? The Delta Volume Profile Indicator is no ordinary tool. It’s a high-precision, cutting-edge indicator that puts the power of institutional-grade trading in your hands. This unique indicator analyses delta volume distribution in real-time, revealing the market's hidden buy/sell imbalances that the biggest

MT5 Version 개요
이 지표는 정교한 추세 추종 모델에 동적 가격 거부 감지, 동적 캔들 색상 표시, ATR 기반 목표 예상 기능을 통합하여, 트레이더가 추세 지속 패턴을 식별하고 관리할 수 있는 완전한 시각적 시스템을 제공합니다.
차트 위에 직접 표시되며, 잠재적인 추세 전환을 자동으로 감지하고, 적응형 지지/저항 근처의 거부를 확인하며, 구조화된 리스크-보상 결정을 지원하기 위해 계산된 손절 및 이익 실현 레벨을 보여줍니다.
일반적인 지표가 추세 방향이나 진입 신호에만 집중하는 것과 달리, 이 도구는 신호 필터링, 변동성 조정 포지셔닝, 단계별 수익 실현 전략을 결합하여 보다 정보에 기반한 거래 결정을 지원합니다.
개념
핵심에는 ATR 기반 밴드를 사용하여 구성된 맞춤형 Supertrend가 있으며, 이는 WMA와 EMA로 부드럽게 처리되어 잡음을 제거하면서 주요 추세 변화를 추적할 수 있습니다.
특징적인 요소는 가격 거부 감지 로직입니다. 이 스크립트는 추세

Advanced Currency Strength Indicator
The Advanced Divergence Currency Strength Indicator. Not only it breaks down all 28 forex currency pairs and calculates the strength of individual currencies across all timeframes , but, You'll be analyzing the WHOLE forex market in 1 window (In just 1 minute) . This indicator is very powerful because it reveals the true movements of the market. It is highly recommended to analyze charts knowing the performance of individual currencies or the countries eco

Forex Breath System 은 모든 시장에서 사용할 수 있는 추세 기반 거래 시스템입니다. 이 시스템은 통화, 금속, 원자재, 지수, 암호화폐, 심지어 주식에도 사용할 수 있습니다. 또한 어떤 시간대에도 사용할 수 있습니다. 이 시스템은 보편적입니다. 추세를 보여주고 추세와 함께 화살표 신호를 제공합니다. 또한 이 지표는 신호가 추세 방향으로 나타날 때 특별한 유형의 경고를 제공하여 추세 거래를 쉽게 만들어줍니다. 이 표시기는 이해하기 어려운 설정을 전혀 처리할 필요가 없으므로 사용하기가 매우 쉽습니다. 차트에 첨부하기만 하면 거래 준비가 완료됩니다. 어떤 거래 스타일을 선호하든 시스템은 시장 방향과 추세 방향에서 가능한 진입점을 확인하는 데 도움이 됩니다. 표시기는 PUSH 알림을 포함한 모든 유형의 경고를 제공합니다. 거래 지침과 큰 보너스를 받으려면 구매 후 저에게 연락하십시오! 행복하고 수익성 있는 거래를 기원합니다!

TopBottom Checker 는 가격의 바닥과 상단을 결정하는 지표입니다. 표시기는 모든 통화 쌍과 함께 사용할 수 있습니다. 표시기는 M1에서 D1까지의 모든 시간 프레임에서 작동합니다. 이 지표는 절대적으로 모든 전략에 매우 중요한 시장 측면과 함께 작동하므로 지표는 독립형 거래 시스템으로 또는 사용하는 거래 시스템의 일부로 사용할 수 있습니다. 지표 신호는 추세와 함께 진입하거나 추세에 반대하여 반전으로, 그리고 열린 포지션의 폐쇄 가능성, 즉 시장을 종료할 가능성을 나타내는 데 모두 사용할 수 있습니다. 표시기는 사용하기가 매우 쉽습니다. 차트에 지표를 추가하고 필요에 따라 해당 신호를 따르기만 하면 됩니다. 이 도구는 외환 거래 및 바이너리 옵션 거래에 사용할 수 있습니다. 기본적으로 지표는 가격 반전을 예측하기 위해 분석이 수행되어 그러한 조건 형성의 가장 빠른 징후를 찾으려고 시도하기 때문에 신호를 약간 다시 그릴 수 있습니다. 다시 그리기는 사소하지만 가능합니다.

우선적으로 이 거래 시스템은 다시 그리지 않고, 다시 그리지 않으며, 지연되지 않는 것을 강조할 가치가 있습니다. 이는 전문적인 거래에 이상적입니다. 온라인 강좌, 사용자 매뉴얼 및 데모. "스마트 서포트 앤 레지스턴스 트레이딩 시스템"은 새로운 및 경험 많은 트레이더를 위해 개발된 고급 지표입니다. 이 시스템은 외환 시장에서 정밀도와 신뢰감을 제공합니다. 이 포괄적인 시스템은 일일 거래 전략, 스윙 거래 전략, 지원 및 저항 전략, 캔들스틱 패턴 전략, VWAP 전략, 다중 시간대 추세 전략 등을 포함한 7개 이상의 전략, 10개의 지표 및 다양한 거래 방식을 결합합니다. 이 시스템은 화살표 신호, 진입 및 출구 지점, 거래 경보, 높은 시간대 추세 분석, 실시간 거래 모니터링 및 트렌드 및 볼륨 캔들 색상 제공합니다. 자동 지원 및 저항 감지로 다양한 시장 상황에서 신중한 결정을 돕는 다면적 인 지표입니다.
스마트 서포트 앤 레지스턴스 트레이딩 시스템은 프리미엄 및 강력한 지

KT Forex Volume은 통화쌍의 매수 및 매도 거래량을 컬러 히스토그램 형태로 표시합니다. 거래량은 자산에 대한 매수 및 매도 거래로 구성됩니다. FX 시장에서: 매수량이 매도량보다 많으면 해당 통화쌍의 가격은 상승하는 경향이 있습니다. 매도량이 매수량보다 많으면 해당 통화쌍의 가격은 하락하는 경향이 있습니다.
주요 기능 틱 볼륨 데이터를 활용하여 나쁜 거래를 피할 수 있습니다. 시장 내 큰 자금을 움직이는 플레이어의 방향에 따라 거래할 수 있도록 도와줍니다. Metatrader의 모든 알림 기능이 포함되어 있습니다.
틱 볼륨 활용하기 기타 시장과 달리, 현물 외환 시장은 중앙 집중식이 아니기 때문에 개인 트레이더가 실제 볼륨 데이터를 얻는 것은 매우 어렵습니다. 2011년 베테랑 외환 트레이더 Caspar Marney가 발표한 연구에서는 틱 볼륨과 실제 거래량 사이에 높은 정확도와 상관관계가 있다고 결론지었습니다.
히스토그램 계산 공식
KT Forex Volume 지표
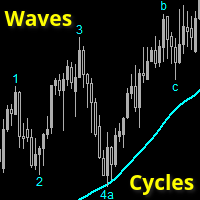
Wave and Cycle counter to give an immediate indication how far the ongoing trend has progressed.
Low numbers: trend has just started, ride the trend. Higher numbers: trend is 'older', watch for reversals
This indicator is 100% compatible with the fantastic TopDog trading strategy.
(I will NOT give any details about this Top Dog strategy)
The trend direction is determined by a SMA value (or any other MA) you can set.
Waves and cycles numbers and letters are derived from a SlowStoch setting.
Wave
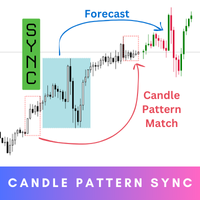
Candle Pattern Sync is your ultimate tool for precision and insight in trading. Step into the future of trading with this innovative indicator that’s designed to help you understand market behavior by analyzing historical patterns and giving you an idea of what might come next. While the forecasts provide valuable probabilities based on history, they’re not guarantees – think of them as a powerful guide to inform your decisions, not a definitive answer. MT5 Version - https://www.mql5.com/en/mar

A MetaTrader 4 indicator is a tool used in the MT4 trading platform to help traders analyze price data. It uses mathematical formulas based on price, volume, or time to show patterns or trends on a chart. Indicators can help traders decide when to buy or sell by showing possible entry and exit points. There are many types, such as trend indicators, oscillators, and volume tools. Traders can also create custom indicators to suit their strategies and improve their trading decisions.

이동 평균(MA) 지표의 다중 통화 및 다중 시간대 수정. 대시보드에서는 지표의 현재 상태를 확인할 수 있습니다. 즉, Fast MA와 Slow MA의 돌파 및 터치(가격별)는 물론 서로 MA 선의 교차점(이동 평균 교차)도 볼 수 있습니다. 매개변수에서 원하는 통화와 기간을 지정할 수 있습니다. 또한 표시기는 선에 닿는 가격과 선의 교차에 대한 알림을 보낼 수 있습니다. 마침표가 있는 셀을 클릭하면 해당 기호와 마침표가 열립니다. MTF 스캐너입니다. 차트에서 여러 대시보드를 실행할 수 있습니다.
표시기는 현재 차트에 빠른 MA 및 느린 MA 선을 표시합니다. 차트의 MA 기간을 선택하고 다른 기간(MTF MA)의 MA를 볼 수 있습니다. MA의 두 세트에 대한 단축키는 기본적으로 "1"과 "2"입니다.
차트에서 대시보드를 숨기는 키는 기본적으로 "D"입니다.
매개변수 Fast MA Averaging period — 평균화 기간. Shift — 옮기다. Averaging

"UNIQUE TRADING APPROACH FOR SERIOUS TRADERS!"
Forex Trend Commander is a professional and easy-to-use Forex trading system based on a very complex system of standard indicators indicate a strong market trend. The indicator gives the best buy and sell recommendations to capture the direction of most of the actual price movements, including take-profit levels. The strategy uses a mechanism for multiple confirmation of the trend which reduces the possibility of false signals. Statistically ge

The Pairs Spread indicator has been developed for the popular strategy known as pairs trading, spread trading, or statistical arbitrage. This indicator measures the distance (spread) between prices of two directly (positively) correlated instruments and shows the result as a curve with standard deviations. So, traders can quickly identify when the instruments are too far apart and use this information for trade opportunities.
How to use the Pairs Spread indicator Best results are attained whe
BreakAxis — 전환점에서의 정밀 신호
최신 업데이트를 놓치지 않으려면 채널에 가입하세요: https://www.mql5.com/en/channels/forexnewadvisor
축 교차 기반 신호 로직
BreakAxis Signal은 0축 교차를 기반으로 방향 전환을 감지하도록 설계되었습니다.
히스토그램 변화는 시장 모멘텀의 전환 가능성을 강조하며, 방향 화살표를 통해 시각적으로 확인됩니다.
신호 확인 및 안정성
각 신호는 특정 수학적 조건이 충족된 후 생성되며, 리페인팅 없이 과거 데이터의 무결성을 유지합니다.
매수 및 매도 신호는 최근 고점과 저점을 기준으로 계산된 평활화된 값의 동적 전환에 따라 개별적으로 표시됩니다.
시각적 요소 및 알림
방향 전환은 차트에서 시각적으로 확인되며, 실시간 모니터링을 위한 알림 기능도 선택적으로 활성화할 수 있습니다.
이 알고리즘은 일반적인 지표에 의존하지 않고 가격 움직임만을 기반으로 작동하는 깔끔한 탐지 로직을 제공합니다

This indicator has been developed to identify and display these trends quickly and easily, allowing you to see instantly, those currency pairs which are trending, and those which are not – and in all timeframes, with just one click. The 28 currency pairs are displayed as a fan as they sweep from strong to weak and back again, and this is why we call it the ‘currency array’. All 28 pairs are arrayed before you, giving an instant visual description of those pairs that are trending strongly, those

[V 1.00] 기동특무부대 NRPA 5 RSI RTD 출시!
다시 칠하지 않는 화살표 실시간 대시보드.
다양한 RSI 지표를 사용하는 데 지쳤지만 정확하지 않은 경우 이 도구를 사용해 보십시오. 일반적으로 사람들은 일정 기간 동안 OBOS 수준을 결정하기 위해 1 RSI만 설치합니다. 나쁜 소식은 다양한 시간대의 OBOS 수준과 추세를 한 번에 볼 수 없다는 것입니다. 이것이 제가 이 거래 도구를 개발한 이유입니다.
설명 방법은 다음과 같습니다.
이 거래 도구에서는 5개의 RSI를 사용합니다. 예, 다섯! 기본적으로 M30이라는 큰 시간 프레임에 RSI 1과 RSI 2를 설정합니다. RSI 1과 RSI 2의 교차점은 M30 시간대에 추세 변화가 있음을 의미합니다. 그런 다음 현재(작은) 시간대에 RSI 3과 RSI 4를 설정합니다. 예를 들어 M5에서 차트를 엽니다. RSI 3과 RSI 4의 교차점은 현재 시간대(M5)에 추세 변화가 있음을 의미합니다. 그런 다음 추세 움

Ranging Market Detector scans the market for momentum and price to check whether the price is range- bound and the direction to which it will breakout. It works with all the all assets and visually shows you the instances when the market is either ranging or trending. Informs when the price has finished a retracement, an opportune time to re-enter the trend early. This will help you in position management. It works very well for Scalping, Day trading, and Swing trading. Helpful in all timefra

RSI / TDI 알림 대시보드를 사용하면 거래하는 모든 주요 쌍에서 RSI를 한 번에(귀하가 선택 가능) 모니터링할 수 있습니다.
두 가지 방법으로 사용할 수 있습니다.
1. 여러 시간 프레임을 선택하면 일반적인 거래 조건을 넘어 확장된 여러 시간 프레임이 있을 때 대시가 표시됩니다. 가격이 여러 기간에 걸쳐 과매수 또는 과매도 수준에 도달하여 최근에 가격이 크게 밀리고 있으므로 곧 철회 또는 반전이 예정되어 있음을 나타내는 훌륭한 지표입니다.
2. 하나의 기간(당신이 가장 선호하는 거래)과 여러 RSI 수준을 사용하여 해당 기간에 RSI 확장의 강도를 보여줍니다. 이것은 가격이 너무 오랫동안 한 방향으로 매우 세게 밀렸고 시장이 차익실현을 해야 할 때 평균 회귀 거래를 취하기 위한 훌륭한 전략입니다. 예시 스크린샷에서 H4 RSI가 25레벨을 넘어 2쌍으로 확장된 것을 볼 수 있습니다. 이는 일반적인 가격 조치보다 훨씬 더 멀리 있기 때문에 매수할 좋은 기회입니다.
대
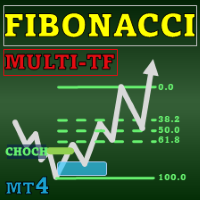
Special offer : ALL TOOLS , just $35 each! New tools will be $30 for the first week or the first 3 purchases ! Trading Tools Channel on MQL5 : Join my MQL5 channel to update the latest news from me Fibonacci Confluence Toolkit Multi-Timeframe 은(는) 전문 트레이더를 위해 설계된 고급 기술적 분석 도구로, 주요 시장 신호와 패턴을 결합하여 잠재적인 가격 반전 영역을 식별하는 데 도움을 줍니다. 타임프레임 선택기 대시보드를 통한 다중 타임프레임 표시 기능을 갖춘 이 툴킷은 시장 역학에 대한 포괄적이고 통찰력 있는 시각을 제공하여 정확하고 시기적절한 거래 결정을 내릴 수 있게 합니다. MT5 버전 더 보기: Fibonacci Confluence Toolkit MT5 Mul

Volume Gives Depth To Price Action! Volume Critical can accurately locate the cheapest areas to place trades. Enter reversals as early as possible to get the best Risk Reward setups!
Features Aggressive algorithm that anticipates reversals Volume Classifications Gray Histograms - Normal Volume, average market activity Orange Histogram - Trending Volume, increased market activity Pink Histograms - Overbought Volume, we can wait for further confirmation to sell Blue Histograms - Oversold Conditio

자동 고정 VWAPs로 거래 통찰력 해제하기: 자동 고정 VWAPs 는 거래 세계에서의 당신의 안내자입니다. 이 인디케이터들은 중요한 시장 전환점을 정확하게 찾아 VWAP 라인을 사용하여 차트에 나타냅니다. 이것은 고정 VWAP 전략을 사용하는 트레이더에게 혁명을 가져다주는 것입니다. 어떻게 작동하나요? 고점 식별: 현재 양초의 가장 높은 가격이 이전 양초의 가장 높은 가격보다 낮을 때, 그리고 이전 고점이 그보다 이전에 나온 고점보다 높을 때, 우리는 고점을 식별한 것입니다. 이 중요한 지점은 이 세 개의 양초 중간에 위치합니다. 저점 인식: 현재 양초의 최저 가격이 이전 양초의 최저 가격보다 높을 때, 그리고 이전 저점이 그보다 이전에 나온 저점보다 낮을 때, 우리는 바닥을 발견했습니다. 이 바닥의 중심이 바로 우리의 초점입니다. 고정된 VWAPs 그리기: 각 상단과 하단은 VWAP 라인에 해당합니다. 그러나 제한이 있습니다: 인디케이터의 계산 요구 사항으로 인해 차트에서 동시에
Minotaur Waves 는 잠재적인 전환점을 감지하고 가격 방향 전환을 높은 정확도로 확인하기 위해 설계된 고급 시장 분석 지표입니다. 이 시스템은 Minotaur Oscillator 의 강력함과 동적인 적응 밴드 구조를 결합하여 명확하고 신뢰할 수 있는 시각적 신호를 제공함으로써 신중한 진입 결정을 돕습니다. 모든 통화 쌍에서 사용 가능하며, 특히 EURUSD, GBPUSD, USDJPY 심볼에서 M1, M5, M15, M30 타임프레임에서 최적의 성능을 발휘합니다.
최신 소식과 가이드를 확인하세요: https://www.mql5.com/en/channels/forexnewadvisor
시스템 주요 구성 요소: 동적 밴드 시스템: 실시간 모멘텀 변화를 감지하고 주요 돌파 구간을 강조 표시 Minotaur Oscillator: 모멘텀 오실레이터로 히스토그램 형태의 극값을 표시하여 전환 구간을 확인 극값 검증: +33(상단) 또는 -33(하단)의 정확한 값으로 확인된 피크에서만

2 SNAKES is a first class scalping system. As the entries are quite precise, you are likely to become addicted to this system very quickly. You have 2 snakes. When you see a candle above or below them that does not touch them - that is your scalping signal.
Then buy or sell at the green line or close. If you use a larger time frame, scalping can become trend following.
The snakes are calculated precisely in relation to the current state of the market. They ARE NOT moving averages.
You decide

現在、ホリデーディスカウントで399ドル! 今後値上がりする可能性があります。以下の説明をお読みください。
Ultimate Dynamic Levelsの紹介 - Ultimate Sniper DashboardのBESTエントリーインジケーター! 極めてローリスクなタイムリーエントリーと高RR!!!
アルティメットスナイパーダッシュボードはこちら。 初心者はもちろん、プロのトレーダーにとっても最も重要な能力は、いつどこで相場が転換するかを正確に判断し、いかに安全に参入し、利益を得て退場するかを見極めることです。
アルティメット・ダイナミック・レベルズ・インディケーターは、相場が転換する可能性が最も高い場所を簡単に教えてくれるので、極めてローリスクなトレードを自信を持って行うことができ、同時にチャートをクリーンでシンプルに保ちながら、$$$を稼ぐことができるのです!
アルティメット・ダイナミック・レベルズ・インディケーターは、複数の時間枠で重要な隠れたレベルを一度に見つけるユニークで強力なアルゴリズムを持っています。また、他の典型的なSRインジケーターのように、レベルを再描

After working during many months, with the help of Neural Networks, we have perfected the ultimate tool you are going to need for identifying key price levels (Supports and Resistances) and Supply and Demand zones. Perfectly suitable to trigger your trades, set up your future actions, decide your Take Profit and Stop Loss levels, and confirm the market direction. Price will always move between those levels, bouncing or breaking; from one zone to another, all the remaining movements are just mark

이 인디케이터는 엘리어트 파동 이론과 두 가지 방식으로 작동합니다: 자동 작동: 이 모드에서는 인디케이터가 엘리어트 파동 이론에 따라 차트 상의 모든 5개의 모티브 웨이브를 자동으로 감지하고 예측 및 잠재적인 반전 지역을 제공합니다. 또한 중요한 개발 사항을 트레이더에게 알릴 수 있는 경보 및 푸시 메시지를 생성할 수 있는 능력을 갖추고 있습니다. 이 자동 기능은 엘리어트 파동 패턴의 식별과 분석 프로세스를 간소화합니다. 수동 작동: 이 옵션은 엘리어트 파동 이론을 수동으로 다루고 싶은 트레이더를 위해 설계되었습니다. 이를 통해 사용자는 아홉 가지 다른 등급을 사용하여 웨이브를 그릴 수 있습니다. 각 등급은 나타난 후에 차트에 그려진 라인을 조정하여 개별적으로 정의할 수 있습니다. 이 기능은 웨이브를 수동으로 그리는 프로세스를 간소화하며 더 효율적으로 만들어 줍니다. 중요한 점으로 모든 그림 데이터가 미래 참조를 위해 플랫폼 데이터 폴더에 저장된다는 것을 기억해야 합니다. 파라미터:

Multi-currency and multitimeframe Heikin Ashi indicator. Shows the current state of the market. On the scanner panel you can see the direction, strength and number of bars of the current trend. The Consolidation/Reversal candles are also shown using color. You can specify any desired currencies and periods in the parameters. Also, the indicator can send notifications when the trend changes or when reversal and consolidation candles (dojis) appear. By clicking on a cell, this symbol and period wi

Special offer : ALL TOOLS , just $35 each! New tools will be $30 for the first week or the first 3 purchases ! Trading Tools Channel on MQL5 : Join my MQL5 channel to update the latest news from me SMC 는 유동성 영역, 기관 주문 위치, 그리고 시장의 주요 전환점을 식별하는 데 도움을 주는 거래 접근 방식입니다. SMC 원칙을 활용하면 트레이더는 시장을 더 효과적으로 탐색하고 최적의 진입 및 종료 지점을 찾을 수 있습니다. SMC System 지표는 이러한 개념을 자동화하여 아래와 같은 주요 가격 행동 요소로 차트를 빠르게 표시할 수 있게 해줍니다: 실시간 시장 구조 (내부 및 스윙 BOS / CHoCH) 주문 블록 (강세 및 약세) 프리미엄 및 할인 영역 동일 고점 및 동일 저점 공정 가치 갭(
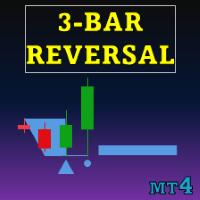
Special offer : ALL TOOLS , just $35 each! New tools will be $30 for the first week or the first 3 purchases ! Trading Tools Channel on MQL5 : Join my MQL5 channel to update the latest news from me 삼중 반전 패턴 지표 는 트레이더들에게 강력한 도구를 제공하여 가격 차트에 삼중 반전 패턴을 자동으로 식별하고 강조 표시합니다. 이 지표는 잠재적인 트렌드 반전을 탐지하는 데 유용하며, 통합된 트렌드 지표를 통해 신호 정확도를 향상시킬 수 있습니다. MT5 버전 보기: Three Bar Reversal Pattern MT5 다른 제품 보기: 모든 제품 주요 특징 자동 패턴 감지: 이 지표는 삼중 반전 패턴을 스캔하며, 명확한 시각적 신호로 표시하여 잠재적인 트렌드 반전 포인트를 인식하는 데 도움을 줍니다.

Introducing Volume Orderflow Profile , a versatile tool designed to help traders visualize and understand the dynamics of buying and selling pressure within a specified lookback period. Perfect for those looking to gain deeper insights into volume-based market behavior! MT5 Version - https://www.mql5.com/en/market/product/122657 The indicator gathers data on high and low prices, along with buy and sell volumes, over a user-defined period. It calculates the maximum and minimum prices during this
Description:
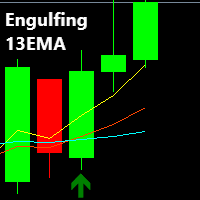
The Engulfing 13EMA is a Multi Timeframe Indicator that scans Multiple Symbols which will help you to identify potential trade set ups. As well as Forex, it can scan Crypto, Exotics, Metals, Indices, Energies or what ever else you have in your Market Watch list. You also have the option to enable/disable the time frames you want to scan. (M1,M5,M15,M30,H1,H4,D1,W1,MN1) All of these options are made possible from just ONE chart, from which the Indicator is attached
An alert is pre

** All Symbols x All Timeframes scan just by pressing scanner button ** *** Contact me to send you instruction and add you in "M W Scanner group" for sharing or seeing experiences with other users. Introduction: Double Top(M) and Double Bottom(W) is a very repetitive common type of price reversal patterns. Double Top resembles M pattern and indicates bearish reversal whereas Double Bottom resembles W pattern and indicates a bullish reversal that they have high win rate. The M W Scanne

Send us a message after your purchase to receive more information on how to get your BONUS for FREE that works in great combination with Bull vs Bear !
Bull versus Bear is an easy-to-use Forex indicator that gives traders clear and accurate signals based on clear trend retests . Forget about lagging indicators or staring at charts for hours because Bull vs Bear provides real-time entries with no lag and no repaint, so you can trade with confidence. Bull vs Bear helps you enter trades durin

미래의 거래를 발견하다 - Golden Arrow Scalper! 유명한 Felipe FX에 의해 개발된 Easy Entry Points는 직관적이고 효율적인 거래 경험을 제공하는 차세대 거래 지표입니다. 고급 기능과 사용자 친화적인 인터페이스를 갖추고 있어 모든 수준의 트레이더에게 최적의 도구입니다. 주요 기능: 쉬운 입점 신호: 빠른 EMA와 천천한 EMA의 교차를 기반으로 이상적인 입점 포인트를 식별하여 거래 결정의 정확성과 시간성을 보장합니다. 음성 알림: EMA 교차에 대한 실시간 알림을 음성으로 설정하여 시장 변화에 빠르게 반응할 수 있습니다. 완전한 맞춤화: 빠른 EMA와 천천한 EMA의 설정을 거래 스타일과 특정 전략에 맞게 조정합니다. 명확한 시각화: 다양한 색상 (SeaGreen과 Red)을 사용하여 EMA 교차를 쉽게 시각화하고 빠르고 정보에 기반한 의사 결정을 돕습니다. 최적화된 성능: Easy Entry Points는 빠르고 효율적으로 작동
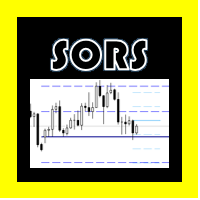
THE SORS COMPLEXES (For Metatrader 4) This indicator is designed to draw the SORS lines on the graph, these are the modern way of calculating market points that it usually respects, they are comprised of supports and resistance, but unlike the classics, these are calculated from volatility endogenous and standard deviation, In the configuration you can change the color of each level linear and hide the ones that are not needed. A = Annual. M = Monthly. W = Weekly D = Daily.

on demo mode use date to work. on version 13 wave added.13.1 histogram and trigger line can be changeble. wave can be set 200-500. can have different signal on wave 200 up-down indicator is no repaint and works all pairs and lower than weekly time frames charts. it is suitable also 1 m charts for all pairs. and hold long way to signal. dont gives too many signals. when red histogram cross trigger line that is up signal.and price probably will down when blue histogram cross trigger line that is
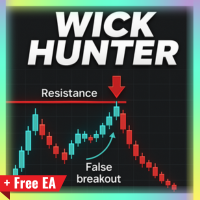
After purchase, you are eligible to receive EA Forex Proton and try it for 14 days completely FREE! This robot automates the alerts from Wick Hunter!
Tired of getting trapped by false breakouts? Wick Hunter is a powerful custom indicator designed to detect fakeouts and identify true reversals before the crowd catches on. Built on the proven False Breakout Strategy , Wick Hunter helps you: Spot liquidity grabs and stop-hunts Enter with precision near wicks Avoid fake breakouts that ruin trades

Monster Harmonics Indicator is a harmonic pattern indicator. It recognizes Gartley, Bat, Crab, Butterfly, Cypher, White Swan, Black Swan, Shark and several other patterns. Projected patterns that are not yet completed are recognized, too. Monster even shows the PRZ (Potential Reversal Zone). Users can add their own user defined patterns to Monster. Besides the current pattern, Monster also shows all patterns in the symbols history. Monster will provide alerts for developing patterns. Introduced

Candle Probability Scalper 사용 가이드 이 지표는 스캘핑을 쉽고 100% 직관적으로 만듭니다. Candle Probability Scalper 는 실시간 으로 현재 캔들에서 매수자와 매도자의 강도 비율을 한눈에 보여줍니다. 비율은 각 틱마다 업데이트되므로, 매 순간 매수자와 매도자 대부분이 무엇을 하고 있는지 알 수 있으며, 지연이 없습니다. 이는 각 세력의 강도를 판단하거나 확인하고, 가격의 움직임을 예측하는 데 큰 도움이 됩니다.
다음은 사용 방법에 대한 명확한 가이드입니다: 1. M1의 매수자와 매도자 비율을 보고 다른 시간대(M5, M15)와 확인하십시오: M1에서 매수자 비율이 60% 이상 이고 M5 및 M15의 매수자 비율이 M1과 일치하여 60% 이상인 경우, 좋은 매수 신호 입니다. M1에서 매도자 비율이 60% 이상 이고 M5 및 M15의 매도자 비율이 M1과 일치하여 60% 이상인 경우, 좋은 매도 신호 입니다. 이것은 추세가 일시적인 것이

Multicurrency and multi-timeframe indicator Inside Bar (IB). In the parameters, you can specify any desired currencies and timeframes. The panel displays the last found Inside Bar (and Mother Bar) pattern, the current price position and the breakout of the levels of the Mother and Inside Bars. You can set the size and color for bars and text in the cells. The indicator can also send notifications when levels are broken. By clicking on a cell with a period, the specified symbol and period will b

StalkeR Arrow는 바 오픈/인트라 바에서 매수 및 매도 신호를 제공하는 화살표 표시기입니다. 이 표시기는 가격 행동 패턴 및 프랙탈을 기반으로 합니다.
이 지표는 각 매수 및 매도 신호에 대해 tp와 sl을 제공하며, tp와 sl은 각 신호 위와 아래에 선 형태로 표시되며 새로운 신호가 형성될 때까지 연장됩니다.
이 표시기에는 기록 신호의 승/패 통계를 제공하는 백테스팅 패널/대시보드가 있으며, 이 표시기는 다시 칠하거나 다시 칠하지 않습니다.
매개변수:
StalkeR 기간: 화살표 기간, 숫자가 높을수록 더 적은 수의 신호가 제공됩니다.
스프레드: 포인트 단위의 스프레드 값을 사용하여 패널에서 승패를 계산합니다.
정지손실 ATR x : atr 곱셈의 SL 값
Takeprofit ATR x : atr 곱셈의 TP 값
ATR 기간 : tp 및 sl을 기반으로 계산하는 데 사용되는 atr 기간
TP/SL 라인 색상 및 너비
화살표 색상 및 너비
패널
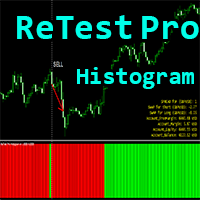
MT4용 Crypto_Forex 지표 "ReTest Pro 히스토그램", 리페인트 없음.
- ReTestPro_Histogram 지표는 강력한 지지선/반지선 재테스트 후 주요 추세 방향으로 진입 신호를 찾는 데 사용할 수 있습니다. - ReTestPro 히스토그램은 두 가지 색상으로 제공됩니다. 빨간색은 하락 추세, 녹색은 상승 추세입니다. - 동일한 색상의 히스토그램 열이 지속적으로 나타나면 새로운 추세가 시작되었음을 의미합니다. - ReTest 신호는 히스토그램에서 반대 색상의 열과 다음 열의 추세 색상으로 표시됩니다(그림 참조). - 지표에는 모바일 및 PC 알림 기능이 내장되어 있습니다. - 지표가 연결된 외환 통화쌍의 현재 스프레드와 스왑 정보를 보여주는 정보 스프레드 스왑 표시 기능이 있습니다. - 계좌 잔액, 자본금, 증거금도 표시됩니다. - Info Spread Swap Display는 차트의 어느 모서리에나 배치할 수 있습니다. 0 - 좌측 상단, 1 - 우측 상

"Scalping Signal No Repaint No Lag"는 어떤 차트에 드래그하더라도 템플릿이나 다른 지표를 로드할 필요 없이 자동으로 모든 필요한 지표를 로드하는 유일한 지표입니다. 제공된 이미지와 정확히 동일한 모습으로 차트를 자동으로 구성합니다. 이 지표는 재도색 없이 신호를 제공하므로 모든 통화 쌍과 시간대(TF)에서 스캘핑 전략에 이상적입니다. 기능 자동 지표 로딩 : 지표를 어떤 차트에 드래그하면 추가로 필요한 모든 지표가 자동으로 로드되고 설정된 선호도에 따라 차트가 구성됩니다. 원하면 설정에서 매개변수를 변경할 수 있습니다. 차트 시각화 : 일본 촛대 및 특정 색상을 사용하여 시각화를 개선하기 위해 차트 속성을 조정합니다. 배경 및 촛대 색상은 원하면 변경할 수 있습니다. 신호 생성 : 두 이동 평균 간의 차이와 RSI가 EMA와 교차하는 것을 사용하여 매수 및 매도 신호를 생성하며, 차트에 화살표로 표시됩니다. 추세 시각화 : 빠른 이동 평균과 느린 이동 평균

이 인디케이터는 선택한 기간 동안 상승과 하락 사이의 불균형을 측정하고 두 지점 사이의 직선을 표시합니다.
상승세가 하락세보다 거래량이 많으면 선이 녹색으로 바뀝니다. 하락세가 더 많으면 빨간색으로 표시됩니다. 이 선은 거래량의 백분율 차이도 표시합니다.
표시기는 별도의 창에 동일한 데이터를 표시합니다. 분할된 볼륨도 볼 수 있습니다.
표시기에는 두 가지 모드가 있습니다.
이를 위해 왼쪽 상단에 버튼이 있습니다,
- 누르지 않으면 시장의 임의의 지점과 현재 가격 사이의 불균형을 측정합니다. - 버튼을 누르면 선택한 시장의 두 지점 사이의 잔액을 측정할 수 있습니다.
이 인디케이터는 선택한 기간 동안 상승과 하락 사이의 불균형을 측정하고 두 지점 사이의 직선을 표시합니다.
상승세가 하락세보다 거래량이 많으면 선이 녹색으로 바뀝니다. 하락세가 더 많으면 빨간색으로 표시됩니다. 이 선은 거래량의 백분율 차이도 표시합니다.
표시기는 별도의 창에 동일한 데이터를 표

note: this indicator is for METATRADER4, if you want the version for METATRADER5 this is the link: https://www.mql5.com/it/market/product/108106 TRENDMAESTRO ver 2.4 TRENDMAESTRO recognizes a new TREND in the bud, he never makes mistakes. The certainty of identifying a new TREND is priceless. DESCRIPTION TRENDMAESTRO identifies a new TREND in the bud, this indicator examines the volatility, volumes and momentum to identify the moment in which there is an explosion of one or more of these data a

Pairs Trading Z-Score Optimized is a custom indicator for the MetaTrader 4 (MT4) platform, designed to support pairs trading by analyzing the spread between two currency pairs using Z-Score calculations and stationarity testing. It operates on a single pair (the chart’s symbol and a user-defined second symbol) and displays Z-Score values, threshold bands, and trading signals in a subwindow, with optional arrows on the main chart. The indicator incorporates the Augmented Dickey-Fuller (ADF) test

Linear Trend Predictor - 진입 지점과 방향성 지원선을 결합한 추세 지표입니다. 고가/저가 채널을 돌파하는 원칙에 따라 작동합니다.
지표 알고리즘은 시장 노이즈를 걸러내고 변동성과 시장 역학을 고려합니다.
표시기 기능
평활화 방법을 사용하여 시장 추세와 BUY 또는 SELL 주문을 시작하기 위한 진입 시점을 보여줍니다. 모든 기간의 차트를 분석하여 단기 및 장기 시장 움직임을 파악하는 데 적합합니다. 어떠한 시장과 시간대에도 적용할 수 있으며, 입력 매개변수를 통해 거래자는 자신에게 맞게 지표를 독립적으로 사용자 지정할 수 있습니다. 설정된 지표 신호는 사라지거나 다시 그려지지 않습니다. 이는 캔들 마감 시 결정됩니다.
여러 유형의 알림이 화살표와 결합되어 있습니다. 이 지표는 독립적인 거래 시스템으로 사용할 수도 있고, 다른 거래 시스템에 추가하는 용도로도 사용할 수 있습니다. 모든 수준의 경험을 가진 거래자가 사용할 수 있습니다.
주요 매
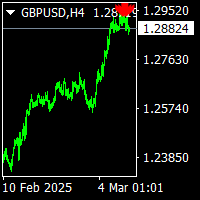
sinus arrows indicator is norepaint arrows indicator. it works all timeframes and all pairs. suitable for experienced traders and beginners. gives red arrows for sell.and gives blue arrows for buy. traders must check the all timeframes.i mean when trading 5m charts also need the check 15m charts and 1m charts. there is cnt number to see the how much bars back bars.
Enjoy a 50% OFF Christmas holiday sale!
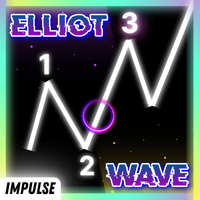
You can visually backtest Elliot Wave Impulse to see how it behaved in the past! Manual guide: Click here This indicator is unstoppable when combined with our other indicator called Katana . After purchase, send us a message and you could get it for FREE as a BONUS! The Elliot Wave Impulse is a pattern identified in the Elliott Wave Theory, a form of technical analysis used to analyze financial market cycles. The Impulse Wave is consider

Description: First of all Its worth emphasizing here that the Trend Breakout Catcher is Non-Repainting, Non-Redrawing and Non-Lagging Indicator, Which makes it ideal from both manual and robot trading. The Trend Breakout Catcher Indicator employs a sophisticated algorithm designed to predict trends early and generate timely Buy and Sell signals at the onset of a breakout. Utilizing a smart calculation based on numerous elements, the indicator forms a robust and redundant system to detec

표시기는 지정된 영역(BOX)의 수평 볼륨 프로파일과 최대 볼륨(POC)을 표시합니다.
제품 특징. 1. 틱 또는 가격만 사용할 수 있습니다. 2. 적응 그리드 간격(M1-MN). 3. 상자 크기에 따른 적응형 대용량(중앙값) 검색 단계. 4. 상자 라인과 버튼의 자동 카멜레온 색상. 5. 생성 및 삭제가 용이한 다중 상자. 6. 70% 볼륨 영역(설정에서 활성화됨). 7. 최대 수평 볼륨 라인(POC) 터치에 대한 경고가 있습니다. 8. VWAP. 9. 제어 패널.
볼륨 프로필 표시기로 시장을 탐색하십시오. 나는 그것을 위해 그것을 했지만 이제 당신도 사용할 수 있습니다.
주요 설정. Calc Histo Mode – 히스토그램 계산 방법 (Market Profile – 가격으로 계산, Tick Volume Profile – 틱으로 계산). Mode Step In Pips – 핍으로 중앙선 계산. Vertical Step – 히스토그램의 수직 단계(줄 사이의 거리(핍)). Da

대칭 삼각형 차트 패턴은 가격이 강제로 상승 또는 붕괴되기 전에 수축 및 통합 기간을 나타냅니다. 하단 추세선에서의 분석은 새로운 약세 추세의 시작을 나타내고 상단 추세선의 이탈은 새로운 강세 추세의 시작을 나타냅니다. 대시보드를 사용하여 대칭 삼각형 패턴으로 거래하는 모든 상품과 시간 프레임을 한 번에 모니터링하십시오! https://www.mql5.com/en/market/product/69169/
MT5 버전 사용 가능: https://www.mql5.com/en/market/product/70006/
이 표시기는 이러한 패턴을 식별하고 4가지 핵심 포인트가 형성되고 가격이 다시 삼각형으로 되돌아갔을 때 경고하므로 잠재적인 돌파에 대비할 수 있습니다. 대칭 삼각형이 항상 완벽하게 대칭인 것은 아니며 가격이 오르거나 내릴 수 있지만 일반적으로 가장 성공적인 돌파는 삼각형의 첫 번째 점을 형성한 높거나 낮은 방향입니다. 따라서 지표는 돌파에 대한 강세 또는 약세 편향을 제공하

Candle Volume Strength는 매수자와 매도자 간의 진행 중인 전투에 대한 통찰력을 제공하는 고급 볼륨 분석 지표입니다. 실시간 볼륨 변화를 계산하고 시각화하여 트레이더가 브레이크아웃, 트렌드, 리트레이스먼트 및 반전을 더 정확하게 확인할 수 있도록 도와줍니다.
주요 특징: 거래량 기반 확인 – 이 지표는 틱 거래량 변화를 모니터링하고 매수자와 매도자 간에 시장 지배력이 변할 때 경고합니다. 추세 및 돌파 검증 – 거래량 분포를 분석함으로써 트레이더는 시장 추세와 돌파 신호의 강도를 확인할 수 있습니다. 반전 및 되돌림 감지 – 볼륨 패턴은 가격 움직임의 잠재적인 전환점을 식별하는 데 도움이 됩니다. 지원 및 저항에 대한 통찰력 – 주요 수준 근처에서 거래량이 증가하면 신뢰성에 대한 확신이 커집니다. 간단하고 효과적인 시각화 – 쉽게 해석할 수 있도록 매수 및 매도 강도를 히스토그램 막대로 표시합니다. 캔들 볼륨 강도는 거래자가 볼륨 분석을 활용하여

Price Action Sniper is designed to trade the Price Action on the desired chart time frame. - Trend Reversals. - Trend Continuation. - Brekaouts. - Good tool for Binary Options
Price action forms the basis for all technical analysis of a currency pair, commodity or other asset chart. Many short-term traders rely exclusively on price action and the formations and trends extrapolated from it to make trading decisions. Technical analysis as a practice is a derivative of price action since it uses p

Advanced version of CyberZingFx Volume Plus, the ultimate MT4 indicator for traders seeking highly accurate buy and sell signals. With an additional strategy and price action dot signals that enhances its effectiveness, this indicator offers a superior trading experience for professionals and beginners alike. The CyberZingFx Volume Plus Advanced version combines the power of volume analysis and historical price data with an additional strategy, resulting in even more precise and reliable signals
This Indicator only places quality trades when the market is really in your favor with a clear break and retest. Patience is key with this price action strategy!
If you want more alert signals per day, you increase the number next to the parameter called: Support & Resistance Sensitivity. After many months of hard work and dedication, we are extremely proud to present you our Break and Retest price action indicator created from scratch. One of the most complex indicators that we made with over

** All Symbols x All Timeframes scan just by pressing scanner button ** *** Contact me to send you instruction and add you in "Wolfe Wave Scanner group" for sharing or seeing experiences with other users. Introduction: A Wolfe Wave is created with five-wave patterns in price. It shows supply and demand and a fight towards a balance price. T hese waves of price actions can help traders identify the boundaries of the trend . Also It helps forecast how the price will move in the near future
KT Knoxville Divergence는 상대강도지수(RSI)와 모멘텀 오실레이터를 정교하게 조합하여 금융 자산의 독특한 가격 다이버전스를 포착하는 강력한 도구입니다. 이 지표는 시장 역학의 미세한 변화를 효과적으로 감지하고, 트레이더들이 잠재적인 수익 기회를 보다 정확하게 찾을 수 있도록 도와줍니다. Knoxville Divergence는 Rob Booker가 개발한 트레이딩 다이버전스 유형입니다. 트레이딩에서 다이버전스란, 자산의 가격 움직임과 기술적 지표(오실레이터)가 서로 반대 방향으로 움직일 때 발생합니다. 이러한 불일치는 현재의 가격 추세가 약화되고 있으며, 반전할 수 있음을 나타낼 수 있습니다. 이 인디케이터는 최적의 매수 및 매도 타이밍을 찾고자 하는 트레이더에게 매우 유용합니다. 다이버전스가 발생할 때마다 가격 차트에 시각적 신호를 표시합니다.
Knoxville Divergence 이해하기
Knoxville Divergence는 트렌드에 반대하는 매매를 하거나

The indicator finds candlestick patterns based on Gregory L.' Morris "Candlestick Charting Explained: Timeless Techniques for Trading Stocks and Futures". If a pattern is detected, the indicator displays a message at a bar closure. If you trade using the MetaTrader 5 terminal, then you can download the full analogue of the " Candle Pattern Finder for MT5 " indicator It recognizes the following patterns: Bullish/Bearish (possible settings in brackets) : Hammer / Shooting Star (with or without con

Dark Support Resistance is an Indicator for intraday trading. This Indicator is programmed to identify Support and Resistance Lines , providing a high level of accuracy and reliability.
Key benefits
Easily visible lines Only the most important levels will be displayed Automated adjustment for each timeframe and instrument Easy to use even for beginners Never repaints, never backpaints, Not Lag 100% compatible with Expert Advisor development All types of alerts available: Pop-up, Email, Push

Dark Sprint is an Indicator for intraday trading. This Indicator is based on Trend Following strategy, also adopting the use of the atr to determine the right volatility. We can enter in good price with this Indicator, in order to follow the strong impulse on the current instrument.
Key benefits
Easily visible sprint lines Intuitive directional arrows Automated adjustment for each timeframe and instrument Easy to use even for beginners Never repaints, never backpaints, Not Lag 100% compatibl

The indicator displays trend reversal in the form of arrows. The indicator does not change its values (is not redrawn) after a signal. The program notifies about arrows by means of a pop-up window, or sending notification to e-mail. This is a multitimeframe instrument. Values of the indicator may be displayed from higher timeframes.
Parameters Time-frame - select time session; zero is the current timeframe (Time-frame cannot be lower than the current time interval). Bars - number of bars on the

Special offer! https://www.mql5.com/ru/users/bossik2810
Gold AMS - is a good technical stock indicator. The indicator algorithm analyzes the asset price movement and reflects volatility and potential entry zones. The indicator 100% does not repaint!!!
The best indicator signals: If a signal appears, it does not disappear! Unlike indicators with redrawing, which lead to loss of deposit, because they can show a signal and then remove it. Trading with this indicator is very easy. We wait for a

** All Symbols x All Timeframes scan just by pressing scanner button ** *** Contact me to send you instruction and add you in "Market Structure group" for sharing or seeing experiences with other users. Introduction: Market structure is important for both new and professional traders since it can influence the liquidity and price action of a market (Breakout and Retest). It’s also one of the most commonly used techniques to understand trends, identify potential reversal points, and get a feel f
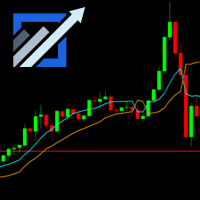
Boost your trading accuracy with the SSL Channel Indicator , designed to identify trends and precise entry points. This dynamic tool adapts to all trading instruments and timeframes. Perfect for scalpers, day traders, and swing traders, the SSL Channel Indicator simplifies market analysis, helping you trade confidently and effectively. Unlock your trading potential today! MT5 Link- https://www.mql5.com/en/market/product/127492
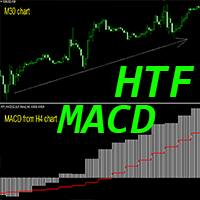
MT4용 Crypto_Forex 지표 HTF MACD 오실레이터.
- HTF는 상위 시간대를 의미합니다. - MACD 지표 자체는 추세 거래에서 가장 인기 있는 지표 중 하나입니다. - 이 지표는 가격 변동 진입 시점을 포함하거나 다른 지표와 함께 사용하는 다중 시간대 거래 시스템에 매우 적합합니다. - HTF MACD 지표를 사용하면 상위 시간대의 MACD를 현재 차트에 추가할 수 있습니다. --> 이는 전문적인 거래 방식입니다. - 지표에는 모바일 및 PC 알림 기능이 내장되어 있습니다.
// 훌륭한 트레이딩 로봇과 지표는 다음 링크에서 확인할 수 있습니다. https://www.mql5.com/en/users/def1380/seller MQL5 웹사이트에서만 제공되는 오리지널 제품입니다.
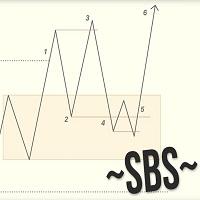
Swing Breakout Sequence | SBS presents a comprehensive trading strategy designed to help traders identify and capitalize on market swings and breakouts. The Swing Breakout Sequence (SBS) strategy is built around a series of well-defined steps to optimize trading decisions and improve profitability. Version 2.01: Add "golden entry" - entry by fib. Stoic added to it (fibo) he calls this setup gold SBS here is the video the description of the setup starts at 18min24sec Version 2: + Add BOS filter
MetaTrader 플랫폼 어플리케이션 스토어에서 MetaTrader 마켓에서 트레이딩 로봇을 구매하는 방법에 대해 알아 보십시오.
MQL5.community 결제 시스템은 페이팔, 은행 카드 및 인기 결제 시스템을 통한 거래를 지원합니다. 더 나은 고객 경험을 위해 구입하시기 전에 거래 로봇을 테스트하시는 것을 권장합니다.
트레이딩 기회를 놓치고 있어요:
- 무료 트레이딩 앱
- 복사용 8,000 이상의 시그널
- 금융 시장 개척을 위한 경제 뉴스
등록
로그인
계정이 없으시면, 가입하십시오
MQL5.com 웹사이트에 로그인을 하기 위해 쿠키를 허용하십시오.
브라우저에서 필요한 설정을 활성화하시지 않으면, 로그인할 수 없습니다.