适用于MetaTrader 4的免费技术指标 - 3
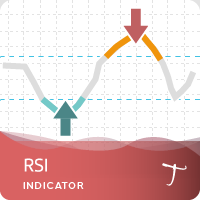
Tipu RSI Features 28 symbols, multi-time frame powerful Dashboard for the full market view Customizable Buy/Sell alerts, push alerts, email alerts, and visual on-screen alerts. Marked overbought and oversold levels. Three colors RSI that marks the normal, oversold and overbought levels. The relative strength index (RSI) is an oscillator devised by J. Welles Wilder in his famous book New Concepts in Technical Trading Systems in 1978.1 He also introduced Parabolic SAR (see Tipu Parabollic SAR Pane
FREE
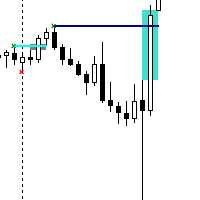
The Contraction/Expansion Breakout Indicator for MetaTrader 4 (MT4) is a powerful tool crafted to identify and signal the breakout of bullish and bearish contraction or expansion formations within financial markets. Utilizing advanced algorithmic calculations, this indicator assists traders in recognizing significant price movements that frequently accompany these formations, providing valuable insights for strategic trading decisions. Key Features: Contraction and Expansion Identification: The
FREE

Description: This indicator draw ZigZag Line in multiple time frame also search for Harmonic patterns before completion of the pattern.
Features: Five instances of ZigZag indicators can be configured to any desired timeframe and inputs. Draw Harmonic pattern before pattern completion. Display Fibonacci retracement ratios. Configurable Fibonacci retracement ratios. Draw AB=CD based on Fibonacci retracement you define. You can define margin of error allowed in Harmonic or Fibonacci calculatio
FREE
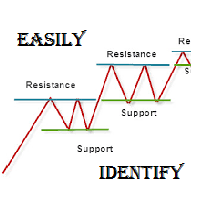
As per name Easily Identify, This Indicator is a affordable trading tool because with the help of Popular Developers & Support of M Q L Platform I have programmed this strategy. I tried to input 4 types and 3 periods of Calculation regarding Support Resistance, Furthermore, I have also care about Trend lines that Trader can easily get in touch with market in another way also. What is in for Trader?
Trading Modes: This selection is for activate whole strategy "Easily Identify" Support_
FREE

YOU CAN NOW DOWNLOAD FREE VERSIONS OF OUR PAID INDICATORS . IT'S OUR WAY OF GIVING BACK TO THE COMMUNITY ! >>> GO HERE TO DOWNLOAD The system is a free open source pine script originally published on TradingView by everget . It was converted to Mt4 by Forex Robot Makers. This system is a popular trend indicator based on ATR ( Average True Range ) , Moving Averages and the Donchian channel .
System BackGround
ATR The average true range is an indicator of the price volatility of an as
FREE

This indicator has been created for finding the probable reversal points of the symbol price. A small candlestick reversal pattern is used it its operation in conjunction with a filter of extremums. The indicator is not redrawn! If the extremum filter is disabled, the indicator shows all points that have a pattern. If the extremum filter is enabled, the condition works – if the history Previous bars 1 candles back contains higher candles and they are farther than the Previous bars 2 candle, such
FREE
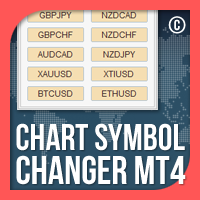
MT4 的图表符号更改器是一个指标/实用程序,它为您提供更改当前图表符号的选项,该选项通过单击其面板上的符号按钮来更改。 MT4 的图表符号转换器让您可以选择根据个人喜好配置 32 个符号按钮,方法是添加您想要密切关注和交易最多的货币对。这样您就不会错过任何机会,因为只需点击几下,您就可以在图表上更快地查看市场。
MT4 安装/用户指南的图表符号转换器 | 更新购买的产品
特征 面板上有 32 个可自定义的符号,让您可以在同一图表上监控您喜欢的工具 在任何交易品种/工具、账户类型或经纪商上顺利运行
MT4 的图表符号转换器也以交易面板的形式出现,以帮助您进行交易和风险管理以及一般的手动交易。 手动交易面板 MT4: https://www.mql5.com/en/market/product/72964
如果您对购买感到满意,我将不胜感激。 如果您不是, 请与我联系以找到解决方案 。
检查我所有的产品: https://www.mql5.com/en/users/eleanna74/seller 联系我以获得支持: https:/
FREE

Trade History for MT4 This indicator is specially developed for that traders want to display his trades on the charts. Shows history and current deals on the chart. Trades show on the chart with a dotted line, and profit will show realtime. Buy trades are displayed in bull color, Sell trades in bear color.
Tip: The historical order displayed by the indicator is associated with the "Account History", so please set the historical order display in the "Account History" of MT software.
If yo
FREE

''A professional trader is a greedy trader: he buys at lows and sells at highs with minimal risks and high returns,,
Pips Slayer is developed exactly for such trading approach . It's a universal indicator for tracking reversals and uses price action patterns, discrepancy of custom indicators and a multi-layered formula for identifying reversal structures. The indicator is very easy to use; it only shows arrows where is recommended to buy or sell and recommended take-profit and stop-loss pric
FREE
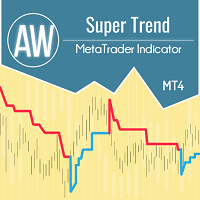
AW Super Trend - 这是最流行的经典趋势指标之一。它有一个简单的设置,让您不仅可以处理趋势,还可以显示由该指标计算的止损水平。 好处:
仪器: 货币对 、股票、商品、指数、加密货币。 时限:М15 及更高。 交易时间:全天候。 显示当前趋势的方向。 计算止损。 它可以在交易时使用。 三种类型的通知:推送、电子邮件、警报。 MT5 版本 -> 这里 / 新闻 -> 这里 能力:
- 该指标以相应颜色显示当前趋势方向。
- 蓝色表示当前时间范围内使用的交易品种的上升趋势。
- 该线的红色表示所选交易品种所用时间范围的下降趋势。
该指标可用于设置止损。
指标线不显示在条柱上方,而是相对于条柱有一些偏移。这个显示趋势线的地方可以被交易者用来设置止损。 当趋势发生变化时,指标线会在趋势变化的时刻重新绘制并显示为垂直线。该显示是由于该指标可用于标记止损。 可能会在较小的时间范围内过滤信号,并在较高的时间范围内显示方向。 怎么运行的:
1. 也就是说,如果您在 M15 或 M30 时间范围内工作
2. 在更高的时间框架上运行指标。 H4 或
FREE

This indicator allows you to manage your exposure and see how the lot changes. You can choose the optimal lot value for your deposit without opening real positions. And also evaluate new trading instruments. If you trade manually, then risk management will help you avoid unexpected losses. The indicator includes the ability to receive a sound signal when a specified level is reached, as well as send push notifications and a message to the mail.
FREE
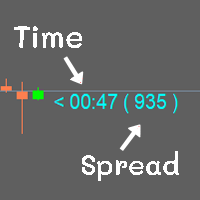
Show the time of candlesticks and spread. All data will be displayed in a rod. Can change color Can fix the size as needed
MT4 : Link https://www.mql5.com/en/market/product/102742 MT5 : Link https://www.mql5.com/en/market/product/102834
Most free code on various websites I didn't write it myself. I only do a little bit.
If you like it, please give 5 stars with it. Thank you.
FREE

指标在图表上显示基于终端RSI振荡器的信号。 从而能够滤除重复信号。
这里振荡器用于搜索反向信号。 建议将其作为波段策略和水平交易的切入点。
多币种仪表板可用。 有了它,您可以轻松地在图表之间切换。 在产品讨论中,您可以建议一种可以在其中嵌入仪表板的算法。
输入参数 。
主要设置 。
Bars Count – 指标将工作的历史柱的数量 。 RSI Period – 振荡器周期 。 RSI Level – 振荡器的电平。 振荡器在0到100之间。 如果选择10,信号将高于10,低于90 。 RSI Applied Price 。 Repeat Signal - 重复信号 。 Enable – 所有重复的信号将与箭头/图标 。 No Signal – 所有重复的将被忽略 。
视觉箭头 。 Sell Code – Sell rsi图标的代码编号 。 Sell Color – 出售RSI图标的颜色 。 Buy Code – 购买RSI图标的代码编号 。 Buy Color – 购买RSI图标的颜色 。 Indent Coeff – 由波动系数从阴影缩进 。 Siz
FREE

This indicator is very useful for day traders or short term traders. No need to calculate the number of pips manually, just look at the chart and you will see the Virtual Take Profit / Virtual Stop Loss target line and evaluate whether the entry point is feasible to reach the intended target or not.
Enter the intended Take Profit / Stop Loss pips for your trade. The indicator will display Virtual Take Profit / Virtual Stop Loss lines for you to easily see if the target is feasible or not.
FREE
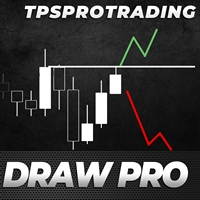
The TPSproDraW indicator allows to draw continuous zigzag lines on the chart. This handy tool will strike fancy of those traders who trade using technical analysis and need visual expression to forecast the price movement.
A drawn continuous zigzag line can be removed as easily as it is drawn - just aim a mouse cursor to the zigzag line and press the Shift key. How it helps:
The Z key - double press to enable the mode of drawing patterns, press one time to disable the mode, Esc - cancel drawn
FREE

The TrueChannel indicator shows us the true price movement channels. This indicator resembles Donchian Channel in its appearance, but is built on the basis of completely different principles and gives (in comparison with Donchian Channel , which is better just to use to assess volatility) more adequate trading signals. As shown in the article , the price actually moves in channels parallel to the time axis and jumps abruptly from the previous channels to the subsequ
FREE

MP Candle Countdown indicator with a progress bar is a tool used in technical analysis that displays the time remaining until the current candlestick on a chart closes, along with a progress bar that shows visually the amount of time that has elapsed since the candlestick opened. This indicator can be helpful for traders who use candlestick charting to make trading decisions, as it provides both a visual representation of the time left until a candlestick closes and an indication of how much ti
FREE

CyberZingFx Volume Indicator is designed to help traders find market reversals with ease. This powerful tool uses a unique strategy that combines both volume and historical price to provide accurate signals for potential market reversals. The indicator displays volume BUY and SELL power values on the right side of the chart for both BUY and SELL. With customizable settings, you can set alerts at different levels to suit your trading style. The most recent alert value is displayed as Alert High,
FREE

This is a Multi pair and Multi time frame dashboard. The founder of the system is Mr. Oma Ally, which is a system based from Bollinger Band and Moving Average(BBMA). BBMA consists of the use of 2 indicators: Moving Averages Bollinger Bands BBMA consists of 3 types of entries: Extreme MHV Re-Entry Rejection EMA50 This Dashboard Help you to scan current Extreme, Reentry setup, Rejection EMA50 and also MHV How to read signals:
find the same color in 3 different timeframes in succession
For exam
FREE

Introduction This indicator detects volume spread patterns for buy and sell opportunity. The patterns include demand and supply patterns. You might use each pattern for trading. However, these patterns are best used to detect the demand zone (=accumulation area) and supply zone (=distribution area). Demand pattern indicates generally potential buying opportunity. Supply pattern indicates generally potential selling opportunity. These are the underlying patterns rather than direct price action. T
FREE

Индикатор MQLTA Supertrend Multi Timeframe сочетает в себе значения Supertrend, найденные на нескольких таймфреймах, чтобы подтвердить тренд пары. Для работы утилиты необходим бесплатный индикатор MQLTA Supertrend Line - https://www.mql5.com/en/market/product/25951.
Как он работает? Индикатор проверяет состояние Supertrend на всех выбранных таймфреймах и отображает результат в виде легко читаемой таблицы.
Как торговать с помощью индикатора Supertrend Multi Timeframe Покупку следует совершать
FREE

The MACD Signal Candle indicator changes color according to the MACD trends. Colored Candles, based on MACD.
HOW IT WORKS
For a Buy: -If the indicator is above zero, the market is bullish. -If the market is bullish, you can take a stand with green candle signals. For a Sell: -If the indicator is below zero, the market is bearish. -If the market is bearish, you can take a stand with the red candles.
FREE

This Indicator is a affordable trading tool because with the help of Popular Developers & Support of M Q L Platform I have programmed this strategy. I tried to combine logic of Moving Averages, Parabolic Stop And Reverse, Trend Strength, Oversold, Overbought . Furthermore, I have also care about Support Resistance that Trader can easily get in touch with market by selecting one indicator only. What is in for Trader?
Trading Modes: This selection is for activate whole strategy "Power
FREE

通过 Your Chart 指标提升您的交易体验! 这个免费的高度可定制工具允许交易者将多个时间框架合并为一个干净的蜡烛图显示,而不改变原始图表。使用 Your Chart,您可以设置每根自定义蜡烛的条数——例如,将每 18 根 M1 蜡烛合并为一根,以便更广泛地查看市场趋势。 主要特点: 自定义蜡烛形态 :选择合并多少条蜡烛为一根,提供灵活的市场视图。 非侵入性设计 :原始图表数据保持不变,自定义蜡烛以覆盖形式绘制,显示蜡烛的实体和影线。 颜色自定义 :根据您的喜好个性化看涨和看跌方向的蜡烛颜色。 简化交易 :通过自定义图表视图,交易者可以获得独特的见解和更符合个人需求的价格走势视觉效果。 非常适合那些希望在保持 MetaTrader 4 简单性的同时,获得全新图表视角的交易者。
FREE
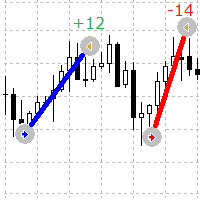
一个简单而有用的指标,可以在图表上直观地查看订单的进入点和退出点
该指标在交易品种上显示当前未结订单和已完成订单
指标参数
Lines Buy color - 指定买单的线条颜色 Lines Sell color - 指定卖单的线条颜色 Lines Width - 设置线宽,适用于实体样式类型 Lines style - 设置线条的样式 Lines positive profit color - 设置正利润文本的颜色 Lines negative profit color - 设置负利润文本的颜色 Lines profit value font type - 设置利润文本的字体类型,您可以设置您计算机上安装的任何一种 Lines profit font size - 设置利润文本的字体大小 Lines profit value angle - 设置利润文本的角度,默认为 0,垂直可以设置 90 Show profit in pips rather on deposit currency - 如果设置为真,指标将以点数显示利润,如果为假,它将以存款货币显示
FREE

前一交易日的收盘价与K线位移 MetaTrader! 前一交易日的收盘价与K线位移指标是一种旨在改善技术分析和交易决策的工具。借助该指标,您可以获取有关任何K线的开盘价、最高价、最低价和收盘价的详细信息,从而实现对市场走势的精确和全面分析。 想象一下,您可以将一个时间框架放置在另一个时间框架之内,以便在当前时间框架内详细分析每根K线。通过前一交易日的收盘价与K线位移指标,您可以轻松实现这一令人难以置信的功能! 前一交易日的收盘价作为支撑位和阻力位的重要性已经得到交易者社区的广泛认可。现在,通过这个工具,您可以清晰准确地看到价格在前一收盘价停止的水平,为您的买卖决策提供宝贵的见解。 将该指标应用于您的图表上后,您将立即获得前一交易日的开盘价、最高价、最低价和收盘价等关键信息,以视觉上引人注目的方式突出显示。此外,您还可以调整K线的位移,使您能够在当前时间框架内分析MetaTrader的任何时间框架的数据。 这个独特的功能将使您能够根据所选时间框架中前一交易日收盘价提供的支撑位和阻力位,识别基于任何所需时间框架的蜡烛图形态,开启新的交易机会,并增加您的成功机会。您可以基于前一交易日的收盘价
FREE

Keltner Channel is a well known indicator that not in MT4's indicators default lineup (You can get this from your broker somehow). This indicator helps you to define trend and sometimes overbought/oversold prices during flat trend. Input Description: EMAperiod: Moving Average period used for indicator. Must be higher than 1. ATRperiod: Average True Range period used for indicator. Must be higher than 1. multiplier: Multiplier used for determine channel's wide. Must be higher than 0 but may not b
FREE

CYCLE WAVE OSCILLATOR indicator is an indicator based on cyclical price fluctuations. This indicator can help you determine overbought and oversold levels, and help you predict price trends within the cycle. MT5 Version here! You can combine it with our indicators below to make your trading decisions more accurate: Supply Demand Ribbon MT4 Basic
Feature: - Three Trend Types: + Zero + Basic + Advanced
FREE
Thank you for your interest in "Goldfish Indicator". I have been trading since 2008. I usually trade on Renko chart in reversal pattern with Goldfish Indicator. If you share your vps details with me, I will connect your account (Live/Demo). To get proper results copy my trades for at least 30 days. Minimum Deposit: $1000 Leverage: 100:1 Profit Target: Monthly average profit target is 10% to 20%+/- Draw-down: The average drawdown is 10% to 20% Risk
Warning: Trading financial products on margin
FREE
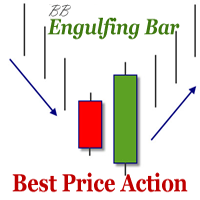
The indicator defines the Bullish and Bearish Engulfing Bar. The pattern has greater reliability when the open price of the engulfing candle is well above the close of the first candle, and when the close of the engulfing candle is well below the open of the first candle. For an engulfing bar to be valid it must fully engulf at least one previous bar or candle - includes all the body and the wick. The engulfing bar can engulf more than one bar as long as it completely engulfs the previous bar.
FREE

Ichimoku Trend Alert is the Ichimoku Kinko Hyo indicator with Alerts and signal filters.
Ichimoku Trend Alert features: Optional check of Ichimoku cloud, Tenkan sen(Conversion Line), Kijun sen(Base Line), Senkou span A, Senkou span B, and Chikou span relative to price, and more. Popup, email, and phone notification alerts for selected symbols and timeframes.
There are 9 classic Ichimoku trend filters you can enable/disable in settings: Price/Cloud Order: Checks the price position relative to
FREE

The indicator displays price distribution on a horizontal histogram. Horizontal histogram help find out key levels of price so that you can make good decision on setting point of take profit, stop loss... You can improve exist trading strategy or get new trading idea with the histogram of price.
Outstanding features Support multiple time frame : you can choose to work with history data in any time frame you want. It does not depend on current display time frame.
Support weighting by volume a
FREE

Detect strength for uptrends and downtrends by tracking Buy Power and Sell Power. Stay on the right side of the market by being able to determine whether the market is in a bull or bear trend and how strong the trend is.
Free download for a limited time! We hope you enjoy, with our very best wishes during this pandemic!
Trend Trigger Factor aims to ride out sideways movement, while positioning the trader in the correct side of the market to capture big trends when they occur. It was orig
FREE

RECOMMEHDATION Trade with this indicator for 2-3 weeks and you will feel significant progress in your trading. This indicator is developed based on the use of HMA, Laguerre, CCI . Indicator will help you: accurately enter the market; reduce the number of errors when opeinng orders; visually see market movement; predict price movement(in absent of significant news); do not rush to close profitable trades prematurely and increase profit; do not rush to enter the market and wait for "easy prey".
FREE

This indicator calculates buy and sell signals by using MACD indicator on two timeframes. MACD is a trend-following showing the relationship between two moving averages of the closing price. The MACD is calculated by subtracting the 26-period Exponential Moving Average (EMA) from the 12-period EMA.The result of that calculation is the MACD line. A nine-day EMA of the MACD called the "signal line".
This indicator has 2 modes to calculate the buy/sell signals: - MACD crosses 0 line - MACD cro
FREE

It is a custom non-repaint indicator to identify trade opportunities in swing action as prices move within an upper and lower band. Inspired by the Keltner Channel, the most popular channel Indicator introduced by Chester Keltner. It is different with a Bollinger Bands. It represents volatility using the high and low prices, while Bollinger's studies rely on the standard deviation. The algorithm for this indicator is also available in the EntryMaximator EA. Including the option to use it or not.
FREE

和谐图案最适合预测市场转折点。和谐图案为您提供高胜率和一天内的高交易机会。 该指标识别了最受欢迎的和谐图案,这些图案预测市场反转点。 基于和谐交易书籍。 重要说明: 该指标不会重绘或滞后(它在D点检测到模式);它不会重新绘制(模式要么有效,要么取消)。 使用方法: 将指标拖放到您的MT5图表上。 将模式检测设置为TRUE(ABCD; Gartley)。 根据您的喜好调整偏差(较大的偏差=更多的模式;较小的偏差=更少的模式)。 根据您的喜好自定义颜色。 根据需要启用或禁用关于入场点、TP和SL的警报。 检测到模式时: 该算法在D点检测到模式。 如果启用了警报,它将通知您检测到的模式。 如果模式无效,则触发一个带有“模式已取消”消息的警报。 成功的模式在蜡烛关闭时触发“入场警报”。 如果价格达到TP1、TP2、TP3、TP4或SL,则会发出带有终端消息的警报。 价格现在为40美元,仅剩下几份副本,最终价格将为70美元。 发展计划: 该指标的当前版本(1.1)将检测Gartley和ABCD模式。 版本1.1将包括Butterfly、Bat和Crab模式。 未来版本将包括其他模式、潜在PRZ检
FREE

Scalping indicator. It takes into account volatility, price movement in the local interval and the direction of the current trend. Recommended timeframe - M5. Advantages: Low volatility when a signal appears ensures minimal movement against an open position. The indicator does not redraw its signals. There are alert signals. It is a great tool for day trading.
Settings: Name Description Period Indicator period Range of each bar in the period (pp.) The maximum size of each candle in the indicat
FREE

交易实用必备工具指标 波浪自动计算指标,通道趋势交易 完美的趋势-波浪自动计算通道计算 , MT4版本 完美的趋势-波浪自动计算通道计算 , MT5版本 本地跟单复制交易 Easy And Fast Copy , MT4版本 Easy And Fast Copy , MT5版本 本地跟单复制交易 模拟试用 Easy And Fast Copy , MT4 模拟账号运行 Easy And Fast Copy , MT5 模拟账号运行 砖图PRO->>> 砖图在主图上的显示 .
砖形图因为比较理想地剔除掉了价格毛刺,因此,看上去令人感觉非常舒服。特别是, 在其上建立基于形态的交易系统看起来非常理想。 比如,如果我们打算使用趋势线,我们会经常发现,有些趋势线的突破并没有多大的意义,它不过是在震荡而已。荡着荡着,趋势线就突破了。而使用砖形图就可以有效地避免类似的尴尬。
FREE

FVG Fair Value Gap is an indicator that plot rectangle for last found fair value gap. There will be a total of eight fair value gaps. Four is bullish fair value gaps and another four is bearish fair value gaps. Bullish Fair Value Gaps Top Bullish/Bearish Fair Value Gap is the gap that will obey the "Recent candles" and "Nearby Size In Pips" parameters. This fair value gap will be above current price. Bottom Bullish/Bearish Fair Value Gap is the gap that will obey the "Recent candles" and "Nearb
FREE

Market Profile 3 MetaTrader 4 indicator — is a classic Market Profile implementation that can show the price density over time, outlining the most important price levels, value area, and control value of a given trading session. This indicator can be attached to timeframes between M1 and D1 and will show the Market Profile for daily, weekly, monthly, or even intraday sessions. Lower timeframes offer higher precision. Higher timeframes are recommended for better visibility. It is also possible t
FREE

Trend arrow Indicator is an arrow Indicator used as an assistant tool for your trading strategy. The indicator analyzes the standard deviation of bar close for a given period and generates a buy or sell signals if the deviation increases. It good to combo with Martingale EA to follow Trend and Sellect Buy Only/Sell Only for EA work Semi-Automatic.
You can use this Indicator with any EAs in my Products.
FREE
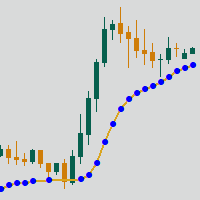
Adaptive Moving Average (AMA) is a trend indicator using moving average and market noise filter. Indicator feature are blue and red points, showing the power of trend. Recommendations for trading: Auxiliary Indicator Detecting trend Detecting power of trend Detecting potential reversal points Main indicator Shows entry points for swing trading Serves as dynamic support and resistance Recommendations for use: Any instrument Any timeframe Input parameters: Period - AMA period Fast Period - fast
FREE

Dark Inversion is an Indicator for intraday trading. This Indicator is based on Counter Trend strategy but use also Volatility. We can enter in good price with this Indicator, in order to follow the inversions on the current instrument. Hey, I made an Expert Advisor based on this indicator, if you are interested: Dark Titan
Key benefits
Easily visible Inversion Lines Intuitive directional arrows Automated adjustment for each timeframe and instrument Easy to use even for beginners Never rep
FREE

Check my p a id tools they work perfect! "Period Cross RSI" Is a New indicator idea that shows crosses of two RSI lines with different periods which creates ascending and descending zones for confirmation of long and short trading. This indicator is brend new and will be upgraded further, for now I recommend to use it as a confirmation, filter indicator for determination of long/short trading zones, not as a signaler indicator for now. Further upgrades can make it as a signaler indicator as w
FREE

该指标将为您绘制以下级别:
日线开盘线:下方为看跌行情,上方为看涨行情。 平均每日范围高点和低点 亚洲市场高低 昨天的高点和低点 这些水平是每个人都需要关注的强大支撑位和阻力位。
如果你没有利用时间开始! 当价格接近这些水平时,您需要注意!
享受交易变得更简单! Gāi zhǐbiāo jiāng wèi nín huìzhì yǐxià jíbié:
Rì xiàn kāipán xiàn: Xiàfāng wéi kàndié hángqíng, shàngfāng wéi kànzhǎng hángqíng. Píngjūn měi rì fànwéi gāo diǎn hé dī diǎn yàzhōu shìchǎng gāodī zuótiān de gāo diǎn hé dī diǎn zhèxiē shuǐpíng shì měi gèrén dōu xūyào guānzhù de qiángdà zhīchēng wèi hé zǔlì wèi.
Rúguǒ nǐ méiyǒu lìyòng shíjiān kāishǐ! Dāng jiàg
FREE

Free automatic Fibonacci is an indicator that automatically plots a Fibonacci retracement based on the number of bars you select on the BarsToScan setting in the indicator. The Fibonacci is automatically updated in real time as new highest and lowest values appears amongst the selected bars. You can select which level values to be displayed in the indicator settings. You can also select the color of the levels thus enabling the trader to be able to attach the indicator several times with differe
FREE
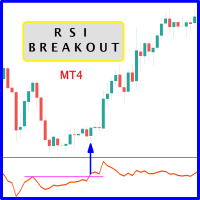
When prices breakout resistance levels are combined with Relative Strength Index "RSI" oscillator breaks out its historical resistance levels then probability emerges to record farther prices. It's strongly encouraged to confirm price breakout with oscillator breakout since they have comparable effects to price breaking support and resistance levels; surely, short trades will have the same perception. Concept is based on find swing levels which based on number of bars by each side to confi
FREE

Flow Trend BLACK FRIDAY: 50% DISCONT > OLD PRICE 100$ > NOW 50$
Flow trend is designed to detect the market trend with special calculation and a combination of Bolinger band and statistical moving period
to detect the market trend without frequency change and fault.
This indicator is designed with simple parameters to use fast and easy and helpful tools to trade in a pure direction and set your SL/TP with this indicator cloud system.
FREE

Calculating the number of lots needed so as to make sure you are risking a specific percent of account balance can be tedious. Luckily, there are websites that make this task a lot easier. This indicator takes things to the next level as it ensures you don’t have to leave the metatrader platform to perform these calculations.
The lot-size calculator is a simple calculator that works in all forex currency pairs, BTCUSD, US500, HK50 and XTIUSD. For more free stuff: http://abctrading.xyz
FREE

MT5 Version MA Ribbon MT4 MA Ribbon is an enhanced indicator with 8 moving averages of increasing periods. MA Ribbon is useful to recognize trend direction, reversals and continuation points in the market as well as potential entry, partial take profit and exit points. Entry points for long and shorts position can be found when the price entries or leaves the Ribbon, at retest or a defined number of MA crossovers. It offers a good combination with mostly any volume or momentun indicators to f
FREE
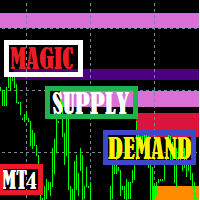
Magic Supply Demand Indicator works on all products and timeframes. It is a new formula, and the very new features are two zone strength functions adjustable by user input! This is a great advantage in trading. When you learn how to use the proprietary features such as the zone strength with min X-factor of price travel away, you will be able to tell whether the zone is strong or not.
The supply and demand zones are used as an alert trigger. You can use popup alert with sound on MetaTr
FREE
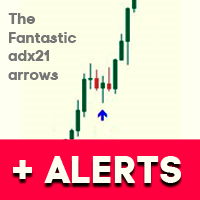
.See screenshots of the indicator. Uses information about the current trend. It is based on the classic ADX indicator. Gives a signal to enter a trade using a non-standard strategy.
Settings: Name Description Period of ADX The period of the classic ADX indicator Distance between +D & -D lines Distance between + D and -D lines . Determines the strength of the trend. Freshness of the signal (bars) Checking the freshness of a buy or sell signal.
Selects the very first signal in the span.
The nu
FREE
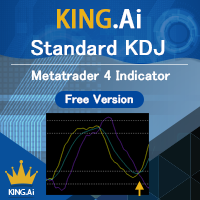
The standard KDJ indicator is presented by KING.Ai. This indicator were built base on the the theory of KDJ . KDJ is a very effective and useful strategy to trade especially in swing trading. Method to apply (please also refer to the graphic): 80/20 rule: Price from bottom to top 20 to 80. And price from top to bottom 80 to 20. Both is enter market signal. Indicator period: The indicator is made by period 9,3,3 KING.Ai Forex trader believe that such strategy must complement with other indicato
FREE
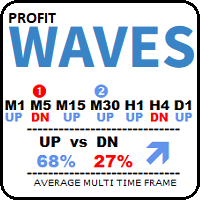
MT Rider
This MT Rider is a multi time frame trend indicator ... Based on a standard MACD , moving average convergence divergence indicator.
With just one glance at the chart, we can see the directions of all time intervals.The trend average is additionally displayed in percentages.
You often hear the experts: trade in the direction of the trend. But, you need to find the correct ratio, to trade on your time interval.
With this indicator you will eliminate all doubts. This indicator from
FREE

"BIG FIGURE INDICATOR" automatically identifies and draws horizontal lines on price charts at specific levels, such as whole numbers or half-numbers (e.g., 1.0000 or 1.5000 in currency trading). These levels are considered psychologically significant because they represent round numbers that big traders and investors may focus on, leading to potential support or resistance levels. The big figure indicator can help traders identify important price levels and make trading decisions based on these
FREE

MACD divergence indicator finds divergences between price chart and MACD indicator and informs you with alerts (popup, mobile notification or email). Its main use is to find trend reversals in the chart. Always use the divergence indicators with other technical assets like support resistance zones, candlestick patterns and price action to have a higher possibility to find trend reversals. Three confirmation type for MACD divergences: MACD line cross zero level Price returns to previous H/L Creat
FREE

該指標可有效地將外匯市場的交易量分為看漲和看跌兩類。 此外,它還提供了計算和顯示您所選擇的任何時期的看漲和看跌交易量總和的功能。 您可以移動圖表上的兩條藍線,輕鬆調整時段,從而根據您的交易需求定制精確的交易量分析。 如果您覺得它有用,我們將感謝您的評論! 交易愉快 該指標可有效地將外匯市場的交易量分為看漲和看跌兩類。 此外,它還提供了計算和顯示您所選擇的任何時期的看漲和看跌交易量總和的功能。 您可以移動圖表上的兩條藍線,輕鬆調整時段,從而根據您的交易需求定制精確的交易量分析。 如果您覺得它有用,我們將感謝您的評論! 交易愉快 該指標可有效地將外匯市場的交易量分為看漲和看跌兩類。 此外,它還提供了計算和顯示您所選擇的任何時期的看漲和看跌交易量總和的功能。 您可以移動圖表上的兩條藍線,輕鬆調整時段,從而根據您的交易需求定制精確的交易量分析。 如果您覺得它有用,我們將感謝您的評論! 交易愉快
FREE
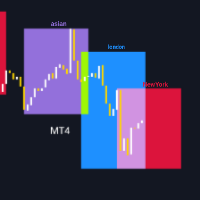
TradingSessionVisualizer – 交易者的必备工具! 在深入了解此指标的功能之前,请 评分 此产品, 留下评论 以分享您的体验,并 订阅 我的页面,以便随时了解最新的发布和工具。您的支持非常宝贵,帮助我不断改进我的创作! 描述: TradingSessionVisualizer 是一款强大的 MetaTrader 4 指标,旨在为您的图表提供清晰且可自定义的主要交易时段可视化。该工具允许您轻松区分亚洲、伦敦和纽约交易时段,帮助您更好地理解这些关键时期的市场走势。 主要功能: 交易时段显示: 使用彩色矩形在图表上清晰地可视化亚洲、伦敦和纽约的交易时段。 可自定义参数: 调整每个时段的颜色、线条宽度以及矩形是否填充。 动态显示: 指标会根据您选择显示的天数自动调整(最多可显示 3 天)。 易于管理: 该代码有效管理图形对象,删除旧的对象并更新新的对象。 指标参数: 天数数量: 显示最多 3 天的时段。 颜色和样式: 自定义时段的颜色和矩形边框样式。 矩形填充: 选择矩形是否应填充或仅显示边框。 使用方法: 安装: 下载并将指标安装到 MetaTrader 4 的指标文件
FREE

Murray 的数学水平基于江恩的观察和他的价格平方理论。 根据江恩的说法,价格在该范围的 1/8 内波动。 这些 1/8 使我们能够为给定的图表获得不同的阻力位和支撑位,它们各有特点。 在突破 -2 或 +2 水平或波动性下降后,它们会重建。 您可以选择要显示的时间段(当前或整个历史记录)。 所有线条都通过缓冲区绘制。 Blog-Link - Murrey Math Trading with UPD1
输入参数 。
Period - 计算范围 。 History - 历史 (Current / All) 。 Bars Count - 线长 。
Visual Button - 按钮显示(启用/禁用) 。 Corner - 按钮锚定角度 。 X indent - 以像素为单位的水平填充 。 Y indent - 以像素为单位的垂直填充 。
Label Visual - 显示级别标签 。 Label Font Size - 字体大小 。 Label Shift Bars - 在酒吧的铭文的缩进 。 Label Tooltip - 在关卡上方的光标
FREE
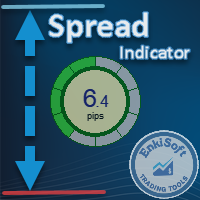
Custom Spread Indicator *Please write a review, thanks!
Also MT5 version is available
Spread Indicator show the current spread in pips with color codes. Handle 3 levels, Low, Medium, High. You can set levels and colors for each level (eg. Low: Green, Medium: Orange, High: Red), and can choose display position on the chart.
There is two spread calculation mode: -> Server spread value -> Ask - Bid value
Can set opacity, for better customization. When spread jump bigger, then display do
FREE
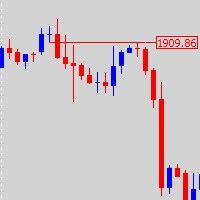
This is a combine that combines the ATR, Candle Timer, Watermark indicators and a tool for working with graphical objects, which allows you to reduce the time for marking charts. Functionality: Levels and proteins with price tags; drawing strictly horizontal levels; continuous zigzag manually; expansion / truncation of lines, wrinkles; quick change of colors and fonts and shapes; Filling/removing the filling of vessels, triangles, ellipses; dragging by 1 (first) point and auto alignment of the h
FREE
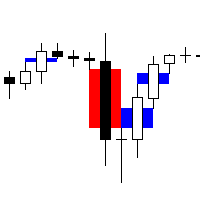
Fair Value Gap Scanner 4 is a sophisticated MetaTrader 5 indicator designed to detect fair value gaps (FVGs) in price action and display them as rectangles directly on the chart. This powerful tool empowers traders by providing visual representations of FVGs, enabling them to identify potential trading opportunities with ease and precision. With customizable parameters for color, width, and style, traders can tailor the indicator's appearance to suit their preferences and trading strategies. Key
FREE

BeST Oscillators Collection is a Composite MT4 Indicator including the Chaikin,Chande and TRIX Oscillators which by default are contained in MT5 but not in MT4 platform. It also provides the option of displaying or not a Mov. Avg. as a Signal Line and the resulting Signals as Arrows in a Normal (all arrows) or in a Reverse Mode (without showing up any resulting successive and of same type arrows). Analytically for each one of the specific Oscillators: The Chaikin Oscillator ( CHO ) is
FREE

Tipu Heikin-Ashi Panel is the modified version of the original Heiken Ashi indicator published by MetaQuotes here . A professional version of this indicator is available here .
Features An easy to use Panel that shows the Heiken Ashi trend of selected timeframe. Customizable Buy/Sell alerts, push alerts, email alerts, or visual on-screen alerts. Customizable Panel. The panel can be moved to any place on the chart or minimized to allow more space. Heikin means "the average", and Ashi means "foo
FREE

YOU CAN NOW DOWNLOAD FREE VERSIONS OF OUR PAID INDICATORS . IT'S OUR WAY OF GIVING BACK TO THE COMMUNITY ! >>> GO HERE TO DOWNLOAD
V1 Scalper is an easy to use tool designed for trend scalping. It tries to spot good entry points in a major trend by using swing high and lows formed along the trend . This tool can be used on Fx Pairs , Indices , Commodities and stocks. Not often but in some signals , the arrow might repaint on the current candle so extra confirmation tools are advised for t
FREE

Este indicador irá ajudá-lo a traçar as linhas do horizonte ( Marcelo Ferreira ) do Grafico semanal. Você poderá mudar trabalhar por exemplo em M5 ou M15. As linhas semanais permanecerão lá. Analisar as tendências em gráficos semanais antes de fazer uma entrada no mercado Forex é essencial para identificar a direção predominante do mercado a longo prazo. Esse tipo de análise ajuda a evitar decisões impulsivas baseadas em flutuações de curto prazo e fornece uma visão mais clara sobre o movimento
FREE
Optimize your trading strategy of your custom indicators with the "Indicator Combiner Into One Indicator". This advanced tool combines multiple indicators, including your custom indicators, into a single, user-friendly interface. It generates an arrow signal based on your custom indicators, simplifying your decision-making process. Ideal for traders of all levels, this indicator offers:
Arrow Signals : Get a clear, single arrow signal that combines insights from your custom indicators, m
FREE
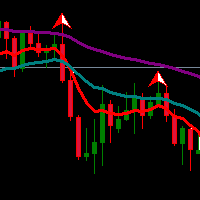
Exponential Moving Average (EMA) is an indicator that often be used by traders. Combination of two or three EMA indicators often applied to determine trend direction. Multiple EMA combined with fractals or oscillator indicator to detect overbought/oversold and divergence point also great to do in trading system.
If you like EMA indicator and want to get better indicator, highly recommended using EMA SuperTrend Strategy Indicator if you want to get better result in here:
https://www.mql5.com/
FREE

I made this Alligator Indicator with a multi time frame concept where friends can directly use the signals that appear with reference if D1 / H4 a Buy Signal appears then check the trend line breakout / Fibo Weasel CBR We use the Risk Reward Lvl Fibo Musang CBR For this indicator, I only opened 2 signals, namely Multi Time Frame H4 and D1 only For the full time version of D1 to M5 signals, I paid for it and even if it's free, it has to be under my IB line https://linktr.ee/ARFX_ZONE Hopefull
FREE
您知道为什么MetaTrader市场是出售交易策略和技术指标的最佳场所吗?不需要广告或软件保护,没有支付的麻烦。一切都在MetaTrader市场提供。
您错过了交易机会:
- 免费交易应用程序
- 8,000+信号可供复制
- 探索金融市场的经济新闻
注册
登录