Articles on the MQL5 programming and use of technical indicators
Technical indicators constitute an important part of trading, and every trader tries to find something new. The authors of these articles talk about econometrics and machine learning, automatic marking of Elliott Waves and digital filters - everything from the classical methods of analysis to the modern interpretation of classical ideas.
The category features articles that will teach you how to develop a custom indicator and contains unique collections of ready-to-use mathematically explained William Blau's trading ideas.
Add a new article

You are missing trading opportunities:
- Free trading apps
- Over 8,000 signals for copying
- Economic news for exploring financial markets
Registration
Log in
You agree to website policy and terms of use
If you do not have an account, please register

Timeseries in DoEasy library (part 50): Multi-period multi-symbol standard indicators with a shift
In the article, let’s improve library methods for correct display of multi-symbol multi-period standard indicators, which lines are displayed on the current symbol chart with a shift set in the settings. As well, let’s put things in order in methods of work with standard indicators and remove the redundant code to the library area in the final indicator program.

Building a Keltner Channel Indicator with Custom Canvas Graphics in MQL5
In this article, we build a Keltner Channel indicator with custom canvas graphics in MQL5. We detail the integration of moving averages, ATR calculations, and enhanced chart visualization. We also cover backtesting to evaluate the indicator’s performance for practical trading insights.

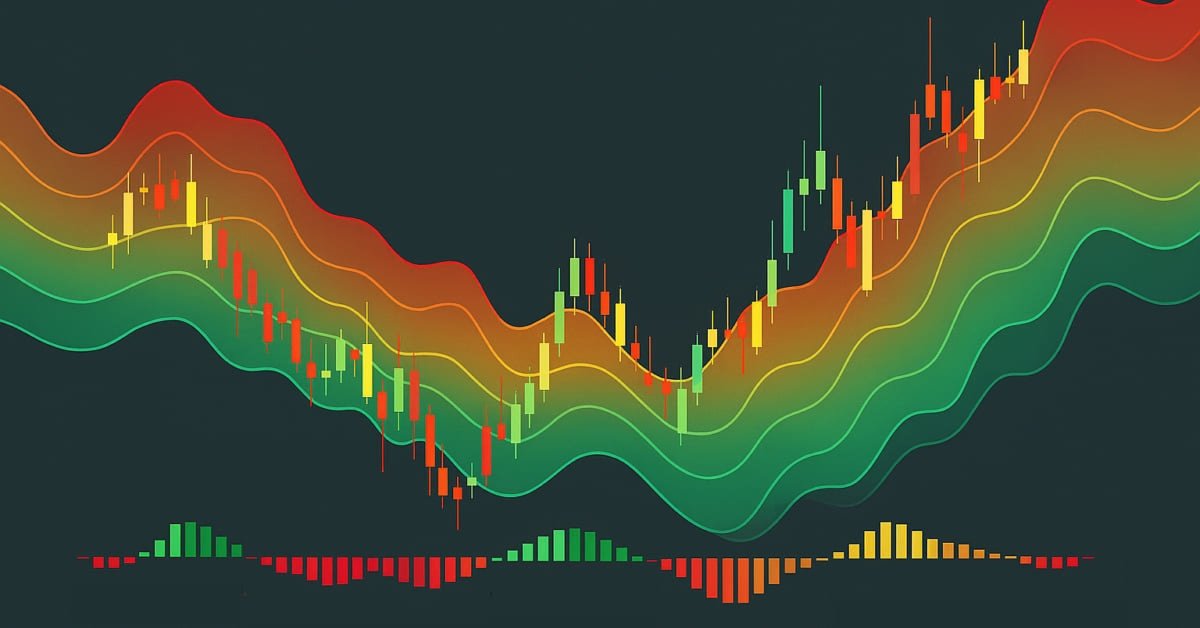
MQL5 Wizard Techniques you should know (Part 84): Using Patterns of Stochastic Oscillator and the FrAMA - Conclusion
The Stochastic Oscillator and the Fractal Adaptive Moving Average are an indicator pairing that could be used for their ability to compliment each other within an MQL5 Expert Advisor. We introduced this pairing in the last article, and now look to wrap up by considering its 5 last signal patterns. In exploring this, as always, we use the MQL5 wizard to build and test out their potential.

From Novice to Expert: Parameter Control Utility
Imagine transforming the traditional EA or indicator input properties into a real-time, on-chart control interface. This discussion builds upon our foundational work in the Market Periods Synchronizer indicator, marking a significant evolution in how we visualize and manage higher-timeframe (HTF) market structures. Here, we turn that concept into a fully interactive utility—a dashboard that brings dynamic control and enhanced multi-period price action visualization directly onto the chart. Join us as we explore how this innovation reshapes the way traders interact with their tools.

MQL5 Wizard Techniques you should know (Part 56): Bill Williams Fractals
The Fractals by Bill Williams is a potent indicator that is easy to overlook when one initially spots it on a price chart. It appears too busy and probably not incisive enough. We aim to draw away this curtain on this indicator by examining what its various patterns could accomplish when examined with forward walk tests on all, with wizard assembled Expert Advisor.

Building A Candlestick Trend Constraint Model (Part 7): Refining our model for EA development
In this article, we will delve into the detailed preparation of our indicator for Expert Advisor (EA) development. Our discussion will encompass further refinements to the current version of the indicator to enhance its accuracy and functionality. Additionally, we will introduce new features that mark exit points, addressing a limitation of the previous version, which only identified entry points.

MQL5 Wizard Techniques you should know (Part 46): Ichimoku
The Ichimuko Kinko Hyo is a renown Japanese indicator that serves as a trend identification system. We examine this, on a pattern by pattern basis, as has been the case in previous similar articles, and also assess its strategies & test reports with the help of the MQL5 wizard library classes and assembly.

Price Action Analysis Toolkit Development (Part 40): Market DNA Passport
This article explores the unique identity of each currency pair through the lens of its historical price action. Inspired by the concept of genetic DNA, which encodes the distinct blueprint of every living being, we apply a similar framework to the markets, treating price action as the “DNA” of each pair. By breaking down structural behaviors such as volatility, swings, retracements, spikes, and session characteristics, the tool reveals the underlying profile that distinguishes one pair from another. This approach provides more profound insight into market behavior and equips traders with a structured way to align strategies with the natural tendencies of each instrument.

Price Action Analysis Toolkit Development (Part 14): Parabolic Stop and Reverse Tool
Embracing technical indicators in price action analysis is a powerful approach. These indicators often highlight key levels of reversals and retracements, offering valuable insights into market dynamics. In this article, we demonstrate how we developed an automated tool that generates signals using the Parabolic SAR indicator.

Mastering Kagi Charts in MQL5 (Part I): Creating the Indicator
Learn how to build a complete Kagi Chart engine in MQL5—constructing price reversals, generating dynamic line segments, and updating Kagi structures in real time. This first part teaches you how to render Kagi charts directly on MetaTrader 5, giving traders a clear view of trend shifts and market strength while preparing for automated Kagi-based trading logic in Part 2.

Encoding Candlestick Patterns (Part 2): Modeling Price Action as an Ordered Sequence
Developing permutation-based tools in MQL5 provides a systematic way to analyze candlestick pattern combinations for trading strategies. This article introduces a permutation calculator and generator designed to compute and enumerate all possible ordered candlestick sequences from bullish and bearish sets, with or without repetition. By generating exhaustive pattern combinations, traders can perform data-driven analysis to identify high-probability market patterns and improve decision-making in automated trading systems.

Do Traders Need Services From Developers?
Algorithmic trading becomes more popular and needed, which naturally led to a demand for exotic algorithms and unusual tasks. To some extent, such complex applications are available in the Code Base or in the Market. Although traders have simple access to those apps in a couple of clicks, these apps may not satisfy all needs in full. In this case, traders look for developers who can write a desired application in the MQL5 Freelance section and assign an order.

Developing Trading Strategy: Pseudo Pearson Correlation Approach
Generating new indicators from existing ones offers a powerful way to enhance trading analysis. By defining a mathematical function that integrates the outputs of existing indicators, traders can create hybrid indicators that consolidate multiple signals into a single, efficient tool. This article introduces a new indicator built from three oscillators using a modified version of the Pearson correlation function, which we call the Pseudo Pearson Correlation (PPC). The PPC indicator aims to quantify the dynamic relationship between oscillators and apply it within a practical trading strategy.

Simple solutions for handling indicators conveniently
In this article, I will describe how to make a simple panel to change the indicator settings directly from the chart, and what changes need to be made to the indicator to connect the panel. This article is intended for novice MQL5 users.

Building A Candlestick Trend Constraint Model (Part 5): Notification System (Part I)
We will breakdown the main MQL5 code into specified code snippets to illustrate the integration of Telegram and WhatsApp for receiving signal notifications from the Trend Constraint indicator we are creating in this article series. This will help traders, both novices and experienced developers, grasp the concept easily. First, we will cover the setup of MetaTrader 5 for notifications and its significance to the user. This will help developers in advance to take notes to further apply in their systems.
MQL5 Wizard Techniques you should know (Part 75): Using Awesome Oscillator and the Envelopes
The Awesome Oscillator by Bill Williams and the Envelopes Channel are a pairing that could be used complimentarily within an MQL5 Expert Advisor. We use the Awesome Oscillator for its ability to spot trends, while the envelopes channel is incorporated to define our support/resistance levels. In exploring this indicator pairing, we use the MQL5 wizard to build and test any potential these two may possess.

Formulating Dynamic Multi-Pair EA (Part 2): Portfolio Diversification and Optimization
Portfolio Diversification and Optimization strategically spreads investments across multiple assets to minimize risk while selecting the ideal asset mix to maximize returns based on risk-adjusted performance metrics.

From Novice to Expert: Detecting Liquidity Zone Flips Using MQL5
This article presents an MQL5 indicator that detects and manages liquidity zone flips. It identifies supply and demand zones from higher timeframes using a base–impulse pattern, applies objective breakout and impulse thresholds, and flips zones automatically when structure changes. The result is a dynamic support‑resistance map that reduces manual redraws and gives you clear, actionable context for signals and retests.

Angle-based operations for traders
This article will cover angle-based operations. We will look at methods for constructing angles and using them in trading.

Building the Market Structure Sentinel Indicator in MQL5
This article builds a Market Structure Sentinel indicator in MQL5 that detects and visualizes Smart Money Concepts (SMC) events, including Break of Structure (BOS) and Change of Character (CHOCH), in real time. It explains swing detection, structural validation, and trend classification, and adds a compact dashboard to track bullish, bearish, or ranging states for faster on‑chart interpretation.
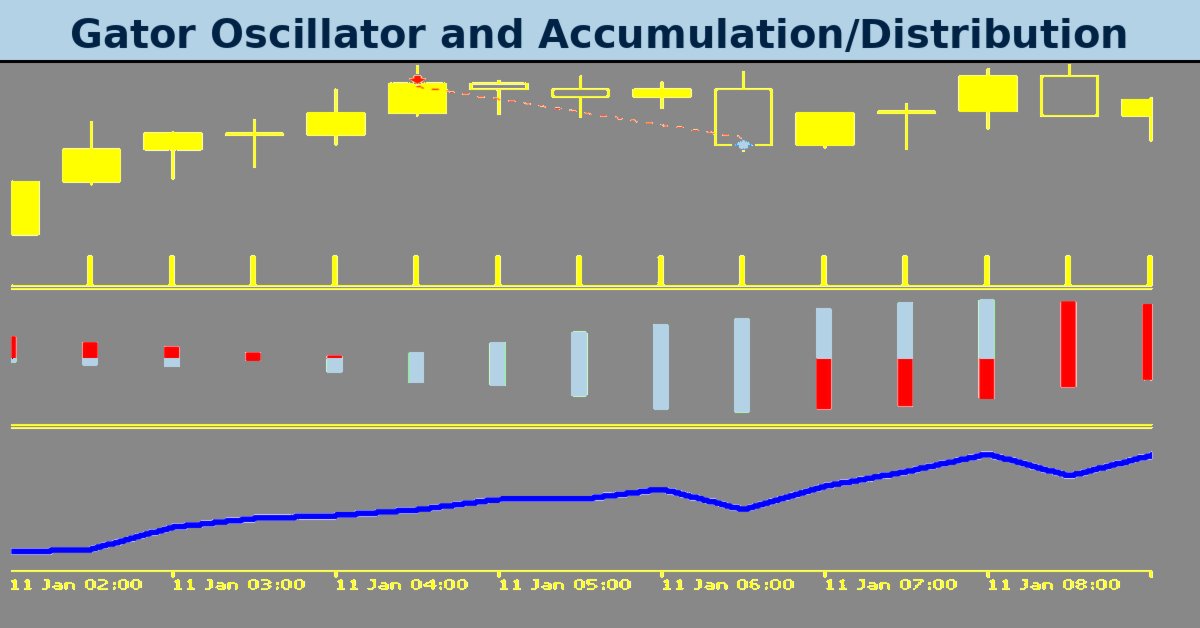
MQL5 Wizard Techniques you should know (Part 77): Using Gator Oscillator and the Accumulation/Distribution Oscillator
The Gator Oscillator by Bill Williams and the Accumulation/Distribution Oscillator are another indicator pairing that could be used harmoniously within an MQL5 Expert Advisor. We use the Gator Oscillator for its ability to affirm trends, while the A/D is used to provide confirmation of the trends via checks on volume. In exploring this indicator pairing, as always, we use the MQL5 wizard to build and test out their potential.

Creating Custom Indicators in MQL5 (Part 11): Enhancing the Footprint Chart with Market Structure and Order Flow Layers
This article extends the MQL5 footprint chart with market-structure and order-flow layers: volume-profile bars, point of control, value-area highlighting, stacked imbalance detection, absorption zones, and single-print/unfinished markers. We expand bar data structures, add functions for POC/value area, imbalance, and absorption, and build a fixed-order rendering pipeline. You will get ready-to-use inputs, metadata, and drawing utilities to integrate and customize these layers in your indicator.

MQL5 Wizard Techniques you should know (Part 64): Using Patterns of DeMarker and Envelope Channels with the White-Noise Kernel
The DeMarker Oscillator and the Envelopes' indicator are momentum and support/ resistance tools that can be paired when developing an Expert Advisor. We continue from our last article that introduced these pair of indicators by adding machine learning to the mix. We are using a recurrent neural network that uses the white-noise kernel to process vectorized signals from these two indicators. This is done in a custom signal class file that works with the MQL5 wizard to assemble an Expert Advisor.
Price Action Analysis Toolkit Development (Part 22): Correlation Dashboard
This tool is a Correlation Dashboard that calculates and displays real-time correlation coefficients across multiple currency pairs. By visualizing how pairs move in relation to one another, it adds valuable context to your price-action analysis and helps you anticipate inter-market dynamics. Read on to explore its features and applications.

Chaos theory in trading (Part 2): Diving deeper
We continue our dive into chaos theory in financial markets. This time I will consider its applicability to the analysis of currencies and other assets.

Market Simulation (Part 14): Sockets (VIII)
Many programmers might assume we should abandon using Excel and move directly to Python, using some packages that allow Python to generate an Excel file for later analysis of results. However, as mentioned in the previous article, although this solution is the simplest for many programmers, it will not be accepted by some users. And in this particular case, the user is always right. As programmers, we must find a way to make everything work.

Design Patterns in software development and MQL5 (Part 2): Structural Patterns
In this article, we will continue our articles about Design Patterns after learning how much this topic is more important for us as developers to develop extendable, reliable applications not only by the MQL5 programming language but others as well. We will learn about another type of Design Patterns which is the structural one to learn how to design systems by using what we have as classes to form larger structures.

Price Action Analysis Toolkit Development (Part 8): Metrics Board
As one of the most powerful Price Action analysis toolkits, the Metrics Board is designed to streamline market analysis by instantly providing essential market metrics with just a click of a button. Each button serves a specific function, whether it’s analyzing high/low trends, volume, or other key indicators. This tool delivers accurate, real-time data when you need it most. Let’s dive deeper into its features in this article.
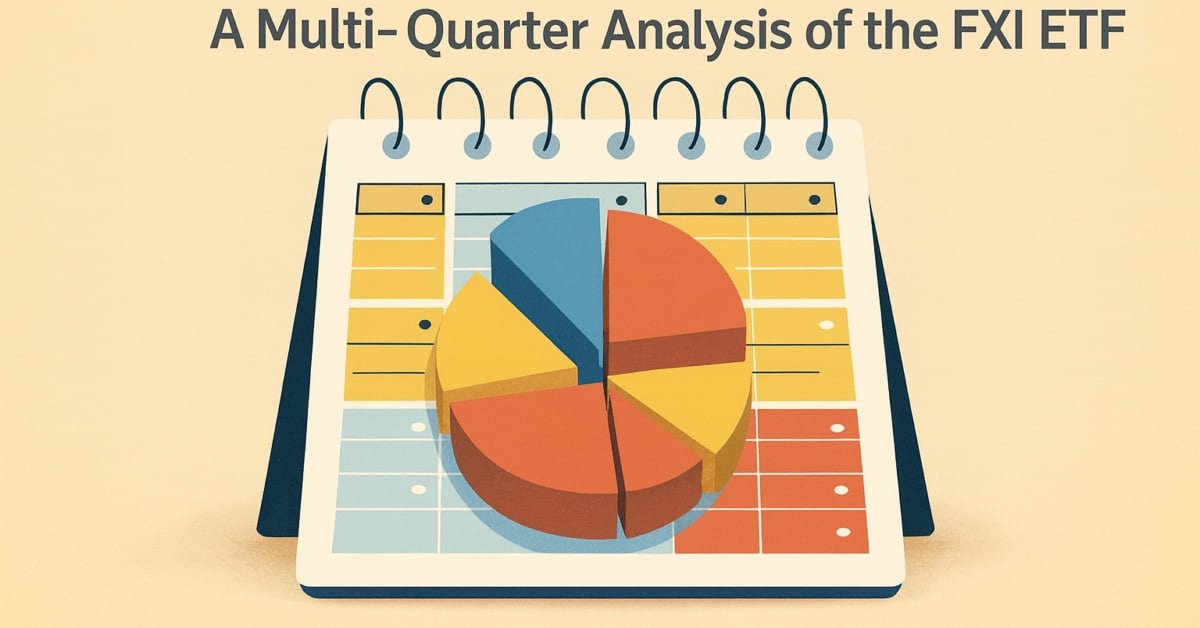
Codex Pipelines: From Python to MQL5 for Indicator Selection — A Multi-Quarter Analysis of the FXI ETF
We continue our look at how MetaTrader can be used outside its forex trading ‘comfort-zone’ by looking at another tradable asset in the form of the FXI ETF. Unlike in the last article where we tried to do ‘too-much’ by delving into not just indicator selection, but also considering indicator pattern combinations, for this article we will swim slightly upstream by focusing more on indicator selection. Our end product for this is intended as a form of pipeline that can help recommend indicators for various assets, provided we have a reasonable amount of their price history.

Building A Candlestick Trend Constraint Model (Part 4): Customizing Display Style For Each Trend Wave
In this article, we will explore the capabilities of the powerful MQL5 language in drawing various indicator styles on Meta Trader 5. We will also look at scripts and how they can be used in our model.

Elastic net regression using coordinate descent in MQL5
In this article we explore the practical implementation of elastic net regression to minimize overfitting and at the same time automatically separate useful predictors from those that have little prognostic power.

Price Action Analysis Toolkit Development (Part 37): Sentiment Tilt Meter
Market sentiment is one of the most overlooked yet powerful forces influencing price movement. While most traders rely on lagging indicators or guesswork, the Sentiment Tilt Meter (STM) EA transforms raw market data into clear, visual guidance, showing whether the market is leaning bullish, bearish, or staying neutral in real-time. This makes it easier to confirm trades, avoid false entries, and time market participation more effectively.

Building A Candlestick Trend Constraint Model (Part 5): Notification System (Part III)
This part of the article series is dedicated to integrating WhatsApp with MetaTrader 5 for notifications. We have included a flow chart to simplify understanding and will discuss the importance of security measures in integration. The primary purpose of indicators is to simplify analysis through automation, and they should include notification methods for alerting users when specific conditions are met. Discover more in this article.

MQL5 Wizard Techniques you should know (Part 57): Supervised Learning with Moving Average and Stochastic Oscillator
Moving Average and Stochastic Oscillator are very common indicators that some traders may not use a lot because of their lagging nature. In a 3-part ‘miniseries' that considers the 3 main forms of machine learning, we look to see if this bias against these indicators is justified, or they might be holding an edge. We do our examination in wizard assembled Expert Advisors.

Building a Volume Bubble Indicator in MQL5 Using Standard Deviation
The article demonstrates how to build a Volume Bubble Indicator in MQL5 that visualizes market activity using statistical normalization. It covers how to work with tick and real volume, compute the mean and standard deviation over a rolling window, and normalize volume values to identify relative strength. You will implement chart objects to display bubbles with dynamic size and color, providing a clear representation of volume intensity directly on the chart.

Developing a Replay System — Market simulation (Part 10): Using only real data for Replay
Here we will look at how we can use more reliable data (traded ticks) in the replay system without worrying about whether it is adjusted or not.

Price Action Analysis Toolkit Development (Part 69): Flag Pattern Detection in MQL5
This article shows how to convert subjective flag recognition into reproducible MQL5 logic for live charts. It combines ATR-normalized pole strength, retracement limits, consolidation structure checks, breakout confirmation, and overlap control. Readers gain a workable approach that renders adaptive channels and zones, updates active setups efficiently, and provides optional alerts for newly confirmed patterns.

Creating Custom Indicators in MQL5 (Part 8): Adding Volume Integration for Deeper Market Profile Analysis
In this article, we enhance the hybrid Time Price Opportunity (TPO) market profile indicator in MQL5 by integrating volume data to calculate volume-based point of control, value areas, and volume-weighted average price with customizable highlighting options. The system introduces advanced features like initial balance detection, key level extension lines, split profiles, and alternative TPO characters such as squares or circles for improved visual analysis across multiple timeframes.

Elements of correlation analysis in MQL5: Pearson chi-square test of independence and correlation ratio
The article observes classical tools of correlation analysis. An emphasis is made on brief theoretical background, as well as on the practical implementation of the Pearson chi-square test of independence and the correlation ratio.
Price Action Analysis Toolkit Development (Part 69): Flag Pattern Detection in MQL5
This article shows how to convert subjective flag recognition into reproducible MQL5 logic for live charts. It combines ATR-normalized pole strength, retracement limits, consolidation structure checks, breakout confirmation, and overlap control. Readers gain a workable approach that renders adaptive channels and zones, updates active setups efficiently, and provides optional alerts for newly confirmed patterns.