Articles on the MQL5 programming and use of technical indicators
Technical indicators constitute an important part of trading, and every trader tries to find something new. The authors of these articles talk about econometrics and machine learning, automatic marking of Elliott Waves and digital filters - everything from the classical methods of analysis to the modern interpretation of classical ideas.
The category features articles that will teach you how to develop a custom indicator and contains unique collections of ready-to-use mathematically explained William Blau's trading ideas.
Add a new article

You are missing trading opportunities:
- Free trading apps
- Over 8,000 signals for copying
- Economic news for exploring financial markets
Registration
Log in
You agree to website policy and terms of use
If you do not have an account, please register

MQL5 Wizard Techniques you should know (Part 69): Using Patterns of SAR and the RVI
The Parabolic-SAR (SAR) and the Relative Vigour Index (RVI) are another pair of indicators that could be used in conjunction within an MQL5 Expert Advisor. This indicator pair, like those we’ve covered in the past, is also complementary since SAR defines the trend while RVI checks momentum. As usual, we use the MQL5 wizard to build and test any potential this indicator pairing may have.

Sigma Score Indicator for MetaTrader 5: A Simple Statistical Anomaly Detector
Build a practical MetaTrader 5 “Sigma Score” indicator from scratch and learn what it really measures: The z-score of log returns (how many standard deviations the latest move is from the recent average). The article walks through every code block in OnInit(), OnCalculate(), and OnDeinit(), then shows how to interpret thresholds (e.g., ±2) and apply the Sigma Score as a simple “market stress meter” for mean-reversion and momentum trading.

Adaptive Malaysian Engulfing Indicator (Part 2): Optimized Retest Bar Range
The article adds a self-adaptive layer to the Malaysian Engulfing indicator by optimizing the retest bar range with a constrained brute-force search scored by MFE and MAE. It details the data model, helper routines, and an MQL5 implementation that gathers historical setups, computes excursions, and selects the best parameter. Readers learn how to remove manual tuning and run the indicator with context-appropriate settings across symbols and timeframes.

How can century-old functions update your trading strategies?
This article considers the Rademacher and Walsh functions. We will explore ways to apply these functions to financial time series analysis and also consider various applications for them in trading.

Triangular and Sawtooth Waves: Analytical Tools for Traders
Wave analysis is one of the methods used in technical analysis. This article focuses on two less conventional wave patterns: triangular and sawtooth waves. These formations underpin a number of technical indicators designed for market price analysis.

Introduction to MQL5 (Part 22): Building an Expert Advisor for the 5-0 Harmonic Pattern
This article explains how to detect and trade the 5-0 harmonic pattern in MQL5, validate it using Fibonacci levels, and display it on the chart.

Codex Pipelines, from Python to MQL5, for Indicator Selection: A Multi-Quarter Analysis of the XLF ETF with Machine Learning
We continue our look at how the selection of indicators can be pipelined when facing a ‘none-typical’ MetaTrader asset. MetaTrader 5 is primarily used to trade forex, and that is good given the liquidity on offer, however the case for trading outside of this ‘comfort-zone’, is growing bolder with not just the overnight rise of platforms like Robinhood, but also the relentless pursuit of an edge for most traders. We consider the XLF ETF for this article and also cap our revamped pipeline with a simple MLP.

Creating Custom Indicators in MQL5 (Part 3): Multi-Gauge Enhancements with Sector and Round Styles
In this article, we enhance the gauge-based indicator in MQL5 to support multiple oscillators, allowing user selection through an enumeration for single or combined displays. We introduce sector and round gauge styles via derived classes from a base gauge framework, improving case rendering with arcs, lines, and polygons for a more refined visual appearance.
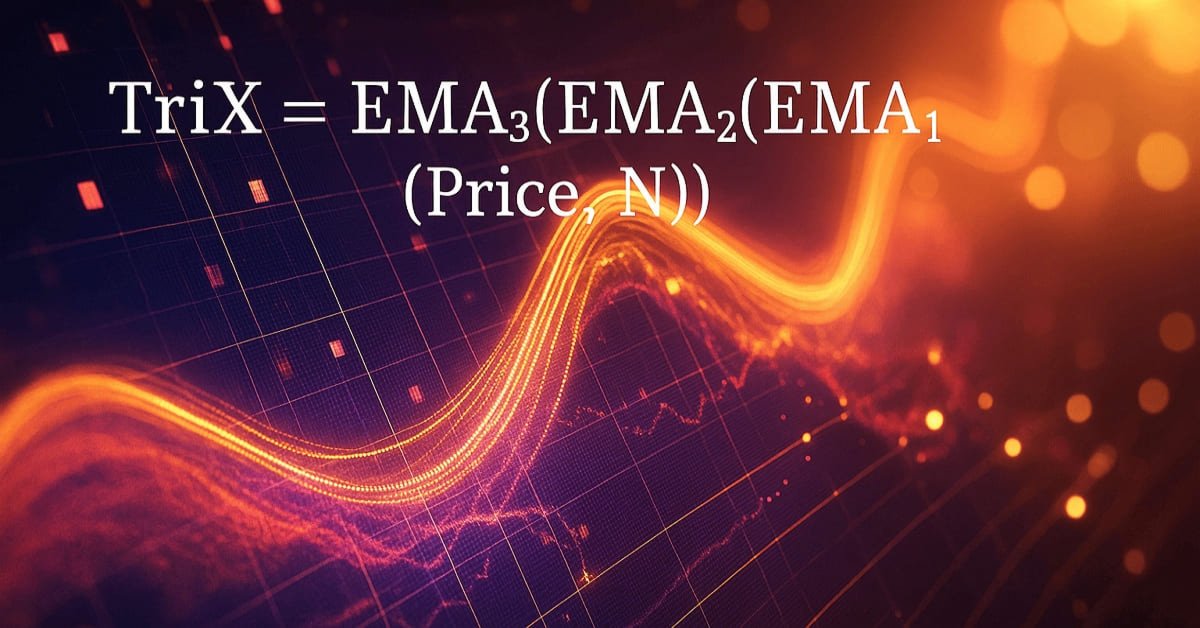
MQL5 Wizard Techniques you should know (Part 67): Using Patterns of TRIX and the Williams Percent Range
The Triple Exponential Moving Average Oscillator (TRIX) and the Williams Percentage Range Oscillator are another pair of indicators that could be used in conjunction within an MQL5 Expert Advisor. This indicator pair, like those we’ve covered recently, is also complementary given that TRIX defines the trend while Williams Percent Range affirms support and Resistance levels. As always, we use the MQL5 wizard to prototype any potential these two may have.

MQL5 Wizard Techniques You should know (Part 86): Speeding Up Data Access with a Sparse Table for a Custom Trailing Class
We revamp our earlier articles on testing trade setups with the MQL5 Wizard by putting a bit more emphasis on input data quality, cleaning, and handling. In the earlier articles we had looked at a lot of custom signal classes, usable by the wizard, so we now shift our focus to a custom trailing class, given that exiting is also a very important part in any trading system. Our broad theme for this particular piece data-efficiency and the O(1) range-query; the core ‘tech’ is MQL5, SQLite, Python-Polars; the Algorithm is the Sparse-Table while we will seek validation from the ATR Indicator.

Building an EquiVolume Indicator in MQL5
We implement an EquiVolume indicator in MQL5 that converts standard candlesticks into volume-weighted boxes. The workflow includes selecting volume type, detecting the maximum volume within a lookback range, normalizing all values against it, and mapping them into proportional box widths. The result is a chart-based structure that visualizes trading activity intensity alongside price movement in MetaTrader 5.

Creating Custom Indicators in MQL5 (Part 5): WaveTrend Crossover Evolution Using Canvas for Fog Gradients, Signal Bubbles, and Risk Management
In this article, we enhance the Smart WaveTrend Crossover indicator in MQL5 by integrating canvas-based drawing for fog gradient overlays, signal boxes that detect breakouts, and customizable buy/sell bubbles or triangles for visual alerts. We incorporate risk management features with dynamic take-profit and stop-loss levels calculated via candle multipliers or percentages, displayed through lines and a table, alongside options for trend filtering and box extensions.

Building A Candlestick Trend Constraint Model (Part 5): Notification System (Part II)
Today, we are discussing a working Telegram integration for MetaTrader 5 Indicator notifications using the power of MQL5, in partnership with Python and the Telegram Bot API. We will explain everything in detail so that no one misses any point. By the end of this project, you will have gained valuable insights to apply in your projects.

MQL5 Wizard Techniques you should know (Part 50): Awesome Oscillator
The Awesome Oscillator is another Bill Williams Indicator that is used to measure momentum. It can generate multiple signals, and therefore we review these on a pattern basis, as in prior articles, by capitalizing on the MQL5 wizard classes and assembly.

Category Theory in MQL5 (Part 10): Monoid Groups
This article continues the series on category theory implementation in MQL5. Here we look at monoid-groups as a means normalising monoid sets making them more comparable across a wider span of monoid sets and data types..

Recurrence Quantification Analysis (RQA) in MQL5: Building a Complete Analysis Library
This article builds a complete Recurrence Quantification Analysis (RQA) toolkit for MetaTrader 5 in pure MQL5. We cover phase-space reconstruction, time-delay embedding, distance and recurrence matrix construction, RQA metric extraction, automatic epsilon selection, and rolling-window computation through a modular library design. The article concludes by applying the library in a practical indicator that plots RR, DET, LAM, ENTR, and TREND directly on the chart, providing a solid foundation for nonlinear time-series analysis in MQL5.
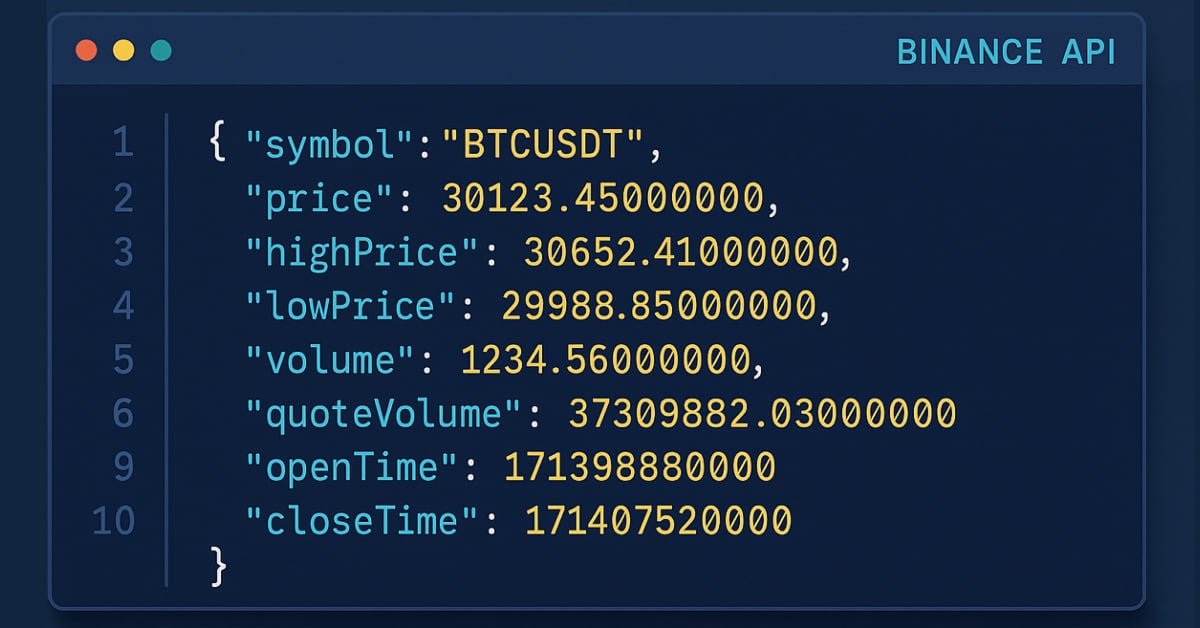
Introduction to MQL5 (Part 31): Mastering API and WebRequest Function in MQL5 (V)
Learn how to use WebRequest and external API calls to retrieve recent candle data, convert each value into a usable type, and save the information neatly in a table format. This step lays the groundwork for building an indicator that visualizes the data in candle format.

Developing a Replay System — Market simulation (Part 18): Ticks and more ticks (II)
Obviously the current metrics are very far from the ideal time for creating a 1-minute bar. That's the first thing we are going to fix. Fixing the synchronization problem is not difficult. This may seem hard, but it's actually quite simple. We did not make the required correction in the previous article since its purpose was to explain how to transfer the tick data that was used to create the 1-minute bars on the chart into the Market Watch window.

Redefining MQL5 and MetaTrader 5 Indicators
An innovative approach to collecting indicator information in MQL5 enables more flexible and streamlined data analysis by allowing developers to pass custom inputs to indicators for immediate calculations. This approach is particularly useful for algorithmic trading, as it provides enhanced control over the information processed by indicators, moving beyond traditional constraints.

Data Science and ML (Part 34): Time series decomposition, Breaking the stock market down to the core
In a world overflowing with noisy and unpredictable data, identifying meaningful patterns can be challenging. In this article, we'll explore seasonal decomposition, a powerful analytical technique that helps separate data into its key components: trend, seasonal patterns, and noise. By breaking data down this way, we can uncover hidden insights and work with cleaner, more interpretable information.

Building A Candlestick Trend Constraint Model (Part 6): All in one integration
One major challenge is managing multiple chart windows of the same pair running the same program with different features. Let's discuss how to consolidate several integrations into one main program. Additionally, we will share insights on configuring the program to print to a journal and commenting on the successful signal broadcast on the chart interface. Find more information in this article as we progress the article series.

MQL5 Wizard Techniques you should know (Part 58): Reinforcement Learning (DDPG) with Moving Average and Stochastic Oscillator Patterns
Moving Average and Stochastic Oscillator are very common indicators whose collective patterns we explored in the prior article, via a supervised learning network, to see which “patterns-would-stick”. We take our analyses from that article, a step further by considering the effects' reinforcement learning, when used with this trained network, would have on performance. Readers should note our testing is over a very limited time window. Nonetheless, we continue to harness the minimal coding requirements afforded by the MQL5 wizard in showcasing this.

MQL5 Wizard Techniques you should know (Part 53): Market Facilitation Index
The Market Facilitation Index is another Bill Williams Indicator that is intended to measure the efficiency of price movement in tandem with volume. As always, we look at the various patterns of this indicator within the confines of a wizard assembly signal class, and present a variety of test reports and analyses for the various patterns.

MQL5 Wizard Techniques you should know (Part 65): Using Patterns of FrAMA and the Force Index
The Fractal Adaptive Moving Average (FrAMA) and the Force Index Oscillator are another pair of indicators that could be used in conjunction within an MQL5 Expert Advisor. These two indicators complement each other a little bit because FrAMA is a trend following indicator while the Force Index is a volume based oscillator. As always, we use the MQL5 wizard to rapidly explore any potential these two may have.

Developing Market Entropy Indicator: Trading System Based on Information Theory
This article explores the development of a Market Entropy Indicator based on principles from Information Theory to measure the uncertainty and information content within financial markets. By applying concepts such as Shannon Entropy to price movements, the indicator quantifies whether the market is structured (trending), transitioning, or chaotic.

Creating Custom Indicators in MQL5 (Part 10): Enhancing the Footprint Chart with Per-Bar Volume Sentiment Information Box
The article enhances an MQL5 footprint indicator with a compact box above each candle that summarizes net delta, total volume, and buy/sell percentages. We implement supersampled anti‑aliased rendering, rounded corners via arc and quadrilateral rasterization, and per‑pixel alpha compositing. Supporting utilities include ARGB conversion, scanline fills, and box‑filter downsampling. The box delivers fast sentiment reads that stay legible across zoom levels.

Creating Custom Indicators in MQL5 (Part 7): Hybrid Time Price Opportunity (TPO) Market Profiles for Session Analysis
In this article, we develop a custom indicator in MQL5 for hybrid Time Price Opportunity (TPO) market profiles, supporting multiple session timeframes such as intraday, daily, weekly, monthly, and fixed periods with timezone adjustments. The indicator quantizes prices into a grid, tracks session data including highs, lows, opens, and closes, and calculates key elements like the point of control and value area based on TPO counts. It renders profiles visually on the chart with customizable colors for TPO letters, single prints, value areas, POC, and close markers, enabling detailed session analysis

MQL5 Wizard Techniques you should know (Part 82): Using Patterns of TRIX and the WPR with DQN Reinforcement Learning
In the last article, we examined the pairing of Ichimoku and the ADX under an Inference Learning framework. For this piece we revisit, Reinforcement Learning when used with an indicator pairing we considered last in ‘Part 68’. The TRIX and Williams Percent Range. Our algorithm for this review will be the Quantile Regression DQN. As usual, we present this as a custom signal class designed for implementation with the MQL5 Wizard.

Markets Positioning Codex in MQL5 (Part 1): Bitwise Learning for Nvidia
We commence a new article series that builds upon our earlier efforts laid out in the MQL5 Wizard series, by taking them further as we step up our approach to systematic trading and strategy testing. Within these new series, we’ll concentrate our focus on Expert Advisors that are coded to hold only a single type of position - primarily longs. Focusing on just one market trend can simplify analysis, lessen strategy complexity and expose some key insights, especially when dealing in assets beyond forex. Our series, therefore, will investigate if this is effective in equities and other non-forex assets, where long only systems usually correlate well with smart money or institution strategies.

MQL5 Wizard Techniques you should know (Part 76): Using Patterns of Awesome Oscillator and the Envelope Channels with Supervised Learning
We follow up on our last article, where we introduced the indicator couple of the Awesome-Oscillator and the Envelope Channel, by looking at how this pairing could be enhanced with Supervised Learning. The Awesome-Oscillator and Envelope-Channel are a trend-spotting and support/resistance complimentary mix. Our supervised learning approach is a CNN that engages the Dot Product Kernel with Cross-Time-Attention to size its kernels and channels. As per usual, this is done in a custom signal class file that works with the MQL5 wizard to assemble an Expert Advisor.

Three MACD Filters on US_TECH100: Five Years of Broker Data
This article tests three common filters on a standard MACD crossover for US_TECH100 H1 using five years of broker-native data. Filters are layered incrementally: regime, higher timeframe (HTF) alignment, and US session timing, to isolate each one's marginal impact. Results show session timing contributes far more than indicator refinements, while regime and HTF add little on their own. Includes a reproducible MQL5 regime classifier.

MQL5 Wizard Techniques you should know (Part 45): Reinforcement Learning with Monte-Carlo
Monte-Carlo is the fourth different algorithm in reinforcement learning that we are considering with the aim of exploring its implementation in wizard assembled Expert Advisors. Though anchored in random sampling, it does present vast ways of simulation which we can look to exploit.

MQL5 Wizard Techniques you should know (Part 52): Accelerator Oscillator
The Accelerator Oscillator is another Bill Williams Indicator that tracks price momentum's acceleration and not just its pace. Although much like the Awesome oscillator we reviewed in a recent article, it seeks to avoid the lagging effects by focusing more on acceleration as opposed to just speed. We examine as always what patterns we can get from this and also what significance each could have in trading via a wizard assembled Expert Advisor.

MQL5 Wizard Techniques you should know (Part 63): Using Patterns of DeMarker and Envelope Channels
The DeMarker Oscillator and the Envelope indicator are momentum and support/resistance tools that can be paired when developing an Expert Advisor. We therefore examine on a pattern by pattern basis what could be of use and what potentially avoid. We are using, as always, a wizard assembled Expert Advisor together with the Patterns-Usage functions that are built into the Expert Signal Class.

Creating a Traditional Renko Overlay Indicator in MQL5
Create a traditional Renko indicator in MQL5 that converts candlestick closing prices into fixed-size blocks displayed on the main chart. We calculate the movement from the closing price of the last block, create new blocks of a user-defined size, confirm reversals using the two-block rule, manage block closing prices in a dynamic array, and display rectangles for visualizing the trend in real time.

MQL5 Wizard Techniques you should know (Part 39): Relative Strength Index
The RSI is a popular momentum oscillator that measures pace and size of a security’s recent price change to evaluate over-and-under valued situations in the security’s price. These insights in speed and magnitude are key in defining reversal points. We put this oscillator to work in another custom signal class and examine the traits of some of its signals. We start, though, by wrapping up what we started previously on Bollinger Bands.

MQL5 Wizard Techniques you should know (Part 85): Using Patterns of Stochastic-Oscillator and the FrAMA with Beta VAE Inference Learning
This piece follows up ‘Part-84’, where we introduced the pairing of Stochastic and the Fractal Adaptive Moving Average. We now shift focus to Inference Learning, where we look to see if laggard patterns in the last article could have their fortunes turned around. The Stochastic and FrAMA are a momentum-trend complimentary pairing. For our inference learning, we are revisiting the Beta algorithm of a Variational Auto Encoder. We also, as always, do the implementation of a custom signal class designed for integration with the MQL5 Wizard.

The Power of MetaTrader 5: From Step-by-Step Debugging to EX5 Protection in a Unified Environment
This article examines a comprehensive approach to developing trading algorithms: from project setup and logic debugging to protecting the finished product. We will explore MetaEditor's built-in tools, including step-by-step debugging using real ticks, performance profiling, and direct integration with C++ DLLs to speed up calculations. The article also explains how to protect intellectual property using MQL5 Cloud Protector. The application of the described techniques will transform Expert Advisor development from a chaotic search for solutions into a systematic process, significantly reducing the time required to develop a strategy.

Feature Engineering for ML (Part 1): Fractional Differentiation — Stationarity Without Memory Loss
Integer differentiation forces a binary choice between stationarity and memory: returns (d=1) are stationary but discard all price-level information; raw prices (d=0) preserve memory but violate ML stationarity assumptions. We implement the fixed-width fractional differentiation (FFD) method from AFML Chapter 5, covering get_weights_ffd (iterative recurrence with threshold cutoff), frac_diff_ffd (bounded dot product per bar), and fracdiff_optimal (binary search for minimum stationary d*).

MQL5 Wizard Techniques you should know (Part 70): Using Patterns of SAR and the RVI with a Exponential Kernel Network
We follow up our last article, where we introduced the indicator pair of the SAR and the RVI, by considering how this indicator pairing could be extended with Machine Learning. SAR and RVI are a trend and momentum complimentary pairing. Our machine learning approach uses a convolution neural network that engages the Exponential kernel in sizing its kernels and channels, when fine-tuning the forecasts of this indicator pairing. As always, this is done in a custom signal class file that works with the MQL5 wizard to assemble an Expert Advisor.