Articles on the MQL5 programming and use of technical indicators
Technical indicators constitute an important part of trading, and every trader tries to find something new. The authors of these articles talk about econometrics and machine learning, automatic marking of Elliott Waves and digital filters - everything from the classical methods of analysis to the modern interpretation of classical ideas.
The category features articles that will teach you how to develop a custom indicator and contains unique collections of ready-to-use mathematically explained William Blau's trading ideas.
Add a new article

You are missing trading opportunities:
- Free trading apps
- Over 8,000 signals for copying
- Economic news for exploring financial markets
Registration
Log in
You agree to website policy and terms of use
If you do not have an account, please register


DIY technical indicator
In this article, I will consider the algorithms allowing you to create your own technical indicator. You will learn how to obtain pretty complex and interesting results with very simple initial assumptions.

Understanding functions in MQL5 with applications
Functions are critical things in any programming language, it helps developers apply the concept of (DRY) which means do not repeat yourself, and many other benefits. In this article, you will find much more information about functions and how we can create our own functions in MQL5 with simple applications that can be used or called in any system you have to enrich your trading system without complicating things.

Universal regression model for market price prediction (Part 2): Natural, technological and social transient functions
This article is a logical continuation of the previous one. It highlights the facts that confirm the conclusions made in the first article. These facts were revealed within ten years after its publication. They are centered around three detected dynamic transient functions describing the patterns in market price changes.

Tips for Purchasing a Product on the Market. Step-By-Step Guide
This step-by-step guide provides tips and tricks for better understanding and searching for a required product. The article makes an attempt to puzzle out different methods of searching for an appropriate product, sorting out unwanted products, determining product efficiency and essentiality for you.
Learn how to design a trading system by Chaikin Oscillator
Welcome to our new article from our series about learning how to design a trading system by the most popular technical indicator. Through this new article, we will learn how to design a trading system by the Chaikin Oscillator indicator.
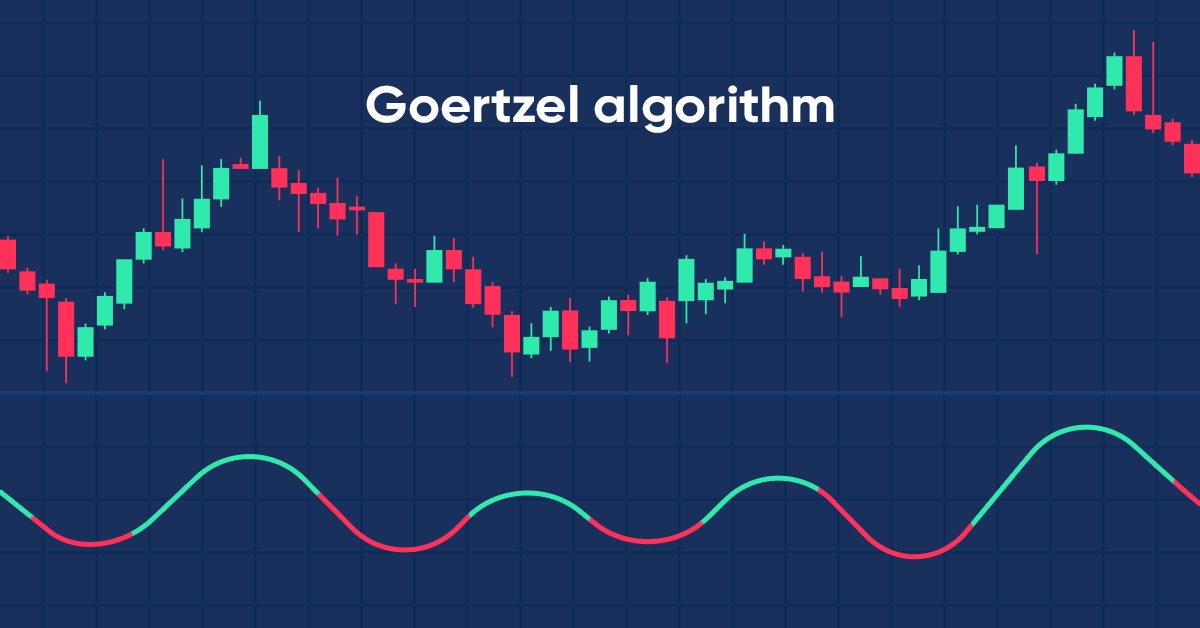
Cycle analysis using the Goertzel algorithm
In this article we present code utilities that implement the goertzel algorithm in Mql5 and explore two ways in which the technique can be used in the analysis of price quotes for possible strategy development.

Introduction to MQL5 (Part 10): A Beginner's Guide to Working with Built-in Indicators in MQL5
This article introduces working with built-in indicators in MQL5, focusing on creating an RSI-based Expert Advisor (EA) using a project-based approach. You'll learn to retrieve and utilize RSI values, handle liquidity sweeps, and enhance trade visualization using chart objects. Additionally, the article emphasizes effective risk management, including setting percentage-based risk, implementing risk-reward ratios, and applying risk modifications to secure profits.

Developing a trading Expert Advisor from scratch (Part 12): Times and Trade (I)
Today we will create Times & Trade with fast interpretation to read the order flow. It is the first part in which we will build the system. In the next article, we will complete the system with the missing information. To implement this new functionality, we will need to add several new things to the code of our Expert Advisor.

Developing a trading Expert Advisor from scratch (Part 10): Accessing custom indicators
How to access custom indicators directly in an Expert Advisor? A trading EA can be truly useful only if it can use custom indicators; otherwise, it is just a set of codes and instructions.

Price Action Analysis Toolkit Development (Part 55): Designing a CPI Mini-Candle Overlay for Intra-bar Pressure
This article presents the design and MetaTrader 5 implementation of the Candle Pressure Index (CPI)—a CLV-based overlay that visualizes intra-Bar buying and selling pressure directly on price charts. The discussion focuses on candle structure, pressure classification, visualization mechanics, and a non-repainting, transition-based alert system designed for consistent behavior across timeframes and instruments.
Canvas based indicators: Filling channels with transparency
In this article I'll introduce a method for creating custom indicators whose drawings are made using the class CCanvas from standard library and see charts properties for coordinates conversion. I'll approach specially indicators which need to fill the area between two lines using transparency.

Understanding MQL5 Object-Oriented Programming (OOP)
As developers, we need to learn how to create and develop software that can be reusable and flexible without duplicated code especially if we have different objects with different behaviors. This can be smoothly done by using object-oriented programming techniques and principles. In this article, we will present the basics of MQL5 Object-Oriented programming to understand how we can use principles and practices of this critical topic in our software.

Continuous futures contracts in MetaTrader 5
A short life span of futures contracts complicates their technical analysis. It is difficult to technically analyze short charts. For example, number of bars on the day chart of the UX-9.13 Ukrainian Stock index future is more than 100. Therefore, trader creates synthetic long futures contracts. This article explains how to splice futures contracts with different dates in the MetaTrader 5 terminal.

Introduction to MQL5 (Part 15): A Beginner's Guide to Building Custom Indicators (IV)
In this article, you'll learn how to build a price action indicator in MQL5, focusing on key points like low (L), high (H), higher low (HL), higher high (HH), lower low (LL), and lower high (LH) for analyzing trends. You'll also explore how to identify the premium and discount zones, mark the 50% retracement level, and use the risk-reward ratio to calculate profit targets. The article also covers determining entry points, stop loss (SL), and take profit (TP) levels based on the trend structure.

Trading strategy based on the improved Doji candlestick pattern recognition indicator
The metabar-based indicator detected more candles than the conventional one. Let's check if this provides real benefit in the automated trading.

Price Action Analysis Toolkit Development (Part 13): RSI Sentinel Tool
Price action can be effectively analyzed by identifying divergences, with technical indicators such as the RSI providing crucial confirmation signals. In the article below, we explain how automated RSI divergence analysis can identify trend continuations and reversals, thereby offering valuable insights into market sentiment.
Calculating mathematical expressions (Part 2). Pratt and shunting yard parsers
In this article, we consider the principles of mathematical expression parsing and evaluation using parsers based on operator precedence. We will implement Pratt and shunting-yard parser, byte-code generation and calculations by this code, as well as view how to use indicators as functions in expressions and how to set up trading signals in Expert Advisors based on these indicators.
Forecasting with ARIMA models in MQL5
In this article we continue the development of the CArima class for building ARIMA models by adding intuitive methods that enable forecasting.

Automating The Market Sentiment Indicator
In this article, we automate a custom market sentiment indicator that classifies market conditions into bullish, bearish, risk-on, risk-off, and neutral. The Expert Advisor delivers real-time insights into prevailing sentiment while streamlining the analysis process for current market trends or direction.

Developing a trading Expert Advisor from scratch (Part 16): Accessing data on the web (II)
Knowing how to input data from the Web into an Expert Advisor is not so obvious. It is not so easy to do without understanding all the possibilities offered by MetaTrader 5.

Developing a trading Expert Advisor from scratch (Part 15): Accessing data on the web (I)
How to access online data via MetaTrader 5? There are a lot of websites and places on the web, featuring a huge amount information. What you need to know is where to look and how best to use this information.

Timeseries in DoEasy library (part 49): Multi-period multi-symbol multi-buffer standard indicators
In the current article, I will improve the library classes to implement the ability to develop multi-symbol multi-period standard indicators requiring several indicator buffers to display their data.
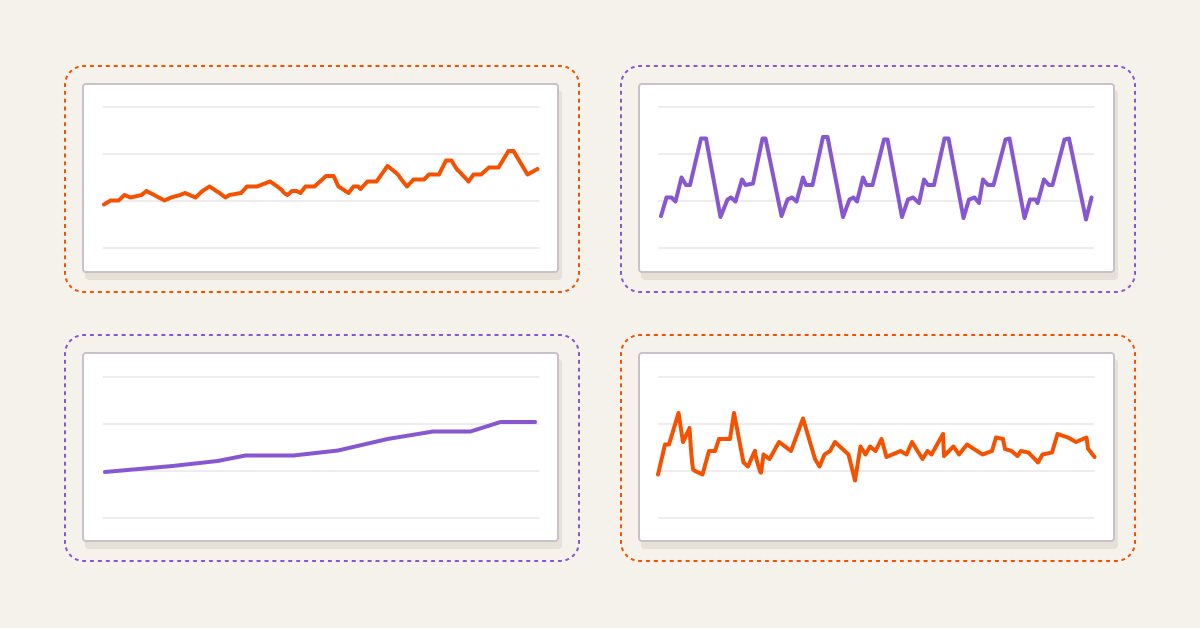
Non-linear indicators
In this article, I will make an attempt to consider some ways of building non-linear indicators and their use in trading. There are quite a few indicators in the MetaTrader trading platform that use non-linear approaches.

Larry Williams Market Secrets (Part 5): Automating the Volatility Breakout Strategy in MQL5
This article demonstrates how to automate Larry Williams’ volatility breakout strategy in MQL5 using a practical, step-by-step approach. You will learn how to calculate daily range expansions, derive buy and sell levels, manage risk with range-based stops and reward-based targets, and structure a professional Expert Advisor for MetaTrader 5. Designed for traders and developers looking to transform Larry Williams’ market concepts into a fully testable and deployable automated trading system.

Mountain or Iceberg charts
How do you like the idea of adding a new chart type to the MetaTrader 5 platform? Some people say it lacks a few things that other platforms offer. But the truth is, MetaTrader 5 is a very practical platform as it allows you to do things that can't be done (or at least can't be done easily) in many other platforms.
Larry Williams Market Secrets (Part 5): Automating the Volatility Breakout Strategy in MQL5
This article demonstrates how to automate Larry Williams’ volatility breakout strategy in MQL5 using a practical, step-by-step approach. You will learn how to calculate daily range expansions, derive buy and sell levels, manage risk with range-based stops and reward-based targets, and structure a professional Expert Advisor for MetaTrader 5. Designed for traders and developers looking to transform Larry Williams’ market concepts into a fully testable and deployable automated trading system.

Introduction to MQL5 (Part 9): Understanding and Using Objects in MQL5
Learn to create and customize chart objects in MQL5 using current and historical data. This project-based guide helps you visualize trades and apply MQL5 concepts practically, making it easier to build tools tailored to your trading needs.
Larry Williams Market Secrets (Part 5): Automating the Volatility Breakout Strategy in MQL5
This article demonstrates how to automate Larry Williams’ volatility breakout strategy in MQL5 using a practical, step-by-step approach. You will learn how to calculate daily range expansions, derive buy and sell levels, manage risk with range-based stops and reward-based targets, and structure a professional Expert Advisor for MetaTrader 5. Designed for traders and developers looking to transform Larry Williams’ market concepts into a fully testable and deployable automated trading system.

The price movement model and its main provisions. (Part 3): Calculating optimal parameters of stock exchange speculations
Within the framework of the engineering approach developed by the author based on the probability theory, the conditions for opening a profitable position are found and the optimal (profit-maximizing) take profit and stop loss values are calculated.

Price Action Analysis Toolkit Development (Part 46): Designing an Interactive Fibonacci Retracement EA with Smart Visualization in MQL5
Fibonacci tools are among the most popular instruments used by technical analysts. In this article, we’ll build an Interactive Fibonacci EA that draws retracement and extension levels that react dynamically to price movement, delivering real‑time alerts, stylish lines, and a scrolling news‑style headline. Another key advantage of this EA is flexibility; you can manually type the high (A) and low (B) swing values directly on the chart, giving you exact control over the market range you want to analyze.

Introduction to MQL5 (Part 14): A Beginner's Guide to Building Custom Indicators (III)
Learn to build a Harmonic Pattern indicator in MQL5 using chart objects. Discover how to detect swing points, apply Fibonacci retracements, and automate pattern recognition.
Timeseries in DoEasy library (part 44): Collection class of indicator buffer objects
The article deals with creating a collection class of indicator buffer objects. I am going to test the ability to create and work with any number of buffers for indicators (the maximum number of buffers that can be created in MQL indicators is 512).

From Novice to Expert: Navigating Market Irregularities
Market rules are continuously evolving, and many once-reliable principles gradually lose their effectiveness. What worked in the past no longer works consistently over time. Today’s discussion focuses on probability ranges and how they can be used to navigate market irregularities. We will leverage MQL5 to develop an algorithm capable of trading effectively even in the choppiest market conditions. Join this discussion to find out more.
Multiple indicators on one chart (Part 02): First experiments
In the previous article "Multiple indicators on one chart" I presented the concept and the basics of how to use multiple indicators on one chart. In this article, I will provide the source code and will explain it in detail.

MQL5 Wizard Techniques you should know (Part 48): Bill Williams Alligator
The Alligator Indicator, which was the brain child of Bill Williams, is a versatile trend identification indicator that yields clear signals and is often combined with other indicators. The MQL5 wizard classes and assembly allow us to test a variety of signals on a pattern basis, and so we consider this indicator as well.
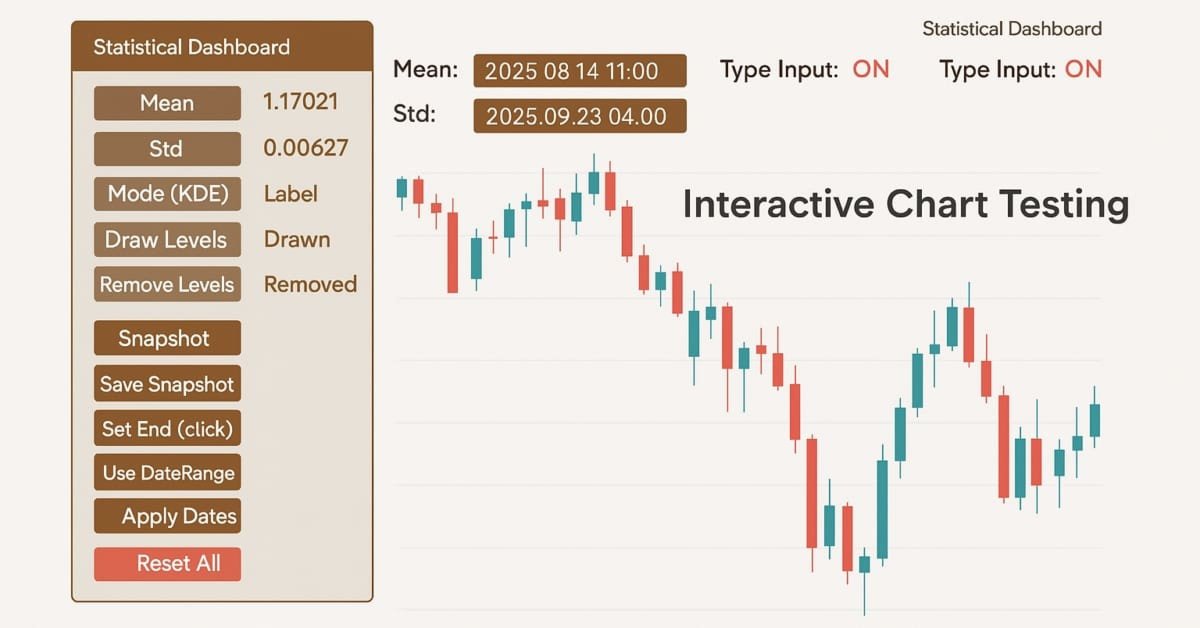
Price Action Analysis Toolkit Development (Part 42): Interactive Chart Testing with Button Logic and Statistical Levels
In a world where speed and precision matter, analysis tools need to be as smart as the markets we trade. This article presents an EA built on button logic—an interactive system that instantly transforms raw price data into meaningful statistical levels. With a single click, it calculates and displays mean, deviation, percentiles, and more, turning advanced analytics into clear on-chart signals. It highlights the zones where price is most likely to bounce, retrace, or break, making analysis both faster and more practical.

Developing a trading Expert Advisor from scratch (Part 8): A conceptual leap
What is the easiest way to implement new functionality? In this article, we will take one step back and then two steps forward.
Price Action Analysis Toolkit Development (Part 42): Interactive Chart Testing with Button Logic and Statistical Levels
In a world where speed and precision matter, analysis tools need to be as smart as the markets we trade. This article presents an EA built on button logic—an interactive system that instantly transforms raw price data into meaningful statistical levels. With a single click, it calculates and displays mean, deviation, percentiles, and more, turning advanced analytics into clear on-chart signals. It highlights the zones where price is most likely to bounce, retrace, or break, making analysis both faster and more practical.

Statistical Arbitrage with predictions
We will walk around statistical arbitrage, we will search with python for correlation and cointegration symbols, we will make an indicator for Pearson's coefficient and we will make an EA for trading statistical arbitrage with predictions done with python and ONNX models.

Improve Your Trading Charts With Interactive GUI's in MQL5 (Part I): Movable GUI (I)
Unleash the power of dynamic data representation in your trading strategies or utilities with our comprehensive guide on creating movable GUI in MQL5. Dive into the core concept of chart events and learn how to design and implement simple and multiple movable GUI on the same chart. This article also explores the process of adding elements to your GUI, enhancing their functionality and aesthetic appeal.