Articles on the MQL5 programming and use of technical indicators
Technical indicators constitute an important part of trading, and every trader tries to find something new. The authors of these articles talk about econometrics and machine learning, automatic marking of Elliott Waves and digital filters - everything from the classical methods of analysis to the modern interpretation of classical ideas.
The category features articles that will teach you how to develop a custom indicator and contains unique collections of ready-to-use mathematically explained William Blau's trading ideas.
Add a new article

You are missing trading opportunities:
- Free trading apps
- Over 8,000 signals for copying
- Economic news for exploring financial markets
Registration
Log in
You agree to website policy and terms of use
If you do not have an account, please register


Synchronizing several same-symbol charts on different timeframes
When making trading decisions, we often have to analyze charts on several timeframes. At the same time, these charts often contain graphical objects. Applying the same objects to all charts is inconvenient. In this article, I propose to automate cloning of objects to be displayed on charts.
MTF indicators as the technical analysis tool
Most of traders agree that the current market state analysis starts with the evaluation of higher chart timeframes. The analysis is performed downwards to lower timeframes until the one, at which deals are performed. This analysis method seems to be a mandatory part of professional approach for successful trading. In this article, we will discuss multi-timeframe indicators and their creation ways, as well as we will provide MQL5 code examples. In addition to the general evaluation of advantages and disadvantages, we will propose a new indicator approach using the MTF mode.

DiNapoli trading system
The article describes the Fibo levels-based trading system developed by Joe DiNapoli. The idea behind the system and the main concepts are explained, as well as a simple indicator is provided as an example for more clarity.
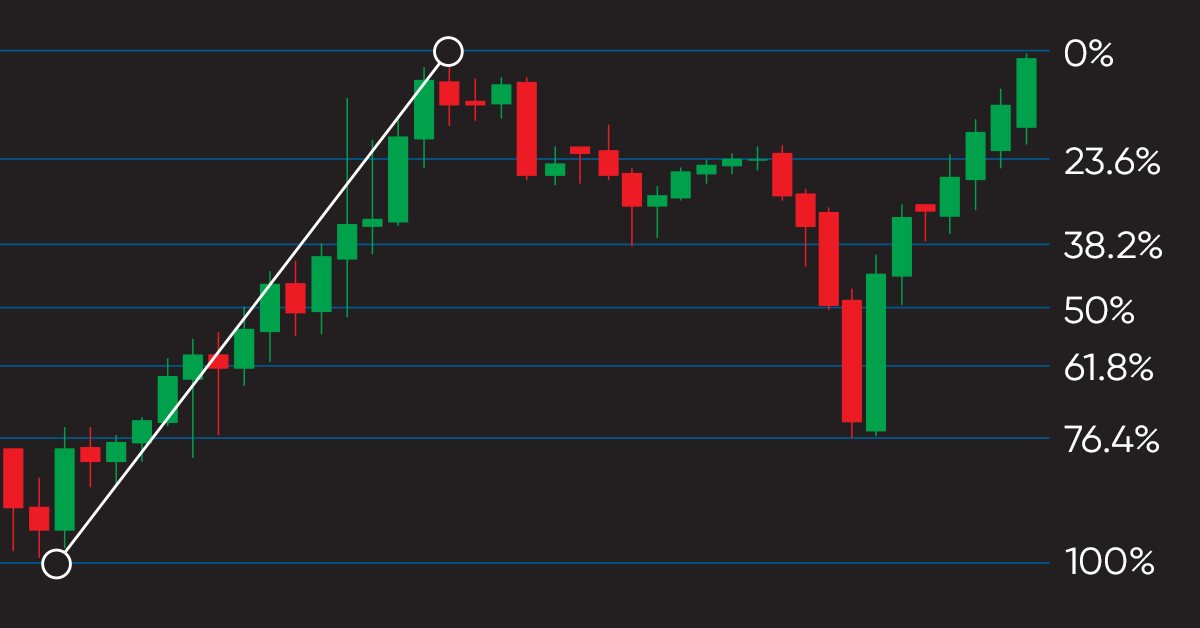
Learn how to design a trading system by Fibonacci
In this article, we will continue our series of creating a trading system based on the most popular technical indicator. Here is a new technical tool which is the Fibonacci and we will learn how to design a trading system based on this technical indicator.

Learn how to design different Moving Average systems
There are many strategies that can be used to filter generated signals based on any strategy, even by using the moving average itself which is the subject of this article. So, the objective of this article is to share with you some of Moving Average Strategies and how to design an algorithmic trading system.

Advanced Adaptive Indicators Theory and Implementation in MQL5
This article will describe advanced adaptive indicators and their implementation in MQL5: Adaptive Cyber Cycle, Adaptive Center of Gravity and Adaptive RVI. All indicators were originally presented in "Cybernetic Analysis for Stocks and Futures" by John F. Ehlers.

Creating a Multi-Currency Indicator, Using a Number of Intermediate Indicator Buffers
There has been a recent rise of interest in the cluster analyses of the FOREX market. MQL5 opens up new possibilities of researching the trends of the movement of currency pairs. A key feature of MQL5, differentiating it from MQL4, is the possibility of using an unlimited amount of indicator buffers. This article describes an example of the creation of a multi-currency indicator.

Creating Tick Indicators in MQL5
In this article, we will consider the creation of two indicators: the tick indicator, which plots the tick chart of the price and tick candle indicator, which plot candles with the specified number of ticks. Each of the indicators writes the incoming prices into a file, and uses the saved data after the restart of the indicator (these data also can be used by the other programs)

Auto detection of extreme points based on a specified price variation
Automation of trading strategies involving graphical patterns requires the ability to search for extreme points on the charts for further processing and interpretation. Existing tools do not always provide such an ability. The algorithms described in the article allow finding all extreme points on charts. The tools discussed here are equally efficient both during trends and flat movements. The obtained results are not strongly affected by a selected timeframe and are only defined by a specified scale.
Forecasting Time Series (Part 1): Empirical Mode Decomposition (EMD) Method
This article deals with the theory and practical use of the algorithm for forecasting time series, based on the empirical decomposition mode. It proposes the MQL implementation of this method and presents test indicators and Expert Advisors.

How to quickly develop and debug a trading strategy in MetaTrader 5
Scalping automatic systems are rightfully regarded the pinnacle of algorithmic trading, but at the same time their code is the most difficult to write. In this article we will show how to build strategies based on analysis of incoming ticks using the built-in debugging tools and visual testing. Developing rules for entry and exit often require years of manual trading. But with the help of MetaTrader 5, you can quickly test any such strategy on real history.
Indicator for Constructing a Three Line Break Chart
This article is dedicated to the Three Line Break chart, suggested by Steve Nison in his book "Beyond Candlesticks". The greatest advantage of this chart is that it allows filtering minor fluctuations of a price in relation to the previous movement. We are going to discuss the principle of the chart construction, the code of the indicator and some examples of trading strategies based on it.

Developing stock indicators featuring volume control through the example of the delta indicator
The article deals with the algorithm of developing stock indicators based on real volumes using the CopyTicks() and CopyTicksRange() functions. Some subtle aspects of developing such indicators, as well as their operation in real time and in the strategy tester are also described.

Machine Learning: How Support Vector Machines can be used in Trading
Support Vector Machines have long been used in fields such as bioinformatics and applied mathematics to assess complex data sets and extract useful patterns that can be used to classify data. This article looks at what a support vector machine is, how they work and why they can be so useful in extracting complex patterns. We then investigate how they can be applied to the market and potentially used to advise on trades. Using the Support Vector Machine Learning Tool, the article provides worked examples that allow readers to experiment with their own trading.

A DLL-free solution to communicate between MetaTrader 5 terminals using Named Pipes
The article describes how to implement Interprocess Communication between MetaTrader 5 client terminals using named pipes. For the use of the named pipes, the CNamedPipes class is developed. For the test of its use and to measure the connection throughput, the tick indicator, the server and client scripts are presented. The use of named pipes is sufficient for real-time quotes.

Bid/Ask spread analysis in MetaTrader 5
An indicator to report your brokers Bid/Ask spread levels. Now we can use MT5s tick data to analyze what the historic true average Bid/Ask spread actually have recently been. You shouldn't need to look at the current spread because that is available if you show both bid and ask price lines.
Thomas DeMark's Sequential (TD SEQUENTIAL) using artificial intelligence
In this article, I will tell you how to successfully trade by merging a very well-known strategy and a neural network. It will be about the Thomas DeMark's Sequential strategy with the use of an artificial intelligence system. Only the first part of the strategy will be applied, using the Setup and Intersection signals.
Strategy builder based on Merrill patterns
In the previous article, we considered application of Merrill patterns to various data, such as to a price value on a currency symbol chart and values of standard MetaTrader 5 indicators: ATR, WPR, CCI, RSI, among others. Now, let us try to create a strategy construction set based on Merrill patterns.

Exploring Trading Strategy Classes of the Standard Library - Customizing Strategies
In this article we are going to show how to explore the Standard Library of Trading Strategy Classes and how to add Custom Strategies and Filters/Signals using the Patterns-and-Models logic of the MQL5 Wizard. In the end you will be able easily add your own strategies using MetaTrader 5 standard indicators, and MQL5 Wizard will create a clean and powerful code and fully functional Expert Advisor.
3D Modeling in MQL5
A time series is a dynamic system, in which values of a random variable are received continuously or at successive equally spaced points in time. Transition from 2D to 3D market analysis provides a new look at complex processes and research objects. The article describes visualization methods providing 3D representation of two-dimensional data.
Timeseries in DoEasy library (part 42): Abstract indicator buffer object class
In this article, we start the development of the indicator buffer classes for the DoEasy library. We will create the base class of the abstract buffer which is to be used as a foundation for the development of different class types of indicator buffers.
Developing the oscillator-based ZigZag indicator. Example of executing a requirements specification
The article demonstrates the development of the ZigZag indicator in accordance with one of the sample specifications described in the article "How to prepare Requirements Specification when ordering an indicator". The indicator is built by extreme values defined using an oscillator. There is an ability to use one of five oscillators: WPR, CCI, Chaikin, RSI or Stochastic Oscillator.

How to Write an Indicator on the Basis of Another Indicator
In MQL5 you can write an indicator both from a scratch and on the basis of another already existing indicator, in-built in the client terminal or a custom one. And here you also have two ways - to improve an indicator by adding new calculations and graphical styles to it , or to use an indicator in-built in the client terminal or a custom one via the iCustom() or IndicatorCreate() functions.

Universal RSI indicator for working in two directions simultaneously
When developing trading algorithms, we often encounter a problem: how to determine where a trend/flat begins and ends? In this article, we try to create a universal indicator, in which we try to combine signals for different types of strategies. We will try to simplify the process of obtaining trade signals in an expert as much as possible. An example of combining several indicators in one will be given.

Applying One Indicator to Another
When writing an indicator that uses the short form of the OnCalculate() function call, you might miss the fact that an indicator can be calculated not only by price data, but also by data of some other indicator (no matter whether it is a built-in or custom one). Do you want to improve an indicator for its correct application to the other indicator's data? In this article we'll review all the steps required for such modification.

Moving Mini-Max: a New Indicator for Technical Analysis and Its Implementation in MQL5
In the following article I am describing a process of implementing Moving Mini-Max indicator based on a paper by Z.G.Silagadze 'Moving Mini-max: a new indicator for technical analysis'. The idea of the indicator is based on simulation of quantum tunneling phenomena, proposed by G. Gamov in the theory of alpha decay.
Scraping bond yield data from the web
Automate the collection of interest rate data to improve the performance of an Expert Advisor.

Learn how to design a trading system by ATR
In this article, we will learn a new technical tool that can be used in trading, as a continuation within the series in which we learn how to design simple trading systems. This time we will work with another popular technical indicator: Average True Range (ATR).

Dealing with Time (Part 1): The Basics
Functions and code snippets that simplify and clarify the handling of time, broker offset, and the changes to summer or winter time. Accurate timing may be a crucial element in trading. At the current hour, is the stock exchange in London or New York already open or not yet open, when does the trading time for Forex trading start and end? For a trader who trades manually and live, this is not a big problem.

Learn how to design a trading system by ADX
In this article, we will continue our series about designing a trading system using the most popular indicators and we will talk about the average directional index (ADX) indicator. We will learn this indicator in detail to understand it well and we will learn how we to use it through a simple strategy. By learning something deeply we can get more insights and we can use it better.

The Implementation of a Multi-currency Mode in MetaTrader 5
For a long time multi-currency analysis and multi-currency trading has been of interest to people. The opportunity to implement a full fledged multi-currency regime became possible only with the public release of MetaTrader 5 and the MQL5 programming language. In this article we propose a way to analyze and process all incoming ticks for several symbols. As an illustration, let's consider a multi-currency RSI indicator of the USDx dollar index.
Learn how to design a trading system by ADX
In this article, we will continue our series about designing a trading system using the most popular indicators and we will talk about the average directional index (ADX) indicator. We will learn this indicator in detail to understand it well and we will learn how we to use it through a simple strategy. By learning something deeply we can get more insights and we can use it better.

Studying candlestick analysis techniques (part I): Checking existing patterns
In this article, we will consider popular candlestick patterns and will try to find out if they are still relevant and effective in today's markets. Candlestick analysis appeared more than 20 years ago and has since become quite popular. Many traders consider Japanese candlesticks the most convenient and easily understandable asset price visualization form.

The Drawing Styles in MQL5
There are 6 drawing styles in MQL4 and 18 drawing styles in MQL5. Therefore, it may be worth writing an article to introduce MQL5's drawing styles. In this article, we will consider the details of drawing styles in MQL5. In addition, we will create an indicator to demonstrate how to use these drawing styles, and refine the plotting.
Forecasting Time Series (Part 2): Least-Square Support-Vector Machine (LS-SVM)
This article deals with the theory and practical application of the algorithm for forecasting time series, based on support-vector method. It also proposes its implementation in MQL and provides test indicators and Expert Advisors. This technology has not been implemented in MQL yet. But first, we have to get to know math for it.

Statistical distributions in the form of histograms without indicator buffers and arrays
The article discusses the possibility of plotting statistical distribution histograms of market conditions with the help of the graphical memory meaning no indicator buffers and arrays are applied. Sample histograms are described in details and the "hidden" functionality of MQL5 graphical objects is shown.

Developing Pivot Mean Oscillator: a novel Indicator for the Cumulative Moving Average
This article presents Pivot Mean Oscillator (PMO), an implementation of the cumulative moving average (CMA) as a trading indicator for the MetaTrader platforms. In particular, we first introduce Pivot Mean (PM) as a normalization index for timeseries that computes the fraction between any data point and the CMA. We then build PMO as the difference between the moving averages applied to two PM signals. Some preliminary experiments carried out on the EURUSD symbol to test the efficacy of the proposed indicator are also reported, leaving ample space for further considerations and improvements.

The NRTR indicator and trading modules based on NRTR for the MQL5 Wizard
In this article we are going to analyze the NRTR indicator and create a trading system based on this indicator. We are going to develop a module of trading signals that can be used in creating strategies based on a combination of NRTR with additional trend confirmation indicators.

Developing Advanced ICT Trading Systems: Implementing Order Blocks in an Indicator
In this article, we will learn how to create an indicator that detects, draws, and alerts on the mitigation of order blocks. We will also take a detailed look at how to identify these blocks on the chart, set accurate alerts, and visualize their position using rectangles to better understand the price action. This indicator will serve as a key tool for traders who follow the Smart Money Concepts and the Inner Circle Trader methodology.

Custom Indicators (Part 1): A Step-by-Step Introductory Guide to Developing Simple Custom Indicators in MQL5
Learn how to create custom indicators using MQL5. This introductory article will guide you through the fundamentals of building simple custom indicators and demonstrate a hands-on approach to coding different custom indicators for any MQL5 programmer new to this interesting topic.