
MQL5 Wizard Techniques you should know (Part 69): Using Patterns of SAR and the RVI
Introduction
The Parabolic Stop-And-Reverse (SAR) indicator and the Relative Vigour Index (RVI) oscillator are our next pairing to consider within these series. This time, this duo brings together trend identification with momentum tracking. As we have in past articles, we consider 10 possible signal patterns that can be generated from combining these two indicators, and we have them tested in a wizard assembled Expert Advisor. With that, let's look at the definitions of these 2 indicators.
Our optimization and testing is performed on the symbol GBP CHF for the year 2023 on the 4-hour time frame. We are testing one pattern at a time. Because we use MQL5’s inbuilt parameter of ‘m_patterns_used’, we have to implement our own map with an input parameter ‘PatternsUsed’. This is an integer value that serves as a bitmap to the combination of patterns used at any one time. In our case, though, we are using only one pattern at a time. The reasons for this were highlighted in earlier articles, and readers are free to revisit those for a refresher. Our patterns are indexed 0 to 9 and to get the integer value that exclusively maps to a specific pattern, we simply take 2 to the power of the pattern’s index. If we are using pattern 0 then the map is 2 to the power 0 which gives us 1. If the pattern index is 4 then the used map value will be 2 to the power 4 which gives us 16. And so on.
The forward walk is performed on the year 2025 which gives us a total period spanning from 2023.01.01 up to 2025.01.01. This window is clearly limited for anyone considering taking this further as testing should ideally be performed across different market types and these market types tend to span several years if not decades.
The Parabolic SAR
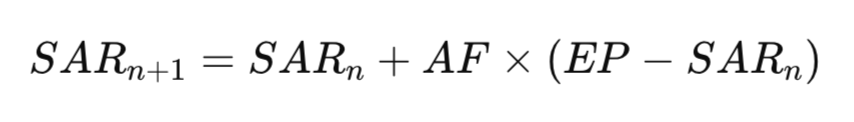
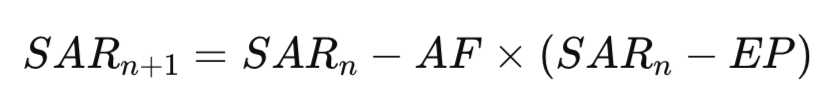
This indicator was developed to spot trends as well as potential reversal points. It plots dots above or below the price to highlight the trend. A dot-plot below price would mark a bullish trend, while one above would indicate a bearish trend. This can present a secondary benefit of setting a reasonable trailing stop-loss in trend following strategies. It would adjust dynamically in trend-following strategies, which suggests, as one would expect, that this indicator is better suited in trending markets. Its formula is twofold. Fur the upper buffer and the lower buffer. The upper buffer is as follows-
With the lower buffer being defined by:
Where:
- SARn is the current period’s SAR (Stop and Reverse) value,
- SARn+1 is the next period’s SAR value (the forecasted SAR),
- AF is the Acceleration Factor – starts at 0.02 and increases by 0.02 each time a new EP is reached, up to a max of 0.20,
- EP is the Extreme Point – the highest high (in uptrend) or lowest low (in downtrend) seen so far,
- EP−SARn or SARn−EP is the distance between the current SAR and the extreme price point, used to accelerate the SAR's movement.
The logic behind this is if price crosses SAR, on a trend reversal, it would reset to the opposite Extreme-Point. Then the cycle would continue, with the Acceleration Factor increasing with each successive affirmation of trend until it peaks at its preset limit that is typically 0.2.
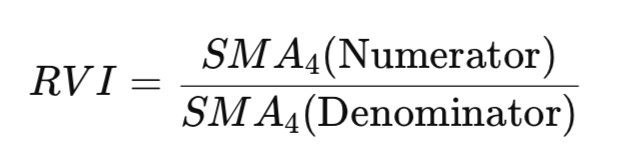
This indicator keeps tabs on momentum by comparing the closing price to a price range over an input period. It indicates bullish momentum when the closing price is near the highs and conversely bearish momentum if it is nearer to the lows. In addition, it engages a signal line which is a smoothed RVI line for identifying turning points in the RVI. A crossover with this signal line from below to above would signal bullish momentum, while a cross from above to below would mark bearish momentum.
It tends to be more reliable in trending markets than the range-bound by confirming trends and identifying potential reversals. Its formula is as follows:
with:
Where:
- RVI is the Relative Vigor Index value at time t,
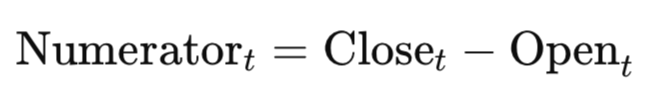
- Closet is closing price of bar or candle at time t,
- Opent is the opening price of a bar at a time t,
- Hight is the high price at time t,
- Lowt is the low price of bar or candle at time t,
- Numeratort is the difference between the close and open price (momentum),
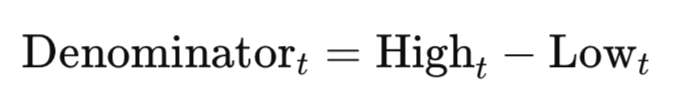
- Denominatort is the difference between the high and low price (range of movement),
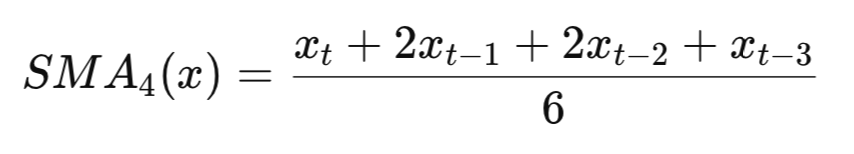
- SAM4 is Symmetrical weighted moving average using weights [1, 2, 2, 1].
This is a pedantic, first principles' formula, that we do not strictly adapt for this article but is presented here for completeness as an introduction to this indicator. The logic behind the formula is to calculate the difference between close and open and get a sense of the current price drift versus the prevalent price range. The signal line smooths the RVI to reduce noise and generate clearer signals. With this indicator introduction, we can now look at the signal patterns.
SAR Flip with RVI Crossover
Our first pattern spots potential reversals by using the parabolic SAR cross and the RVI zero line cross. The former indicator often suggests price trend change, while the latter serves as a confirmation of momentum’s direction. It essentially brings together high-low price action with SAR trend following and RVI momentum signalling.
For the buy signal, when the prior bar’s high was below the SAR since the market was in a downtrend and now the current bar’s low is above the SAR following a flip to signal an uptrend; we would mark this as bullish provided the RVI concurrently crosses the zero line from below to close above it. This is how we implement this in MQL5:
//+------------------------------------------------------------------+
//| Check for Pattern 0.                                             |
//+------------------------------------------------------------------+
bool CSignalSAR_RVI::IsPattern_0(ENUM_POSITION_TYPE T)
{  if(T == POSITION_TYPE_BUY && High(X() + 1) <= SAR(X() + 1) && SAR(X()) <= Low(X()) && 0.0 > RVI(X() + 1) && RVI(X()) > 0.0)
   {  return(true);
   }
   else if(T == POSITION_TYPE_SELL && Low(X() + 1) >= SAR(X() + 1) && SAR(X()) >= High(X()) && 0.0 < RVI(X() + 1) && RVI(X()) < 0.0)
   {  return(true);
   }
   return(false);
}
The sell logic is based on the prior bar’s low being above the SAR in an uptrend, followed by a flip to have the current high being below the SAR with also the RVI crossing the zero line to go below it. This pattern is timeframe sensitive, and it arguably works best in the medium time frames of 1-hour to 4-hour, where it is less susceptible to noise of the smaller time frames without lagging too much as in the larger time frames. Its utility is as a hybrid between trend-reversal pattern, being useful in range breakouts or market transitions that are volatile.
When using, it's a good idea to filter the trend with the context. The trades should align with the macro context. Using a volatility filter with indicator STD-DEV can be adopted to avoid taking trades in flat markets. Avoiding trades in news hours can also be used by engaging a news-time filter. The RVI slope is another filter that can be supplemented to boost our pattern 0 in order to get cleaner signals. The use of SAR means stop-loss management is inherent since the SAR level can act as a guide, however ATR based stop losses can also be considered since the SAR and RVI tend to be too reactive. Supplementing this signal pattern with another should in general be considered, and the MQL5 wizard setup easily allows this to be done.
Possible weaknesses in our implementation are the SAR reactivity. It lags a lot in rapid market reversals or false breakouts, and it can generate signals that are lagging significantly. There is no volume or volatility filter for extra confirmation, since low activity markets are awash with false signals, and the RVI zero crossing can be an unreliable trigger in ranging markets. Our entry thresholds are also a bit too strict since they lack tolerance or margin (i.e. no, <= or >=).
Possible remedies to these weaknesses are partly straightforward, where for the STD-DEV we can check to ensure the current standard deviation exceeds an optimisable threshold. A momentum filter that tracks changes in the RVI can also be added to ensure that the last bar change in the RVI magnitude signals a sufficient level of momentum. ATR for dynamic SL and TP is another potential improvement. Our testing of this pattern on GBP CHF from 2023.01.01 up to 2025.01.01 gives us the following report. This pattern was able to forward walk;

SAR Support with RVI Trending
Our second pattern, gets its buy signal when the prior candle’s low is above the SAR and the RVI shows bullish momentum, with the current reading being above the last. The MQL5 implementation is as follows:
//+------------------------------------------------------------------+
//| Check for Pattern 1.                                             |
//+------------------------------------------------------------------+
bool CSignalSAR_RVI::IsPattern_1(ENUM_POSITION_TYPE T)
{  if(T == POSITION_TYPE_BUY && Low(X() + 1) > SAR(X() + 1) && SAR(X()) < Low(X()) && RVI(X()) > RVI(X() + 1))
   {  return(true);
   }
   else if(T == POSITION_TYPE_SELL && High(X() + 1) < SAR(X() + 1) && SAR(X()) > High(X()) && RVI(X()) < RVI(X() + 1))
   {  return(true);
   }
   return(false);
}
The sell signal is when last bar’s high was sub-SAR and the RVI indicates bearish momentum, with current RVI being below the last. This complimentary unity seeks to catch momentum backed reversals early. This pattern can be ideal in reversal trading or momentum breakouts, especially in trending or volatile markets where the SAR reaction can be quite strong.
Best practice could have this particular pattern used on time frames that are higher, at least 1-hour. This stems from the reactive nature of its signal, which can give a lot of false openings on low time frames. Also, combination with volume for volatility filtering by using indicators such as the On-Balance-Volume, can ensure the momentum signalling is valid. The STD-DEV and ATR can also be on hand to provide additional confirmation. Another possible filter for this pattern is a candle filter such as the bullish engulfing or the bearish engulfing as the case may be. Avoiding trades during news can augur well with the SAR given its reactive nature, and SL and TP also tend to work well with this pattern, especially if ATR based. Our test report for this pattern is as follows. This pattern did not forward walk:


SAR Breakout with RVI Divergence
Our third pattern combines the SAR and RVI with the goal of capturing early signs of a reversal or early trend confirmation. The relative position of price to the SAR is key here, and an RVI momentum crossover is a prerequisite. The buy signal is when the high is below or equal to the SAR, followed by a drop or flip to have it below the low indicating a bullish reversal along with a backdrop of rising RVI for increasing momentum. The close price may also drop slightly suggesting a bear trap or a final dip before an imminent reversal. We implement this as follows in MQL5:
//+------------------------------------------------------------------+
//| Check for Pattern 2.                                             |
//+------------------------------------------------------------------+
bool CSignalSAR_RVI::IsPattern_2(ENUM_POSITION_TYPE T)
{  if(T == POSITION_TYPE_BUY && High(X() + 1) <= SAR(X() + 1) && SAR(X()) <= Low(X()) && RVI(X()) > RVI(X() + 1) && Close(X()) < Close(X() + 1))
   {  return(true);
   }
   else if(T == POSITION_TYPE_SELL && Low(X() + 1) >= SAR(X() + 1) && SAR(X()) >= High(X()) && RVI(X()) < RVI(X() + 1) && Close(X()) > Close(X() + 1))
   {  return(true);
   }
   return(false);
}
The sell signal characteristics feature a prior low that was above or equal to the SAR, followed by a SAR rise to perch above the high of the current bar with the RVI in decline a sign of decreasing momentum. In this situation the close price may also tick higher to setup a potential bull trap or exhaustion point. This is pattern is a contrarian/ momentum hybrid signal. The SAR serves as a trend reversal indicator while the RVI reflects internal momentum strength. Supplementing close price comparison does add price-action validation.
Use cases for pattern 2 are probably in ranging or transitional markets. This is because reversals happen more frequently here. This pattern can also be beneficial in lower time frames when pursuing mean-reversion strategies or engaging short-term momentum trading.
Best practice for traders, when using this pattern, would probably see them apply multi-timeframe confirmation. This tends to act as a safety given the whipsaws of lower time frame. If there is some confirmation on a larger timeframe, then this can boost this pattern even further. Another thing they can do is combine it with a volatility filter. In this scenario, they would use the STD-DEV/ inbuilt standard deviation indicator or the ATR to help validate whether a reversal has enough room to move. This pattern should not be engaged when strong trends are in play. This is because it is bound to perform poorly, since a lot of pullbacks can be interpreted as reversals. Additional filters such as the ADX or Moving Averages could help mitigate this.
Risk management could call for tight stop-losses with this pattern as well. These can be placed slightly beyond the SAR in order to honour the reversal logic. In general, targets can be at support/resistance levels or R multiples of about, say, 1.5. Back testing should also ideally happen when some slippage and broker spreads are being used, given the small time frame preference. It is important to ensure that the pattern is robust under real execution conditions, especially if intraday is used. Test results for our third pattern, with settings/ conditions similar to the already mentioned patterns, give us the following report. This pattern did not forward walk:


SAR Trend Continuation and RVI Gap to Zero
Our fourth pattern is a momentum confirmed trend following signal. It uses SAR-based price relationship to set a positioning bias. The RVI value relative to the zero bound also acts as a confirmation to the type of momentum in play, whether bearish or bullish. The buy signal is when the previous bar’s low is above SAR suggesting SAR is trailing below price, which presents a bullish bias. This is then followed with the current bar’s low still being above the SAR, a confirmation that the trend is intact. The RVI of the current and previous bar would need to be above the zero bound, which is also an indication of sustained momentum. We implement this in MQL5 as follows:
//+------------------------------------------------------------------+
//| Check for Pattern 3.                                             |
//+------------------------------------------------------------------+
bool CSignalSAR_RVI::IsPattern_3(ENUM_POSITION_TYPE T)
{  if(T == POSITION_TYPE_BUY && Low(X() + 1) > SAR(X() + 1) && SAR(X()) < Low(X()) && RVI(X()) > 0.0 && RVI(X() + 1) > 0.0)
   {  return(true);
   }
   else if(T == POSITION_TYPE_SELL && High(X() + 1) < SAR(X() + 1) && SAR(X()) > High(X()) && RVI(X()) < 0.0 && RVI(X() + 1) < 0.0)
   {  return(true);
   }
   return(false);
}
The sell-conditions are similarly for a previous high to be below the SA, a sign of a bearish bias. This is also followed by the current high remaining below the SAR to indicate the trend is sustained. The RVI of the current and previous would also need to be below zero to be consistent with a negative momentum thesis. This pattern type is a trend-confirmation signal. It is not a reversal like pattern 2 which captures the turning points and pattern 3 which requires that momentum and price be aligned with the SAR. The ideal market context for this pattern would be in trending or breakout markets, especially after major pullbacks. With this pattern, it is key to avoid whipsaws by checking to ensure that the RVI keeps the same direction of the recent two bars.
This trend continuation use cases require the pattern to applied only when a prior trend is already underway. Confirmation, with trend filters like ADX being above 25 or slope of a longer period EMA, can also be engaged. Using volatility compression/ breakout filters such as the Bollinger Band squeeze or low STD-DEV can be supplemented to more precisely time entries. A combination with stop placement rules of just below the SAR level for longs or just above for shorts can be used for directional safety. The SAR itself can also serve as a dynamic trailing stop after entry.
The timeframe strategy can be more robust on higher timeframes of 1-hour ad above. This is because trends tend to be more stable in these larger timeframes. The 1-minute and 5-minute timeframe space should be avoided altogether unless it is paired with a larger timeframe for confirmation. The exit criteria can be if RVI flips or if the SAR changes its position relative to price. Our test results for pattern 3 are presented below. This pattern was able to walk:

SAR Reversal with RVI Overbought/Oversold
Our fifth pattern, pattern-4, is a reverse-style signal that seeks to catch price turns with momentum confirmation. The SAR and price relationship does suggest a potential shift in market direction. The RVI crossovers also go on to serve as momentum confirmation filters. The buy signal conditions, feature, the prior bar’s high at or below the prior SAR, a state where price is bearish; followed by the current bar’s low being at or above the SAR which would indicate a flip below price for a bullish setup. The RVI would also have to make a crossover to the upside, as captured by our improvised function RVI-UP. This marks bullish momentum. Furthermore, the current RVI value should be positive to solidify the bullish momentum thesis. We implement this in MQL5 as follows:
//+------------------------------------------------------------------+
//| Check for Pattern 4.                                             |
//+------------------------------------------------------------------+
bool CSignalSAR_RVI::IsPattern_4(ENUM_POSITION_TYPE T)
{  if(T == POSITION_TYPE_BUY && High(X() + 1) <= SAR(X() + 1) && SAR(X()) <= Low(X()) && RVI_UP(X()) && RVI(X()) > 0.0)
   {  return(true);
   }
   else if(T == POSITION_TYPE_SELL && Low(X() + 1) >= SAR(X() + 1) && SAR(X()) >= High(X()) && RVI_DN(X()) && RVI(X()) < 0.0)
   {  return(true);
   }
   return(false);
}
The sell signal conditions conversely are marked by the previous low being at or above the prior SAR, a sign of past bullishness; followed by the current high being at or below the current SAR. This presents a bearish setup. Our RVI-DN function needs to also register an RVI crossover to the downside, a confirmation of bearish momentum. In addition, as with the buy signal, the current RVI value must be negative to confirm the bearish sentiment.
This form of pattern is inherently a momentum-based reversal entry. It capitalizes on SAR flip points and is in addition reinforced by momentum shifts as indicated by the RVI. Its ideal market conditions are when price/markets are near exhaustion of their trends or after failed breakouts. It would also work best when price is extended to an overbought or oversold zone and momentum divergence is present.
When using, it would be good to avoid flat SAR zones. One should not use this pattern is the SAR is highly flippant. Confirmation with additional tools can also be a good idea if complimentary indicators such as the MACD or RSI divergence are engaged to validate the RSI crossover. Timeframe suitability for this particular pattern would probably fall in the 1-hour to 4-hour range in order to capture the strong reversal structures. Shorter timeframes are bound to create many false flips.
Entry conformation with a supplement candle pattern or breakout filter such as the engulfing patterns can also be put to use to better time the entries. The exit plan can be a failure in RVI to maintain momentum, or for the SAR to flip once more after entry. A volatility filer as always can include the STD-DEV or the ATR, in order to suppress signals in overly low-volatility environments. Testing of our fifth pattern, pattern-4, yields the following report over the trained and forward walk periods, It was able to walk:

SAR Consolidation Break with RVI Crossover
Our sixth pattern is a trend continuation breakout signal that is designed to capture entries just after SAR flips to a new trend and RVI momentum confirmations are in-tow. The buy signal requirements are for the prior bar’s low to be above the SAR as a confirmation that price is trending above the ‘trailing stop’. With this established, the current SAR would then also remain below the current bar’s low, a sign of a continuing upward trend. With all of this happening, the RVI would cross over to the upside, a sign that the bullish momentum is ‘renewed’ and in alignment with the prevalent trend. We implement this in MQL5 as follows:
//+------------------------------------------------------------------+
//| Check for Pattern 5.                                             |
//+------------------------------------------------------------------+
bool CSignalSAR_RVI::IsPattern_5(ENUM_POSITION_TYPE T)
{  if(STD_DEV(X()) >= fabs(SAR(X()) - SAR(X() + __PERIOD)))
   {  if(T == POSITION_TYPE_BUY && High(X() + 1) <= SAR(X() + 1) && SAR(X()) <= Low(X()) && RVI_UP(X()))
      {  return(true);
      }
      else if(T == POSITION_TYPE_SELL && Low(X() + 1) >= SAR(X() + 1) && SAR(X()) >= High(X()) && RVI_DN(X()))
      {  return(true);
      }
   }
   return(false);
}
The sell-requirements have the prior bar’s high being below the SAR, an indication of a downtrend; followed by the same conditions being replicated on the current bar with the high again being below the SAR, a sign of sustained selling pressure. This would happen in tandem with an RVI crossover to the downside to mark weakening momentum. The core premise of this pattern is that it uses SAR position confirmation and the RVI crossover where the price location relative to the SAR, with momentum alignment, is used in trade entry in order to minimize early reversals. Differences from pattern 3 and 4 is that pattern 5 filters only for SAR continuation with RVI agreement but no volatility checks.
When using pattern-5, it should be used ideally in trending markets. One should look to engage this when strong directional moves are in play or after a major pullback that re-confirms trend and momentum. One should avoid sideways or whipsaw conditions with this pattern. In low volatility settings or during SAR whipsaw situations, pattern-5 can lead to a lot of false signals due to tight SAR flips and misleading RVI crosses. RVI confirmation serves as a momentum gate for this pattern. Multi timeframe confirmation can be engaged as well for sharper entry points.
It is also vital to ensure that optimal SAR settings are in play when using this pattern, which is why it may be a good idea to revisit the acceleration and maximum parameter settings to ensure they work well with the asset being tested. Integration with risk filters such as the STD-DEV and ATR is also, again, something that should be welcomed when dealing with this pattern. This particularly avoids entry into quiet markets. Test results for pattern-5 present us with the following report that walked forward:

SAR Trend with RVI Pullback
Our seventh pattern is a volatility compression reversal signal that attempts to identify price rejection zones where SAR pressure is consistent and RVI momentum is congested or weak. The buy condition logic is if the prior bar’s high is below or equal to the previous SAR meaning price was under SAR’s resistance, but now the current SAR is below or equal to the current low price; a sign the SAR has dipped and is now serving as support. This would happen with a backdrop of the RVI value that is close to zero, signalling low to neutral momentum. The RVI value being close to zero is usually a sign that the market is coiling up for a potential breakout. We implement this in MQL5 as follows:
//+------------------------------------------------------------------+
//| Check for Pattern 6.                                             |
//+------------------------------------------------------------------+
bool CSignalSAR_RVI::IsPattern_6(ENUM_POSITION_TYPE T)
{  if(T == POSITION_TYPE_BUY && Low(X() + 1) > SAR(X() + 1) && SAR(X()) < Low(X()) && RVI_UP(X()))
   {  return(true);
   }
   else if(T == POSITION_TYPE_SELL && High(X() + 1) < SAR(X() + 1) && SAR(X()) > High(X()) && RVI_DN(X()))
   {  return(true);
   }
   return(false);
}
The sell condition logic for our seventh pattern features the prior bar’s low being above or equal to the prior SAR, a sign the price was in the support role. This is then followed by the current SAR flipping to be above or equal to the current high as the SAR climbs above price. The RVI would be at the near zero with low or fading momentum just before a reversal.
The point of using the RVI filter with a point-size is for it to act as a volatility suppression filter. This helps mark the quiet momentum phase that often occurs just before a breakout or reversal. The strategic objective of this pattern is that it is meant to fade the previous direction during a compression phase where the SAR is trying to reverse and the RVI is not yet directional, hence it is a countertrend edge condition.
Ideal use cases for the seventh pattern is in range-bound markets, especially near key support/ resistance areas. It should be avoided in strong trending conditions. It can be paired with breakout logic. Furthermore, it is important to monitor the spread and pip values, as this pattern is sensitive to them. The use of time of day filters can also boost this pattern's performance. Testing for our seventh pattern gives us the following report that did not walk forward:


SAR Trend with RVI Double formation
Our eighth pattern, pattern-7, is designed to spot momentum based breakout entries that are confirmed by multiple RVI up/down signals after a SAR positioning. It looks for a trend continuation after a momentum breakout. This is typically a shift from price rejection to directionality that is confirmed. The buy conditions are when the previous candle low is above the SAR, suggesting price is holding above SAR support; followed by the current SAR also staying below the price low, affirming that the SAR is trailing price. We would have had two RVI upward flips within a duration that does not exceed the indicator used input period. In the case of the bullish signal, this amounts to a recent double bottom. We implement this in MQL5 as follows:
//+------------------------------------------------------------------+
//| Check for Pattern 7.                                             |
//+------------------------------------------------------------------+
bool CSignalSAR_RVI::IsPattern_7(ENUM_POSITION_TYPE T)
{  if(T == POSITION_TYPE_BUY && High(X() + 1) <= SAR(X() + 1) && SAR(X()) <= Low(X()) && fabs(RVI(X())) <= 250.0 * m_symbol.Point())
   {  return(true);
   }
   else if(T == POSITION_TYPE_SELL && Low(X() + 1) >= SAR(X() + 1) && SAR(X()) >= High(X()) && fabs(RVI(X())) <= 250.0 * m_symbol.Point())
   {  return(true);
   }
   return(false);
}
The sell condition is conversely when the previous high of the candle was below the SAR, a sign that price is below the SAR resistance. This is followed by the current SAR maintaining its sub SAR position with two recent RVI dip crosses within the indicator period length. The intent of the double confirmation logic is to filter out false starts and weak impulses. It introduces an aspect of delayed confirmation, a form of momentum filtering, which ensures better trend quality. Also, in the risk reward context, since this pattern looks for a double bottom or double top in the RVI, within the RVI indicator period, this suggests that entries are only made if momentum is continuing which is a good safety measure. Testing of this pattern-7 presents us with the following report that walked forward:

SAR Acceleration with RVI Spike
Our ninth pattern, pattern-8, seeks acceleration confirmation from both price-to-SAR distance and RVI momentum. It evaluates if the gap from price to the SAR is widening. This often serves as a proxy for trend strength, while ensuring that RVI momentum is also keeping apace in the same direction. The buy logic is if the low is above SAR for the last 2 bars and the gap between this low and the SAR is widening, coupled with increasing changes in the RVI to the upside. This is coded in MQL5 as follows:
//+------------------------------------------------------------------+
//| Check for Pattern 8.                                             |
//+------------------------------------------------------------------+
bool CSignalSAR_RVI::IsPattern_8(ENUM_POSITION_TYPE T)
{  if(T == POSITION_TYPE_BUY && Low(X() + 1) > SAR(X() + 1) && SAR(X()) < Low(X()) && RVI_UP(X()))
   {  bool _double = false;
      for(int i = X() + 1; i < X() + __PERIOD + 1; i++)
      {  if(RVI_UP(i))
         {  _double = true;
            break;
         }
      }
      return(_double);
   }
   else if(T == POSITION_TYPE_SELL && High(X() + 1) < SAR(X() + 1) && SAR(X()) > High(X()) && RVI_DN(X()))
   {  bool _double = false;
      for(int i = X() + 1; i < X() + __PERIOD + 1; i++)
      {  if(RVI_DN(i))
         {  _double = true;
            break;
         }
      }
      return(_double);
   }
   return(false);
}
The sell logic is similarly two successive bars of the SAR being above the high price, with this gap between the SAR and the high price on the expansion. This would also happen when changes in the RVI are increasing towards the downside, a form of bearish acceleration. The use of second order RVI differences captures second derivative like behaviour. This aims to a convex curve or rising momentum, not just present momentum.
This pattern avoids basic crossovers, such as in pattern-7. It does not utilise crossover events, but instead capitalises on rate of change, which can reduce the noise of quick reversals. It also assumes momentum expands with price, which is its core philosophy. In other words, momentum must rise when price is also indicating directional breakout. Our test results are as follows for this pattern and we do have a positive forward walk:

Conclusion
We wrap up our first look at the patterns of the Parabolic SAR and the Relative Vigour Index here. We have not covered pattern-9, the tenth pattern, as the article was getting a bit too lengthy. The full source code for all 10 patterns is attached below, readers are at liberty to dig in and make amends. The code is meant to be used with the MQL5 wizard, for new readers, and guidance can be found here for those who need it. In the next article, where we look to supplement these signal patterns with supervised meaning, we will focus on the patterns that were not able to successfully forward walk.
| name | description |
|---|---|
| WZ-69.mq5 | Wizard Assembled Expert Advisor whose header indicates files used |
| SignalWZ-69.mqh | Custom Signal Class File used by the MQL5 Wizard in assembling the Expert Advisor |
Warning: All rights to these materials are reserved by MetaQuotes Ltd. Copying or reprinting of these materials in whole or in part is prohibited.
This article was written by a user of the site and reflects their personal views. MetaQuotes Ltd is not responsible for the accuracy of the information presented, nor for any consequences resulting from the use of the solutions, strategies or recommendations described.
- Free trading apps
- Over 8,000 signals for copying
- Economic news for exploring financial markets
You agree to website policy and terms of use