Articles on the MQL5 programming and use of technical indicators
Technical indicators constitute an important part of trading, and every trader tries to find something new. The authors of these articles talk about econometrics and machine learning, automatic marking of Elliott Waves and digital filters - everything from the classical methods of analysis to the modern interpretation of classical ideas.
The category features articles that will teach you how to develop a custom indicator and contains unique collections of ready-to-use mathematically explained William Blau's trading ideas.
Add a new article

You are missing trading opportunities:
- Free trading apps
- Over 8,000 signals for copying
- Economic news for exploring financial markets
Registration
Log in
You agree to website policy and terms of use
If you do not have an account, please register


Extending MQL5 Standard Library and Reusing Code
MQL5 Standard Library makes your life as a developer easier. Nevertheless, it does not implement all the needs of all developers in the world, so if you feel that you need some more custom stuff you can take a step further and extend. This article walks you through integrating MetaQuotes' Zig-Zag technical indicator into the Standard Library. We get inspired by MetaQuotes' design philosophy to achieve our goal.

Developing Advanced ICT Trading Systems: Implementing Signals in the Order Blocks Indicator
In this article, you will learn how to develop an Order Blocks indicator based on order book volume (market depth) and optimize it using buffers to improve accuracy. This concludes the current stage of the project and prepares for the next phase, which will include the implementation of a risk management class and a trading bot that uses signals generated by the indicator.
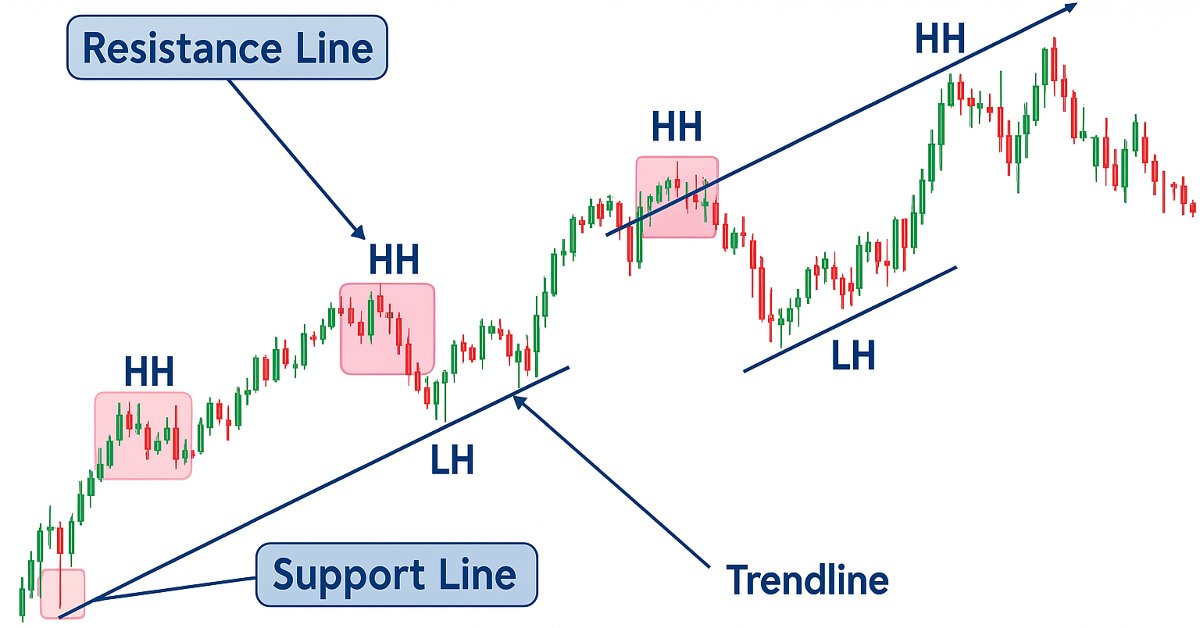
Price Action Analysis Toolkit Development (Part 19): ZigZag Analyzer
Every price action trader manually uses trendlines to confirm trends and spot potential turning or continuation levels. In this series on developing a price action analysis toolkit, we introduce a tool focused on drawing slanted trendlines for easy market analysis. This tool simplifies the process for traders by clearly outlining key trends and levels essential for effective price action evaluation.

Practical Use of Kohonen Neural Networks in Algorithmic Trading. Part II. Optimizing and forecasting
Based on universal tools designed for working with Kohonen networks, we construct the system of analyzing and selecting the optimal EA parameters and consider forecasting time series. In Part I, we corrected and improved the publicly available neural network classes, having added necessary algorithms. Now, it is time to apply them to practice.

Everything you need to learn about the MQL5 program structure
Any Program in any programming language has a specific structure. In this article, you will learn essential parts of the MQL5 program structure by understanding the programming basics of every part of the MQL5 program structure that can be very helpful when creating our MQL5 trading system or trading tool that can be executable in the MetaTrader 5.

Building a Professional Trading System with Heikin Ashi (Part 2): Developing an EA
This article explains how to develop a professional Heikin Ashi-based Expert Advisor (EA) in MQL5. You will learn how to set up input parameters, enumerations, indicators, global variables, and implement the core trading logic. You will also be able to run a backtest on gold to validate your work.

How to integrate Smart Money Concepts (OB) coupled with Fibonacci indicator for Optimal Trade Entry
The SMC (Order Block) are key areas where institutional traders initiate significant buying or selling. After a significant price move, fibonacci helps to identify potential retracement from a recent swing high to a swing low to identify optimal trade entry.

Designing and implementing new GUI widgets based on CChartObject class
After I wrote a previous article on semi-automatic Expert Advisor with GUI interface it turned out that it would be desirable to enhance interface with some new functionalities for more complex indicators and Expert Advisors. After getting acquainted with MQL5 standard library classes I implemented new widgets. This article describes a process of designing and implementing new MQL5 GUI widgets that can be used in indicators and Expert Advisors. The widgets presented in the article are CChartObjectSpinner, CChartObjectProgressBar and CChartObjectEditTable.

Building and testing Keltner Channel trading systems
In this article, we will try to provide trading systems using a very important concept in the financial market which is volatility. We will provide a trading system based on the Keltner Channel indicator after understanding it and how we can code it and how we can create a trading system based on a simple trading strategy and then test it on different assets.

Price Action Analysis Toolkit Development (Part 51): Revolutionary Chart Search Technology for Candlestick Pattern Discovery
This article is intended for algorithmic traders, quantitative analysts, and MQL5 developers interested in enhancing their understanding of candlestick pattern recognition through practical implementation. It provides an in‑depth exploration of the CandlePatternSearch.mq5 Expert Advisor—a complete framework for detecting, visualizing, and monitoring classical candlestick formations in MetaTrader 5. Beyond a line‑by‑line review of the code, the article discusses architectural design, pattern detection logic, GUI integration, and alert mechanisms, illustrating how traditional price‑action analysis can be automated efficiently.

Multiple indicators on one chart (Part 04): Advancing to an Expert Advisor
In my previous articles, I have explained how to create an indicator with multiple subwindows, which becomes interesting when using custom indicators. This time we will see how to add multiple windows to an Expert Advisor.
Using Layouts and Containers for GUI Controls: The CGrid Class
This article presents an alternative method of GUI creation based on layouts and containers, using one layout manager — the CGrid class. The CGrid class is an auxiliary control that acts as a container for other containers and controls using a grid layout.

Price Action Analysis Toolkit Development (Part 52): Master Market Structure with Multi-Timeframe Visual Analysis
This article presents the Multi‑Timeframe Visual Analyzer, an MQL5 Expert Advisor that reconstructs and overlays higher‑timeframe candles directly onto your active chart. It explains the implementation, key inputs, and practical outcomes, supported by an animated demo and chart examples showing instant toggling, multi‑timeframe confirmation, and configurable alerts. Read on to see how this tool can make chart analysis faster, clearer, and more efficient.
Creating Graphical Panels Became Easy in MQL5
In this article, we will provide a simple and easy guide to anyone who needs to create one of the most valuable and helpful tools in trading which is the graphical panel to simplify and ease doing tasks around trading which helps to save time and focus more on your trading process itself without any distractions.

Learn how to design a trading system by Bull's Power
Welcome to a new article in our series about learning how to design a trading system by the most popular technical indicator as we will learn in this article about a new technical indicator and how we can design a trading system by it and this indicator is the Bull's Power indicator.

Price Action Analysis Toolkit Development (Part 1): Chart Projector
This project aims to leverage the MQL5 algorithm to develop a comprehensive set of analysis tools for MetaTrader 5. These tools—ranging from scripts and indicators to AI models and expert advisors—will automate the market analysis process. At times, this development will yield tools capable of performing advanced analyses with no human involvement and forecasting outcomes to appropriate platforms. No opportunity will ever be missed. Join me as we explore the process of building a robust market analysis custom tools' chest. We will begin by developing a simple MQL5 program that I have named, Chart Projector.

Testing different Moving Average types to see how insightful they are
We all know the importance of the Moving Average indicator for a lot of traders. There are other Moving average types that can be useful in trading, we will identify these types in this article and make a simple comparison between each one of them and the most popular simple Moving average type to see which one can show the best results.
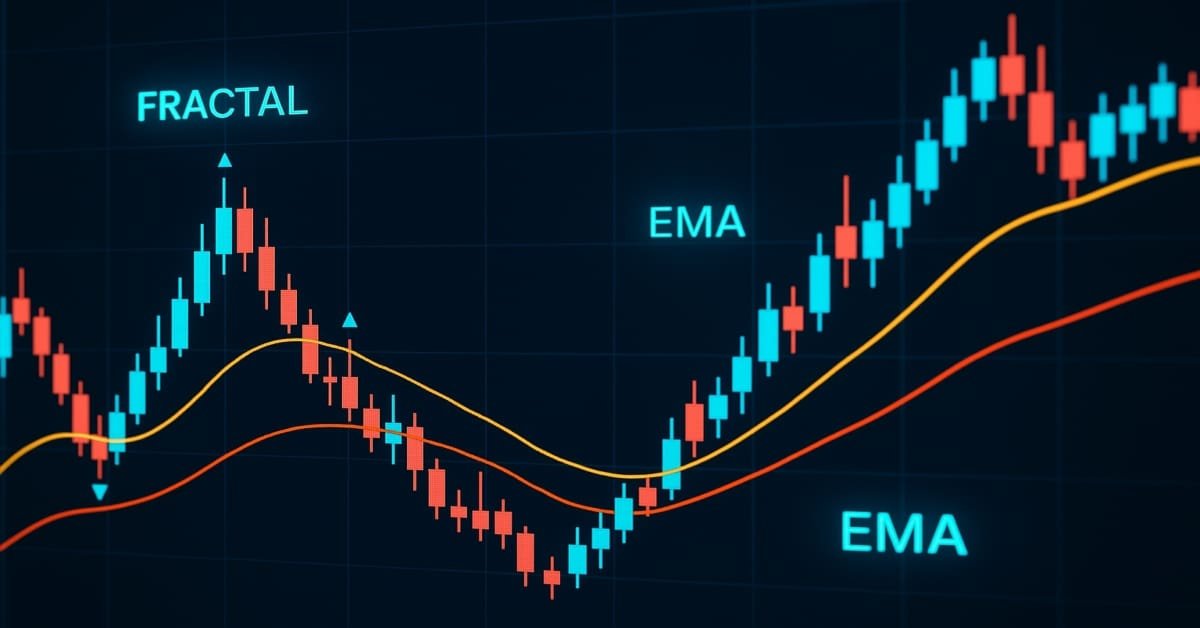
Price Action Analysis Toolkit Development (Part 25): Dual EMA Fractal Breaker
Price action is a fundamental approach for identifying profitable trading setups. However, manually monitoring price movements and patterns can be challenging and time-consuming. To address this, we are developing tools that analyze price action automatically, providing timely signals whenever potential opportunities are detected. This article introduces a robust tool that leverages fractal breakouts alongside EMA 14 and EMA 200 to generate reliable trading signals, helping traders make informed decisions with greater confidence.
Multicurrency monitoring of trading signals (Part 3): Introducing search algorithms
In the previous article, we developed the visual part of the application, as well as the basic interaction of GUI elements. This time we are going to add internal logic and the algorithm of trading signal data preparation, as well us the ability to set up signals, to search them and to visualize them in the monitor.

Price Action Analysis Toolkit Development (Part 49): Integrating Trend, Momentum, and Volatility Indicators into One MQL5 System
Simplify your MetaTrader 5 charts with the Multi Indicator Handler EA. This interactive dashboard merges trend, momentum, and volatility indicators into one real‑time panel. Switch instantly between profiles to focus on the analysis you need most. Declutter with one‑click Hide/Show controls and stay focused on price action. Read on to learn step‑by‑step how to build and customize it yourself in MQL5.
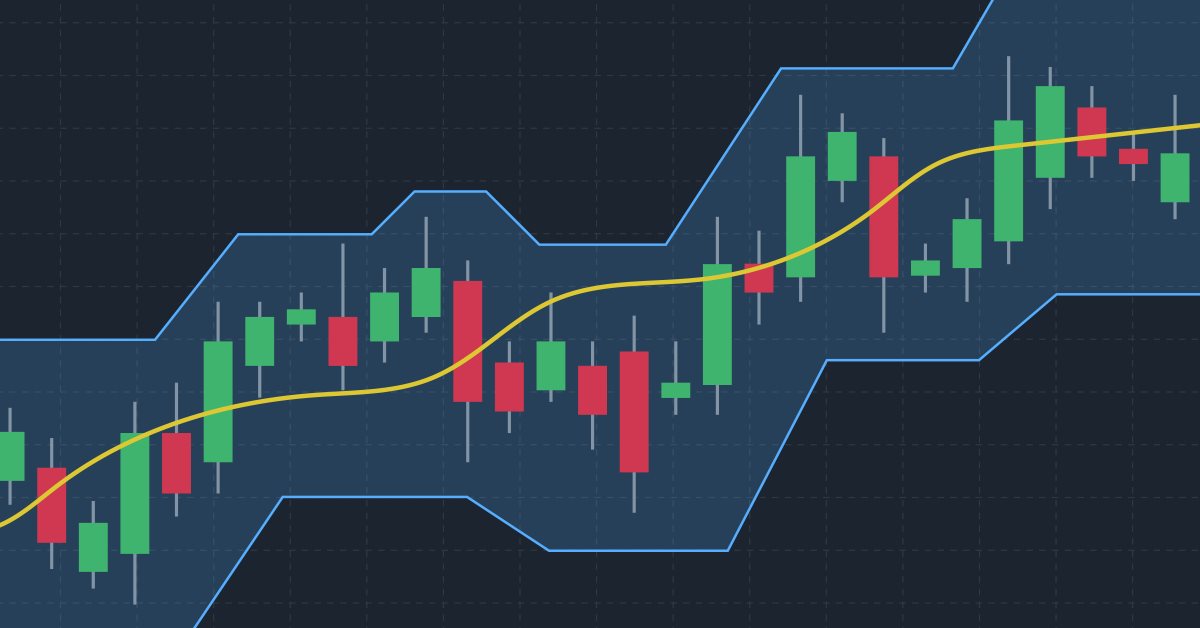
How to create a custom Donchian Channel indicator using MQL5
There are many technical tools that can be used to visualize a channel surrounding prices, One of these tools is the Donchian Channel indicator. In this article, we will learn how to create the Donchian Channel indicator and how we can trade it as a custom indicator using EA.

Learn how to design a trading system by Bill Williams' MFI
This is a new article in the series in which we learn how to design a trading system based on popular technical indicators. This time we will cover Bill Williams' Market Facilitation Index (BW MFI).

Implementing a Rapid-Fire Trading Strategy Algorithm with Parabolic SAR and Simple Moving Average (SMA) in MQL5
In this article, we develop a Rapid-Fire Trading Expert Advisor in MQL5, leveraging the Parabolic SAR and Simple Moving Average (SMA) indicators to create a responsive trading strategy. We detail the strategy’s implementation, including indicator usage, signal generation, and the testing and optimization process.

Building and testing Aroon Trading Systems
In this article, we will learn how we can build an Aroon trading system after learning the basics of the indicators and the needed steps to build a trading system based on the Aroon indicator. After building this trading system, we will test it to see if it can be profitable or needs more optimization.
Price Action Analysis Toolkit Development (Part 47): Tracking Forex Sessions and Breakouts in MetaTrader 5
Global market sessions shape the rhythm of the trading day, and understanding their overlap is vital to timing entries and exits. In this article, we’ll build an interactive trading sessions EA that brings those global hours to life directly on your chart. The EA automatically plots color‑coded rectangles for the Asia, Tokyo, London, and New York sessions, updating in real time as each market opens or closes. It features on‑chart toggle buttons, a dynamic information panel, and a scrolling ticker headline that streams live status and breakout messages. Tested on different brokers, this EA combines precision with style—helping traders see volatility transitions, identify cross‑session breakouts, and stay visually connected to the global market’s pulse.

Creating multi-symbol, multi-period indicators
In this article, we will look at the principles of creating multi-symbol, multi-period indicators. We will also see how to access the data of such indicators from Expert Advisors and other indicators. We will consider the main features of using multi-indicators in Expert Advisors and indicators and will see how to plot them through custom indicator buffers.

Learn how to design a trading system by Gator Oscillator
A new article in our series about learning how to design a trading system based on popular technical indicators will be about the Gator Oscillator technical indicator and how to create a trading system through simple strategies.

From Novice to Expert: Support and Resistance Strength Indicator (SRSI)
In this article, we will share insights on how to leverage MQL5 programming to pinpoint market levels—differentiating between weaker and strongest price levels. We will fully develop a working, Support and Resistance Strength Indicator (SRSI).

Price Action Analysis Toolkit Development (Part 26): Pin Bar, Engulfing Patterns and RSI Divergence (Multi-Pattern) Tool
Aligned with our goal of developing practical price-action tools, this article explores the creation of an EA that detects pin bar and engulfing patterns, using RSI divergence as a confirmation trigger before generating any trading signals.

Complex indicators made easy using objects
This article provides a method to create complex indicators while also avoiding the problems that arise when dealing with multiple plots, buffers and/or combining data from multiple sources.
Timeseries in DoEasy library (part 45): Multi-period indicator buffers
In this article, I will start the improvement of the indicator buffer objects and collection class for working in multi-period and multi-symbol modes. I am going to consider the operation of buffer objects for receiving and displaying data from any timeframe on the current symbol chart.

Developing a Trading Strategy: The Triple Sine Mean Reversion Method
This article introduces the Triple Sine Mean Reversion Method, a trading strategy built upon a new mathematical indicator — the Triple Sine Oscillator (TSO). The TSO is derived from the sine cube function, which oscillates between –1 and +1, making it suitable for identifying overbought and oversold market conditions. Overall, the study demonstrates how mathematical functions can be transformed into practical trading tools.

Price Action Analysis Toolkit Development (Part 39): Automating BOS and ChoCH Detection in MQL5
This article presents Fractal Reaction System, a compact MQL5 system that converts fractal pivots into actionable market-structure signals. Using closed-bar logic to avoid repainting, the EA detects Change-of-Character (ChoCH) warnings and confirms Breaks-of-Structure (BOS), draws persistent chart objects, and logs/alerts every confirmed event (desktop, mobile and sound). Read on for the algorithm design, implementation notes, testing results and the full EA code so you can compile, test and deploy the detector yourself.

Learn how to design a trading system by Force Index
Welcome to a new article in our series about how to design a trading system by the most popular technical indicators. In this article, we will learn about a new technical indicator and how to create a trading system using the Force Index indicator.

Building a Custom Market Regime Detection System in MQL5 (Part 1): Indicator
This article details creating an MQL5 Market Regime Detection System using statistical methods like autocorrelation and volatility. It provides code for classes to classify trending, ranging, and volatile conditions and a custom indicator.

Learn how to design a trading system by DeMarker
Here is a new article in our series about how to design a trading system by the most popular technical indicators. In this article, we will present how to create a trading system by the DeMarker indicator.

Creating an MQL5 Expert Advisor Based on the PIRANHA Strategy by Utilizing Bollinger Bands
In this article, we create an Expert Advisor (EA) in MQL5 based on the PIRANHA strategy, utilizing Bollinger Bands to enhance trading effectiveness. We discuss the key principles of the strategy, the coding implementation, and methods for testing and optimization. This knowledge will enable you to deploy the EA in your trading scenarios effectively

Building A Candlestick Trend Constraint Model(Part 2): Merging Native Indicators
This article focuses on taking advantage of in-built meta trader 5 indicators to screen out off-trend signals. Advancing from the previous article we will explore how to do it using MQL5 code to communicate our idea to the final program.
Learn how to design a trading system by Accumulation/Distribution (AD)
Welcome to the new article from our series about learning how to design trading systems based on the most popular technical indicators. In this article, we will learn about a new technical indicator called Accumulation/Distribution indicator and find out how to design an MQL5 trading system based on simple AD trading strategies.

Developing a trading Expert Advisor from scratch (Part 31): Towards the future (IV)
We continue to remove separate parts from our EA. This is the last article within this series. And the last thing to be removed is the sound system. This can be a bit confusing if you haven't followed these article series.