
MQL5 Wizard Techniques you should know (Part 53): Market Facilitation Index
Introduction
The article was meant to be on machine learning given the sequence that has been in place with the past pieces; however, I am sticking with a trade indicator because some material for the next machine learning piece is not quite ready. It will be soon, hopefully.
The Market Facilitation Index (MFI) reflects the market's ability to make price changes within a set timeframe. Perhaps to better set the stage, it may be useful to contrast it with another Bill Williams Indicator we covered in the last article, the Awesome Oscillator (AO). If we start with focus/ purpose, AO tracks momentum via a comparison between 34 period and 5 period median price averages, with the thesis that larger magnitude changes represent huge momentum shifts and vice versa. MFI on the other hand dwells on the efficiency of price movement relative to volume, or it seeks to answer the question if trade volume was x amount by how much will price respond vs if it was y amount.
The AO uses the zero line context to interpret the type of momentum in play. In fact, all Bill Williams indicators covered so far are zero-line dependent, however the MFI does not. It generates absolute values based on price range and volume, which necessitates direct comparison of changes in the MFI. Use cases are also slightly different because MFI as mentioned is suited for understanding market efficiency and volume dynamics, especially when paired with other indicators and seeking confirmation of breakouts. AO, on the other hand, is ideal for use in trend following strategies since it helps in pinpointing fractals or shifts in momentum.
![]()
Where:
- High: The highest price of the selected time period.
- Low: The lowest price of the selected time period.
- Volume: The total trading volume during that period.
While the MFI itself, does provide an indicator value, its use/ significance stems from tracking its changes in different market/ volatility conditions. As a positive only histogram Oscillator, it does provide a number of key colours worth mentioning.
The green colour signifying:
![]()
The blue colour:
![]()
The brown colour:
![]()
And the pink colour:
![]()
We determine or set our colours in MQL5 as follows:
   color             Color(int ind)
   {  //
      return(
               (Volume(ind) > Volume(ind + 1) && MFI(ind) > MFI(ind + 1)) ? clrGreen :
               ((Volume(ind) < Volume(ind + 1) && MFI(ind) < MFI(ind + 1)) ? clrBrown :
                ((Volume(ind) < Volume(ind + 1) && MFI(ind) > MFI(ind + 1)) ? clrBlue :
                 ((Volume(ind) > Volume(ind + 1) && MFI(ind) < MFI(ind + 1)) ? clrPink : clrNONE
                 ))));
   }
In determining volume, we are relying on tick volume, since real/ contract volume is unheard-of (particularly in forex). If trading equities though and this information is available, then it should be used instead.
Tick-Volume vs Real-Volume
The simplest definition of Tick-volume, that is pertinent to MFI, would be a number of price changes over a set timeframe. This is simplistic because usually ticks represent more than just price changes. They often include any change to the contract info of the traded security, which would encompass things like swap rates, trade-stop level, etc. In forex trading though, because of the decentralized nature of forex markets, real volume data is not available for many brokers and this therefore makes tick-volume the best alternative.
Real volume, on the other hand, represents the actual number of contracts or lots traded during a set time frame and this is very common in the centralized market of stocks and futures but rare in forex. Studies have shown a strong correlation between tick volume and real volume, so the proxy of tick volume we are using in this article is not far off from the ideal.
In addition, using tick volume in system development with a particular broker can make the Expert Advisor more compatible or usable with other brokers because for the most part, tick volume is accessible across most brokers and does not significantly sway performance between brokers unlike real volume if you were to find a particular broker offering it. Its strong positive correlation with market activity and low usage costs are other major advantages for using tick volume.
It does have its limitations as well, as one would expect. Chief among them is the over consideration of price changes and trade security information changes. If the price of a security oscillates between any two prices rapidly in a short interval, each such oscillation would count as a tick and therefore a volume unit even though no actual traction in price is reflected. The argument for counting this is it tracks the size of market participants. However, if trader x placed a large order with a lot of volume and the price change went on to span several points, that price change would only be logged as a single tick.
Furthermore, even though tick data is widely accessible across most brokers given that they usually have different liquidity providers, the number of ticks logged at a particular point in time can vary quite a bit across brokers which in principle would mean that testing with the intended brokers data before deployment would be necessary. In addition, in low Volatility markets or quiet markets, minor price changes can create misleading tick volume spikes.
So, to sum up, real-volume especially when trading equities or securities in centralized markets is preferred to tick volume since it better captures market participation, which also means it's a better tracker of key patterns like divergence, and also less susceptible to noise from price fluctuations as argued above. The challenge with using real volume in forex is, as mentioned, it has limited availability since few brokers offer it, and the few that do may require premium accounts for subscription to this volume data. On top of that, the offered data is likely to be inconsistent from broker to broker because of the decentralized nature of the market.
Absolute Value Significance
The MFI also has one more quirk. Its absolute value is not that significant. If one considers other oscillators such as the RSI or even the Commodity Channel Index, their absolute values are key thresholds that can be used to make crucial decision, for instance when RSI crosses the 30 threshold.
The absolute values of the MFI are not so important. Ironically, they are larger on small time frames, while they are much smaller on larger time frames! I guess since most traders who want to avoid noise and always focus on the larger time frames can take this as a clue that the absolute values of the MFI by themselves are not that significant.
What tends to matter here is the relative importance of the adjacent bars; not their values.
Green Signal
Our first pattern is the basic green signal, where we are looking for a green coloured histogram to act as an entry signal. As you'll note with this and all subsequent patterns, the MFI needs to be paired with either price action or another indicator in order to infer a particular trend of either bullish or bearish.
So, for the bullish Signal we would need to have a green histogram, which as mentioned above implies positive correlation between price action and volume, together with a close price that is above a prevalent moving average. We are using an indicator period of 8 and are not optimizing this value, but changes to this are up to the reader. Implementing this pattern in MQL5 is as follows:
//+------------------------------------------------------------------+
//| Check for Pattern 0.                                             |
//+------------------------------------------------------------------+
bool CSignalMFI::IsPattern_0(ENUM_POSITION_TYPE T)
{  if(Color(X()) == clrGreen)
   {  if(T == POSITION_TYPE_BUY && Close(X()) > MA(X()))
      {  return(true);
      }
      else if(T == POSITION_TYPE_SELL && Close(X()) < MA(X()))
      {  return(true);
      }
   }
   return(false);
}
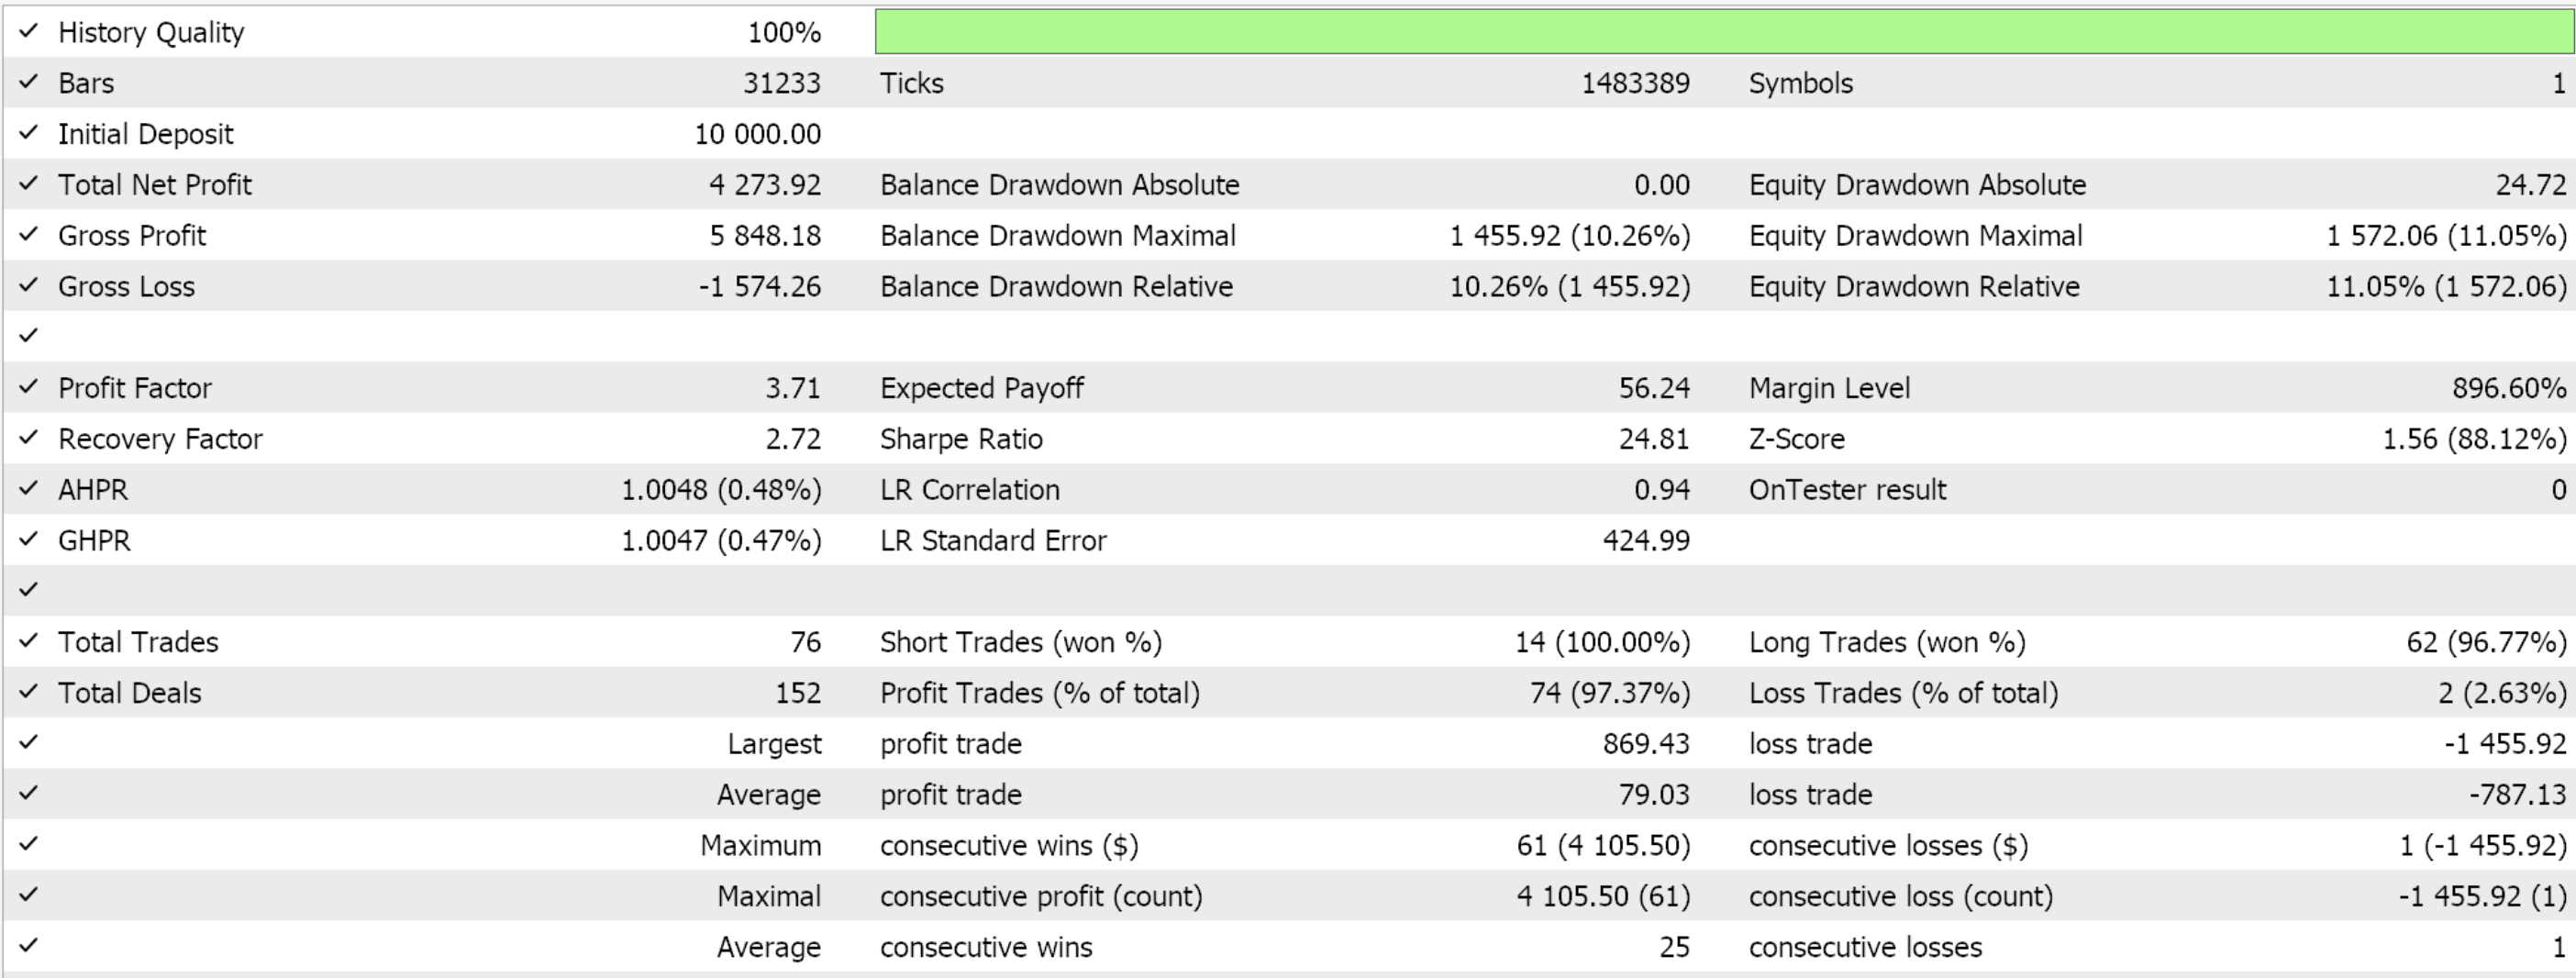
This pattern, which is labelled 0 being the first as we have been doing throughout these articles, can be tested solely by assigning the input parameter ‘Patterns Used Bitmap’ the value 1. If we do this and perform optimization runs for the pair EUR JPY over the year 2023 on the 12-minute time frame, we are presented by the following test results from some of the fair input settings:

Since we are testing wizard assembled Expert Advisors basing on the code of our custom signal class, typically we optimize for open & close thresholds, entry price delta, the expiry of pending orders, and of course, the threshold value for the tested/ selected pattern. Thresholds range from 0 to 100. For readers that are new, there is guidance here and here on how to use the code attached at the end of the article to assemble an Expert Advisor via the MQL5 Wizard.
Our pattern-0 is therefore best suited for trend confirmation, as it would fit well with trend following strategies.
Fade Pattern
Our next pattern, pattern-1, refers to circumstances where the MFI marks a decrease in momentum despite continued trending in price. It usually represents a loss of buying or selling pressure and is therefore used to anticipate reversals or market consolidations. The prime way of identifying the Fade pattern is via divergence, in situations where a pink MFI gets signalled while price continues to rise (which would be a bearish divergence) or a pink MFI is marked with falling prices (which would be a bullish divergence). We implement this in MQL5 as follows:
//+------------------------------------------------------------------+
//| Check for Pattern 1.                                             |
//+------------------------------------------------------------------+
bool CSignalMFI::IsPattern_1(ENUM_POSITION_TYPE T)
{  if(Color(X()) == clrPink)
   {  if(T == POSITION_TYPE_BUY && Close(X()) < MA(X()))
      {  return(true);
      }
      else if(T == POSITION_TYPE_SELL && Close(X()) > MA(X()))
      {  return(true);
      }
   }
   return(false);
}
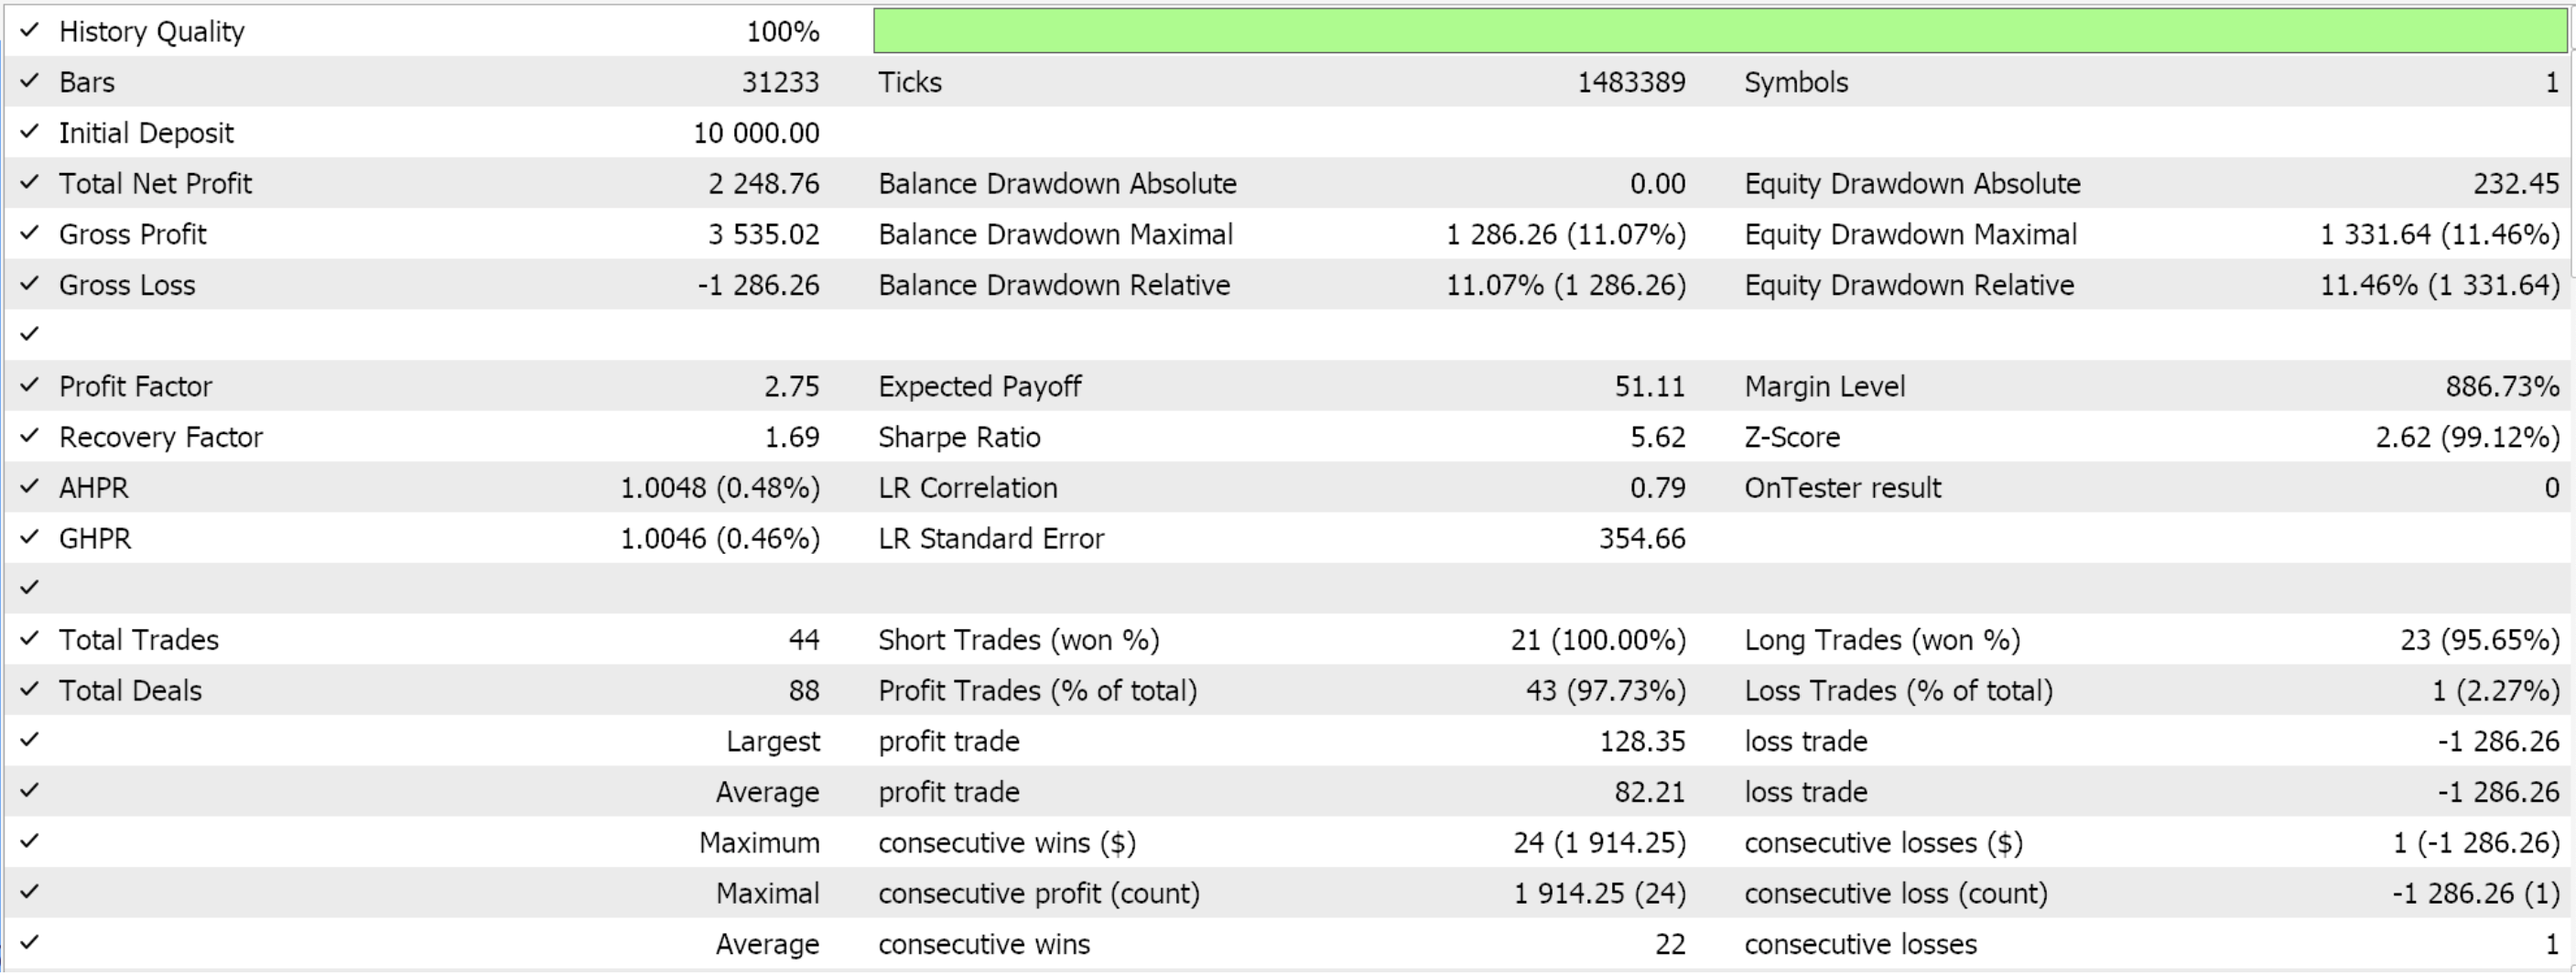
Pattern-1 is also marked by flattening after peaks in price. As can be seen from the pink colour formula above, the pink pattern is primarily a result of declining volume, and this in turn reduces the ability to sustain prevalent trends. Testing with the same pair above EUR JPY on a 12-minute time frame gives us the following report.

The inputs used for this run are from optimizing for the same parameters as outlined above, open & close thresholds, entry price gap, pending order expiry, and pattern threshold. Since we were testing exclusively with pattern 1, the input bitmap for patterns used is 2 to the power 2 which comes to 2.
Possible causes of this pattern besides the obvious decreasing volume are profit taking from traders, or an exhaustion in momentum. Its Implications are also a bit diverse. It could be an early signal to a reversal, meaning traders can prepare to exit current open positions or make entries in the opposite direction. Alternatively, it could be a consolidation warning, especially when it is observed without volatility or a divergence.
However, the fade is more reliable as a signal when it is accompanied by price divergence, since this serves as a high probability for reversal. Risk Management involving the use of tighter stops can be undertaken, since the fade pattern will act as a warning for these position adjustments. Also, combination with Bollinger Bands and moving averages can help in marking retracements and further confirming signals.
Fake Signal
Pattern-2, which is hallmarked by the blue MFI, is also referred to as the Fake Signal. “Fake” because price action on the chart is not corroborated by volume. It often traps traders into taking positions too early, leading to losses. Common in choppy or non-volatile markets thanks to prevalence of false breakouts and reversals, we implement it in MQl5 as follows:
//+------------------------------------------------------------------+
//| Check for Pattern 2.                                             |
//+------------------------------------------------------------------+
bool CSignalMFI::IsPattern_2(ENUM_POSITION_TYPE T)
{  if(Color(X()) == clrBlue)
   {  if(T == POSITION_TYPE_BUY && Close(X()) < MA(X()))
      {  return(true);
      }
      else if(T == POSITION_TYPE_SELL && Close(X()) > MA(X()))
      {  return(true);
      }
   }
   return(false);
}
First off, we check to ensure our MFI histogram is coloured blue, which as shared in the formula above implies price range is increasing on decreasing volume. Once the blue colour is confirmed, a bullish pattern is if we have the close price below the moving average, while a bearish pattern is the reverse with the close price being above the MA.
The central thesis behind our implementation is that current price action is not reflecting underlying trends, and therefore a correction is imminent. We perform an optimization stint over the year 2023 as with the 2 patterns above while using EUR JPY pair on 12 minute time frame and favourable optimization settings from that stint give us the following results:

So, pattern-2 stems from low volume and illiquidity, which often leads to unreliable signals. As a rule, short-term noise from certain spikes in volume due to news events or market manipulation can lead to misleading MFI signals. Also, in instances where the Fake pattern is simply correcting a pullback amidst a major trend, it can serve as a strong trend continuation signal. Solely relying on the MFI without a support indicator could result not just in many trades, but also losses. So, besides the MA indicator we are pairing with MFI in determining pattern-2, an alternative indicator like a price channel can be used to filter out fake patterns that are bound to be indicated a lot in very strong trends in the form of pullbacks.
Besides channel indicators like the Bollinger Bands, candlestick patterns with support/ resistance levels can be employed. And as always, it is important with low probability patterns such as this to wait for confirmation and to use higher time frames in one's analysis.
Squat Pattern
Our pattern-3, the squat pattern, occurs when the MFI whipsaws a lot or flattens in spite of significant price movement or volatility. It is a sign of indecision in the market where buying and selling pressures are almost at par, thus causing the market to “squat” before a breakout or reversal happens.
Marked by the brown colour, we implement it in MQL5 as follows:
//+------------------------------------------------------------------+
//| Check for Pattern 3.                                             |
//+------------------------------------------------------------------+
bool CSignalMFI::IsPattern_3(ENUM_POSITION_TYPE T)
{  if(Color(X()) == clrBrown)
   {  if(T == POSITION_TYPE_BUY && Close(X()+1) <= MA(X()+1) && Close(X()) >= MA(X()))
      {  return(true);
      }
      else if(T == POSITION_TYPE_SELL && Close(X()+1) >= MA(X()+1) && Close(X()) <= MA(X()))
      {  return(true);
      }
   }
   return(false);
}
As we can see from the listing above, the first prerequisite for this pattern is brown histograms for the MFI which, as defined in the formulae in the introduction, are marked by dropping MFI and dropping volume. A potential bullish pattern therefore, with this significant backdrop of uncertainty, would be signalled by the first brown MFI histogram and the crossing of price from below the moving average to close above it.
On the flip side, a bearish pattern would also require a brown histogram from the MFI, but price would cross the MA from above to close below it. As with patterns 0-2, above, if we perform an optimization stint for just this pattern by assigning input for Bitmap used to 2 to the power 3 (8) we are presented with the results below from some of the favourable input settings:

Pattern-3 is a result of volume compression that often occurs in bouts of decreasing trading volume, which marks a lack of market conviction. The squat pattern typically precedes a significant movement in price, as the market is usually transitioning from consolidation to a new trend. Quite often, leading into the squat pattern are accumulation and distribution phases, where traders and institutions may be accumulating or distributing positions to create a balance between buyers and sellers.
These low Volatility Periods can also be the result of periods where markets are awaiting a catalyst, such as economic data releases or geopolitical events. So, these brown MFI regions could be thought of as transition zones, since they typically occur and help define crucial support/ resistance regions in price action. The implications of this are wide-ranging; chiefly they do signal imminent Volatility, since the squat is often interpreted to mean the market is coiling and preparing for a breakout. While the breakout direction itself is not forecast by the squat, pairing it with other indicators and even price action, as we have done with our MQL5 implementation above, can help identify the next direction.
Pattern-3, also offers a good opportunity to set tight stop-loss levels near recent price extremes, which helps minimize risk. Possible alternative entry strategies that can be developed from it, besides our implementation, primarily can centre around filtering for false signals. For instance, by waiting for an up tick in volume after a price breakout one would be relying on 2 signals, not just the price actions.
Divergence Pattern
Our pattern-4 is based on divergence and between the MFI and prevalent price action. Since we have already established that MFI measures price movement per unit of volume, thus revealing how effectively the markets absorb liquidity, it's direction in this context could lead to some confusion. Price trends are binary from our standpoint, meaning we are either considering bullish trends or bearish trends, so this part is straightforward.
However, when it comes to the MFI, an increase in magnitude cannot serve any purpose in this instance because it would either NOT diverge with a bullish trend (meaning rising prices are parallel to rising MFI) or even in case of a bearish rout since it would be reflecting the same. If on the other hand, we look at a decline in the MFI, we can see easily that any prevalent trend in the market would mark a divergence from it.
If lower lows are being set on declining MFI, this would mark a divergence between strong bearish trends and the tepid MFI. Conversely, if higher highs are being set, this would also mark a divergence with a declining MFI since it would be pointing to decreasing price ranges and yet prices would be edging higher. We therefore implement this in MQL5 as follows:
//+------------------------------------------------------------------+
//| Check for Pattern 4.                                             |
//+------------------------------------------------------------------+
bool CSignalMFI::IsPattern_4(ENUM_POSITION_TYPE T)
{  if(T == POSITION_TYPE_BUY && Low(X()+1) > Low(X()) && MFI(X()+1) > MFI(X()))
   {  return(true);
   }
   else if(T == POSITION_TYPE_SELL && High(X()+1) < High(X()) && MFI(X()+1) > MFI(X()))
   {  return(true);
   }
   return(false);
}
From our listing above, on this occasion we do not look for any colour code, however as argued above we simply look for lower lows to mark a bullish signal and higher highs to mark the bearish. And as already mentioned, the MFI should be declining in both cases. Following an optimization stint, as with the prior patterns, we get the following report from some of the favourable inputs of the optimization:

The volume component of the MFI appears to form the crux for this pattern. This is because divergences that are accompanied by decreasing volume often strengthen reversal signals, and on paper this is a sound argument. However, in our case we are exploring rising or constant volume but with declining price ranges as indicated in the MFI absolute value. While this might seem novel, our test results above are promising. Nonetheless, readers can always modify attached source code and experiment with rising MFI for both higher-highs and lower-lows for the bearish and bullish setups, respectively.
It is often also recommended to pair this pattern, pattern-4, with other Bill Williams Indicators like the Awesome Oscillator or Accelerator Oscillator. In addition, when there is a confluence with price structure e.g. support/ resistance, the reliability of this pattern is greatly enhanced. It's also important to note that in strong trend markets, divergences often lead to corrections rather than complete reversals. On the other hand, in range bound markets, the MFI divergence can be more reliable. As already argued above, extra stuff like stop loss placement can be better managed with this pattern as well.
Breakout Signal
Pattern-5 is akin to pattern-1 with the caveat that we are looking for a breakout. This is therefore straightforward, and it's implementation in MQL5 is as follows:
//+------------------------------------------------------------------+
//| Check for Pattern 5.                                             |
//+------------------------------------------------------------------+
bool CSignalMFI::IsPattern_5(ENUM_POSITION_TYPE T)
{  if(Color(X()) == clrGreen)
   {  if(T == POSITION_TYPE_BUY && Close(X()+1) < MA(X()+1) && Close(X()) > MA(X()))
      {  return(true);
      }
      else if(T == POSITION_TYPE_SELL && Close(X()+1) > MA(X()+1) && Close(X()) < MA(X()))
      {  return(true);
      }
   }
   return(false);
}
As is apparent in our listing above, we only added the check for MA crossover in defining this pattern. Test run with selected input settings from an optimization run similar to what we have done with the patterns above presents us with this report:
When price pierces through a key level (whether support or resistance) alongside an MFI green bar, this often marks a valid breakout. The strict definition of key support/resistance levels is often more self-evident in manual trading than when automating a strategy. That's why in strictly applying this pattern, one may opt to make modifications on a security by security basis. Despite the high probability nature of this setup, it could still lack volume support, which could pose a risk for false moves.
The “lack of volume” stems from the MFI formula we shared in the introduction at the start of this article where we show that the volume component of the formula is in the denominator therefore a rise in MFI, though a green histogram, may not have a proportionate increase in volume. Pairing it with Bollinger Bands can therefore go the extra mile in providing some insurance for the volume deficit breakouts that could lead to false signals.
Also, using Fractals or RSI can help validate that momentum aligns with the breakout or crossover.
Trend Continuation
Our pattern-6 serves as an extension of pattern-5 by requiring two consecutive green MFI bars, as opposed to just the one required above. This two-bar requirement encompasses both bullish and bearish setups. So I. addition to it, a bullish pattern is defined by close price crossing above the MA while a bearish pattern is marked by the close price heading in the opposite direction. We implement this in MQL5 as follows:
//+------------------------------------------------------------------+
//| Check for Pattern 6.                                             |
//+------------------------------------------------------------------+
bool CSignalMFI::IsPattern_6(ENUM_POSITION_TYPE T)
{  if(Color(X()+1) == clrGreen && Color(X()) == clrGreen)
   {  if(T == POSITION_TYPE_BUY && Close(X()+1) > MA(X()+1) && Close(X()) > MA(X()))
      {  return(true);
      }
      else if(T == POSITION_TYPE_SELL && Close(X()+1) < MA(X()+1) && Close(X()) < MA(X()))
      {  return(true);
      }
   }
   return(false);
}
An optimization run with similar settings as the patterns already covered above gives us the following report:
This being a simple extension of pattern-5 tends to include the already covered notes on interpretation, and pattern drawbacks.
Range Trading Setup
Our eighth and final pattern, pattern-7 seeks to capitalise on the brown MFI consolidation phase by pairing it with the RSI. What we are calling range trading is a way of preparing for volatility breakouts, as already argued above on pattern-3. The MQL5 implementation is as follows:
//+------------------------------------------------------------------+
//| Check for Pattern 7.                                             |
//+------------------------------------------------------------------+
bool CSignalMFI::IsPattern_7(ENUM_POSITION_TYPE T)
{  if(Color(X()) == clrBrown)
   {  if(T == POSITION_TYPE_BUY && RSI(X()+1) <= 30.0 && RSI(X()) >= 30.0)
      {  return(true);
      }
      else if(T == POSITION_TYPE_SELL && RSI(X()+1) >= 70.0 && RSI(X()) <= 70.0)
      {  return(true);
      }
   }
   return(false);
}
Basing on a brown MFI bar, we look for a bullish pattern if the RSI crosses from below 30 to close above it. Similarly, a bearish pattern would be interpreted if the RSI crosses from above the 70 level to close below it. Testing with just this pattern requires the input for bitmaps used to be 128 (2^7) and an optimization run for just this pattern gives us the following report:

I have argued that it is better for traders to test for one pattern at a time and then select just one (or a max of 2) for use in further testing or deployment. Trying to test for all patterns could produce results that are harder to walk forward because in the process a lot of the individual patterns keep cancelling each other out and so the true performance of each get's lost. Nonetheless, for information purposes only we try to optimize the thresholds for all patterns while simultaneously seeking a pattern's used Bitmap that would maximise our test target. We did this and the results from some of the best settings are given below:


Conclusion
We have examined another Bill Williams indicator, the Market Facilitation Index, on a pattern basis, as has been our practice in these articles. While not a very common indicator and also clearly the type that would need to be used by other indicators to generate signals, it could provide an edge for traders who are looking for something outside of the box, besides the very common indicators.
| FileName | Description |
|---|---|
| SignalWZ_53.mqh | Custom Signal Class File |
| wz_53.mq5 | Wizard assembled Expert advisor with Header showing used files |
Warning: All rights to these materials are reserved by MetaQuotes Ltd. Copying or reprinting of these materials in whole or in part is prohibited.
This article was written by a user of the site and reflects their personal views. MetaQuotes Ltd is not responsible for the accuracy of the information presented, nor for any consequences resulting from the use of the solutions, strategies or recommendations described.
- Free trading apps
- Over 8,000 signals for copying
- Economic news for exploring financial markets
You agree to website policy and terms of use
Thanks for the MFI insight. I will revisit and test again. What was the your Risk Reward ratio in testing this strategy?
.
Seems that the highlighted
MFI(X()+1) > MFI(X()is questionable (especailly compare to other Patterns' algorithm)!!
Could one of them be:
MFI(X()+1) < MFI(X()Regarding the following:
Seems that the highlighted
is questionable (especailly compare to other Patterns' algorithm)!!
Could one of them be:
MFI(X()+1) < MFI(X()The author wants to say for the condition to be valid, the previous MFI should be greater than the current MFI in both cases.
MFI(X()+1) > MFI(X()In such a case, he is measuring;
decreasing MFI strength but increasing lower low in bearish trend
decreasing MFI strength but increasing higher high in bullish trend .
Hope this helps.The author wants to say for the condition to be valid, the previous MFI should be greater than the current MFI in both cases.
In such a case, he is measuring;
decreasing MFI strength but increasing lower low in bearish trend
decreasing MFI strength but increasing higher high in bullish trend .
Hope this helps.Thank you for explaining.
Yes, it makes sense.