
Price Action Analysis Toolkit Development (Part 37): Sentiment Tilt Meter

Introduction
We are now in Part 37 of the Price Action Analysis Toolkit Development series. My overarching goal has always been to develop practical tools that assist traders in interpreting market behavior—and, where appropriate, automate aspects of that analysis. To date, we have introduced standalone MQL5 utilities, external integrations, and hybrid solutions. Today, we further expand the toolkit with another valuable and pragmatic addition.
Data visualizations often become cluttered due to overlapping labels, excessive indicators, and ad-hoc annotations, which obscure the underlying signal changes and rationale. This ambiguity hampers decision-making, undermines confidence in rule-based systems, and complicates the creation of reliable audit trails essential for disciplined automation.
The Sentiment Tilt Meter (STM) addresses this issue by aggregating candle-level directional metrics across configurable timeframes into a unified, smoothed scalar score ranging from -100 to +100. This score is displayed within a compact, collision-avoidant dashboard layout. Persistent annotations, such as arrows and text labels, are precisely anchored to bar close timestamps, ensuring that each alert can be independently verified by timestamp and price level.
STM provides explicit, parameterizable rules—such as flip thresholds, sign-flip magnitude and duration, momentum criteria, and per-timeframe weighting—allowing users to tune sensitivity, balancing the trade-off between noise suppression and responsiveness.
We’ll begin with a strategy overview, followed by the MQL5 implementation, presenting the testing & results, and conclude with a concise conclusion. See the following table of contents:
Strategy Overview
Markets are noisy, and noise is the single biggest enemy of consistent decision-making. Indicators pile up, labels overlap, and it quickly becomes impossible to tell what moved the price and why. The Sentiment Tilt Meter (STM) was built to cut through that fog: produce a single, verifiable read of short-term market tilt, show the evidence on the chart, and let you make disciplined decisions without guessing.
Sentiment here is the market’s short-term tilt — the net push toward buying or selling in recent candles. STM measures that tilt directly from price action by converting each closed candle into a small, interpretable score. The micro-features are:
- Candle Body Ratio (CBR)
![]()
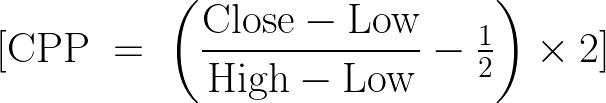
- Close Position Percent (CPP)
- Volatility-Adjusted Distance (VAD)
![]()
where ATR is the recent true range baseline and
Clamp ( x , a , b ) =max ( a , min ( b , x ) ) \operatorname{clamp}(x,a,b)=\max(a,\min(b,x)) clamp(x,a,b)=max(a,min(b,x)).
Each candle’s mini-score is a weighted sum (for example)
![]()
clamped to [ − 1 , + 1 ] [-1, +1] [−1,+1]and then multiplied by simple confidence and quiet-market factors. Per-timeframe scores are averaged across the sample, fused across timeframes using user weights,
![]()
and finally exponentially smoothed:
![]()
Below are the price and score diagrams:

The score diagram displays the smoothed sentiment value over time, marking each raw sign-cross with small × markers and highlighting accepted flip signals—after applying magnitude, persistence, and momentum filters—with larger dot markers. This visualization helps easily identify minor noisy fluctuations that could cause false signals, as well as the genuine flips permitted by the filters.
The price diagram shows the location of these accepted signals within the price series. Arrows and BUY or SELL labels are positioned precisely at the signal price, allowing immediate verification of whether a signal aligns with key price structures such as support and resistance levels, trend directions, or nearby swings.
For acceptance, the EA should produce signals that are immediately traceable (time and price), be robust across backtests and short forward tests, and reduce obvious false positives to a level you find tradeable. If those boxes are ticked, STM has done its job — it gives a clear, tunable, and verifiable read on short-term market tilt you can rely on as part of a disciplined process.
MQL5 Implementation
Before we begin coding, allocate two minutes to properly set up your environment—this will save significant time later. Ensure that MetaTrader 5 (MetaTrader 5) and MetaEditor are installed. MetaEditor can be launched as a standalone application or accessed via MetaTrader 5; both options are acceptable.
To prepare your Expert Advisor (EA):
- Open MetaEditor.
- Navigate to File → New → Expert Advisor (template).
- Paste your EA source code into the newly created file.
- Save the file with a descriptive, meaningful name.
- Compile the code by pressing F7.
Verify that the compilation completes without errors or warnings. If issues are reported, review and correct the code, then recompile until the compiler reports a clean build.
Back in MetaTrader 5:
- Load the EA into the Strategy Tester or attach it directly to a chart.
- Monitor the dashboard, logs, and signals.
- Check the Experts and Journal tabs for runtime messages and debugging information.
This setup ensures your environment is correctly configured for efficient development and testing. From this point, we'll proceed step by step to create the Sentiment Tilt Meter (STM) Expert Advisor, guiding you through each stage of the development process.
The header and metadata block sets the EA identity, copyright, link to the author profile and the compilation mode (#property strict). Those lines are purely declarative but important: they embed versioning and attribution inside the compiled program and enable stricter compile-time checks. Right after that the EA includes the standard trading helper Trade.mqh so the code has access to the CTrade class and other trading-related helpers; even though this particular file uses CTrade g_trade sparingly (or not at all in the shown code), including the library makes it ready to place orders later without a refactor.
//+------------------------------------------------------------------+
//|                                                            STM EA|
//|                                   Copyright 2025, MetaQuotes Ltd.|
//|                           https://www.mql5.com/en/users/lynnchris|
//+------------------------------------------------------------------+
#property copyright "Copyright 2025, MetaQuotes Ltd."
#property link      "https://www.mql5.com/en/users/lynnchris"
#property version   "1.0"
#property strict

#include <Trade\Trade.mqh>
The input block defines all user-configurable parameters. Inputs are grouped by purpose: timeframe selection, signal algorithm tuning, visual layout and panel style, sound/push alerts, and arrow/marker behavior. The primary TF and optional extra TFs let the EA fuse signals from multiple timeframes; weights (InpWeightPrimary, InpWeightExtra1, InpWeightExtra2) control the fusion ratio. Smoothing (InpSmoothAlpha) governs exponential smoothing of raw fused scores; threshold tuning variables (e.g. InpFlipThreshold, InpPositiveZone, InpNegativeZone) define when the EA considers a large flip or when it has entered a positive/negative zone.
Visual inputs control the on-chart dashboard: size, corner, fonts, colors, histogram bar count and panel padding. Arrow/marker inputs let you enable or tune signals placed on the chart, and several safety checks (minimum bars, sign-flip magnitude, momentum requirements) reduce noise and false flips. All inputs are explicitly typed so they appear in the EA dialog and can be adjusted without editing code.
// --- User inputs (layout / visuals tuned) ----------------------------
input ENUM_TIMEFRAMES InpTFPrimary = PERIOD_M5;
input bool InpUseMultiTF = true;
input ENUM_TIMEFRAMES InpExtraTF1 = PERIOD_M15;
input ENUM_TIMEFRAMES InpExtraTF2 = PERIOD_H1;
input int InpLookback = 20;
input int InpSSWindow = 5;
input int InpATRPeriod = 14;
input double InpATRMultiplier = 1.0;
input double InpVolQuietThreshold = 0.4;
input int InpHistogramMaxBars = 24;
input int InpPanelPadding = 10;
input int InpPanelCorner = CORNER_LEFT_UPPER;
input int InpPanelX = 5;
input int InpPanelY = 25;
input string InpFont = "Arial";
input int InpTitleFontSize = 12;
input int InpScoreFontSize = 18;
input int InpSmallFontSize = 9;
input color InpPanelColor = clrBlack;
input int InpPanelAlpha = 200;
input bool InpEnableSound = true;
input string InpSoundFile = "alert.wav";
input bool InpEnablePush = false;
input double InpWeightPrimary = 0.6;
input double InpWeightExtra1 = 0.2;
input double InpWeightExtra2 = 0.2;
input double InpSmoothAlpha = 0.28;
input double InpFlipThreshold = 60.0;
input double InpPositiveZone = 30.0;
input double InpNegativeZone = -30.0;
input int InpMinBarsForSignal = 3;

// arrows / marker options
input bool InpShowArrows = true;
input int  InpArrowFontSize = 16;
input int  InpArrowOffsetPoints = 8;
input int  InpMaxSignalsToKeep = 50;
input bool InpSignalOnSignFlip = true;
input double InpMinSignFlipAbs = 6.0;
input int    InpSignFlipHoldBars = 1;
input bool   InpRequireMomentum = true;
input double InpMinMomentum = 0.5;
//+------------------------------------------------------------------+
Constants and globals follow. The EA constructs a unique g_prefix per chart (symbol + chart id) to namespace on-chart objects and avoid collisions with other EAs or manual objects. There are handles for ATR indicators for each timeframe, buffers for the histogram (g_hist_buffer) and indices to manage circular storage. Globals also keep the smoothed value state (g_smoothed_score, g_prev_smoothed), the last alert score used to detect big flips, and the current g_zone_state (1, -1, or 0). CTradeg_trade is declared in case the EA is extended to place orders. Storing g_last_signal_text and g_last_signal_time lets the UI show the most recent action on the panel.
// globals
long g_chart_id = 0;
string g_prefix = "";
string ui_bg_name = "";
string ui_shadow_name = "";
string ui_title_name = "";
string ui_score_name = "";
string ui_zone_name = "";
string ui_hist_base = "";
string ui_recent_name = "";
string ui_advice_name = "";
string ui_signal_name = "";
int g_atr_handle_primary = INVALID_HANDLE;
int g_atr_handle_extra1 = INVALID_HANDLE;
int g_atr_handle_extra2 = INVALID_HANDLE;
double g_hist_buffer[];
int g_hist_idx = 0;
int g_hist_count = 0;
double g_smoothed_score = 0.0;
double g_prev_smoothed = 0.0;
double g_last_alert_score = 0.0;
int g_zone_state = 0;
CTrade g_trade;
string g_last_signal_text = "None";
datetime g_last_signal_time = 0;
const string BASE_HIST = "STM_HBAR_";
//+------------------------------------------------------------------+
There are a few small utility routines that make the UI and display code more robust. ARGB_uint composes an ARGB unsigned integer from an alpha value and an MQL color so semi-transparent rectangle backgrounds can be specified cleanly. EstimateTextWidth is a cheap pixel-width estimator for strings based on font size and a tuned character-width factor; this is used to avoid label overlap when placing the zone badge and the recent-text string. Those approximations are sensible for an on-chart panel where exact layout is not critical but collisions are unpleasant.
// ARGB helper - returns a color as unsigned int
uint ARGB_uint(int a, color c)
  {
   uint u = ((uint)c) & 0x00FFFFFF;
   return ((((uint)a) & 0xFF) << 24) | u;
  }

// approximate text width estimator (pixels)
int EstimateTextWidth(string txt,int fontSize)
  {
   if(StringLen(txt) <= 0)
      return 6;
   double factor = 0.58;
   int w = (int)MathRound(StringLen(txt) * fontSize * factor);
   return MathMax(8, w);
  }
//+------------------------------------------------------------------+
DrawText and DrawCell are safe wrappers for creating and configuring on-chart labels and rectangle labels. They centralize the object creation + property setting pattern (corner, x/y distance, font, selectable flag, z-order) so every UI label follows the same conventions. Using these helpers avoids duplicated boilerplate and ensures consistent behavior when the panel is rebuilt or updated.
// safe DrawText - sets font explicitly and uses exact x/y
void DrawText(string id,string txt,int x,int y,color clr,int sz)
  {
   if(ObjectFind(g_chart_id,id) < 0)
      ObjectCreate(g_chart_id,id,OBJ_LABEL,0,0,0);
   ObjectSetInteger(g_chart_id,id,OBJPROP_CORNER,InpPanelCorner);
   ObjectSetInteger(g_chart_id,id,OBJPROP_XDISTANCE,x);
   ObjectSetInteger(g_chart_id,id,OBJPROP_YDISTANCE,y);
   ObjectSetInteger(g_chart_id,id,OBJPROP_COLOR,(int)clr);
   ObjectSetInteger(g_chart_id,id,OBJPROP_FONTSIZE,sz);
   ObjectSetString(g_chart_id,id,OBJPROP_FONT,InpFont);
   ObjectSetString(g_chart_id,id,OBJPROP_TEXT,txt);
   ObjectSetInteger(g_chart_id,id,OBJPROP_SELECTABLE,false);
   ObjectSetInteger(g_chart_id,id,OBJPROP_ZORDER,0);
  }

// small helper to draw rectangle label cell
void DrawCell(string id,int x,int y,int w,int h,color bg,color br)
  {
   if(ObjectFind(g_chart_id,id) < 0)
      ObjectCreate(g_chart_id,id,OBJ_RECTANGLE_LABEL,0,0,0);
   ObjectSetInteger(g_chart_id,id,OBJPROP_CORNER,InpPanelCorner);
   ObjectSetInteger(g_chart_id,id,OBJPROP_XDISTANCE,x);
   ObjectSetInteger(g_chart_id,id,OBJPROP_YDISTANCE,y);
   ObjectSetInteger(g_chart_id,id,OBJPROP_XSIZE,w);
   ObjectSetInteger(g_chart_id,id,OBJPROP_YSIZE,h);
   ObjectSetInteger(g_chart_id,id,OBJPROP_BGCOLOR,(int)bg);
   ObjectSetInteger(g_chart_id,id,OBJPROP_BORDER_COLOR,(int)br);
   ObjectSetInteger(g_chart_id,id,OBJPROP_SELECTABLE,false);
   ObjectSetInteger(g_chart_id,id,OBJPROP_ZORDER,1);
  }
CreateUIObjects and DeleteUIObjects manage lifecycle for all the UI elements. CreateUIObjectsprecreates the background, shadow, title, score, zone, recent and histogram label slots, and sets default fonts and z-order. DeleteUIObjects cleans them up on deinit — a useful practice that leaves the chart tidy when the EA is removed. Precreating a fixed number of histogram label objects (based on InpHistogramMaxBars) avoids frequent object creation at runtime, which improves performance and stability.
void CreateUIObjects()
  {
   int default_w = 200;
   int default_h = 80;
   int scol = (int)ARGB_uint(InpShadowAlpha, InpShadowColor);
   DrawCell(ui_shadow_name, InpPanelX + 3, InpPanelY + 3, default_w, default_h, (color)scol, InpGridClr);
   DrawCell(ui_bg_name, InpPanelX, InpPanelY, default_w, default_h, InpPanelBG, InpGridClr);

   DrawText(ui_title_name, "", InpPanelX + InpPanelPadding, InpPanelY + InpPanelPadding, InpTxtClr, InpTitleFontSize);
   DrawText(ui_score_name, "", InpPanelX + InpPanelPadding, InpPanelY + InpPanelPadding + InpTitleFontSize + 4, InpTxtClr, InpScoreFontSize);
   DrawText(ui_zone_name, "", InpPanelX + default_w - InpPanelPadding - 80, InpPanelY + InpPanelPadding + 4, InpTxtClr, InpSmallFontSize);
   DrawText(ui_advice_name, "", InpPanelX + InpPanelPadding, InpPanelY + InpPanelPadding + InpTitleFontSize + InpScoreFontSize + 8, InpTxtClr, InpSmallFontSize);
   DrawText(ui_recent_name, "", InpPanelX + InpPanelPadding, InpPanelY + default_h - InpPanelPadding - 18, InpTxtClr, InpSmallFontSize);
   DrawText(ui_signal_name, "", InpPanelX + InpPanelPadding + 120, InpPanelY + InpPanelPadding + InpTitleFontSize + InpScoreFontSize + 8, InpTxtClr, InpSmallFontSize);

   for(int i = 0; i < InpHistogramMaxBars; i++)
     {
      string name = ui_hist_base + IntegerToString(i);
      if(ObjectFind(g_chart_id, name) < 0)
        {
         ObjectCreate(g_chart_id, name, OBJ_LABEL, 0, 0, 0);
         ObjectSetInteger(g_chart_id, name, OBJPROP_CORNER, InpPanelCorner);
         ObjectSetString(g_chart_id, name, OBJPROP_FONT, InpFont);
         ObjectSetInteger(g_chart_id, name, OBJPROP_FONTSIZE, InpSmallFontSize);
         ObjectSetInteger(g_chart_id, name, OBJPROP_SELECTABLE, false);
         ObjectSetInteger(g_chart_id, name, OBJPROP_ZORDER,0);
        }
     }
  }

void DeleteUIObjects()
  {
   if(g_chart_id == 0) return;
   if(ObjectFind(g_chart_id, ui_shadow_name) >= 0) ObjectDelete(g_chart_id, ui_shadow_name);
   if(ObjectFind(g_chart_id, ui_bg_name) >= 0) ObjectDelete(g_chart_id, ui_bg_name);
   if(ObjectFind(g_chart_id, ui_title_name) >= 0) ObjectDelete(g_chart_id, ui_title_name);
   if(ObjectFind(g_chart_id, ui_score_name) >= 0) ObjectDelete(g_chart_id, ui_score_name);
   if(ObjectFind(g_chart_id, ui_zone_name) >= 0) ObjectDelete(g_chart_id, ui_zone_name);
   if(ObjectFind(g_chart_id, ui_recent_name) >= 0) ObjectDelete(g_chart_id, ui_recent_name);
   if(ObjectFind(g_chart_id, ui_advice_name) >= 0) ObjectDelete(g_chart_id, ui_advice_name);
   if(ObjectFind(g_chart_id, ui_signal_name) >= 0) ObjectDelete(g_chart_id, ui_signal_name);

   for(int i = 0; i < InpHistogramMaxBars; i++)
     {
      string name = ui_hist_base + IntegerToString(i);
      if(ObjectFind(g_chart_id, name) >= 0) ObjectDelete(g_chart_id, name);
     }
  }
RefreshUI is where the panel layout and the histogram are actually computed and painted. It measures font heights and reserves space for title, score, small text and a histogram row; it computes the panel width dynamically so the histogram fits but enforces a sensible minimum width. It draws the shadow and background rectangles, computes the zone badge placement while avoiding title overlap (using EstimateTextWidth), and chooses colors for the smoothed score (scoreCol) based on thresholds. The "Recent:" line is generated from the most recent primary-timeframe bars (close vs open and their point ranges), truncated with ellipsis if it would overflow.
For the histogram it computes the number of text block glyphs to represent magnitude visually, binds each glyph to a precreated label object, and chooses colors depending on sign. This routine is defensive (it checks available space and reduces spacing when necessary) and is designed to avoid label collisions while keeping the panel compact and readable.
void RefreshUI(double rawScore, double smoothScore)
  {
   int title_h = InpTitleFontSize + 6;
   int score_h = InpScoreFontSize + 8;
   int small_h = InpSmallFontSize + 4;
   int hist_area_h = 22;
   int gap_between_sections = 6;

   int hist_px_step = 7;
   int hist_px_width = InpHistogramMaxBars * hist_px_step;
   int panel_width = MathMax(340, hist_px_width + InpPanelPadding*2 + 30);
   int extra_recent_space = small_h + 12;
   int panel_height = InpPanelPadding*2 + title_h + score_h + small_h + hist_area_h + (gap_between_sections * 4) + extra_recent_space;

   int scol = (int)ARGB_uint(InpShadowAlpha, InpShadowColor);
   DrawCell(ui_shadow_name, InpPanelX + 3, InpPanelY + 3, panel_width, panel_height, (color)scol, InpGridClr);
   DrawCell(ui_bg_name, InpPanelX, InpPanelY, panel_width, panel_height, InpPanelBG, InpGridClr);

   int x_start = InpPanelX + InpPanelPadding;
   int y_title = InpPanelY + InpPanelPadding;
   string titleText = StringFormat("Sentiment Tilt Meter — %s  [%s]", Symbol(), TFToText(InpTFPrimary));
   DrawText(ui_title_name, titleText, x_start, y_title, InpTxtClr, InpTitleFontSize);

   // ... zone, score, advice, recent and histogram painting (omitted here for brevity)
   // The full EA code contains the rest and iterates label objects to draw histogram blocks.
  }
TFToText is a straightforward helper that maps the ENUM_TIMEFRAMES to short human text labels (M1, M5, M15, H1, etc.). It’s used in the title so the user always knows which primary timeframe the EA is referencing.
string TFToText(ENUM_TIMEFRAMES tf)
  {
   switch(tf)
     {
      case PERIOD_M1:  return "M1";
      case PERIOD_M5:  return "M5";
      case PERIOD_M15: return "M15";
      case PERIOD_M30: return "M30";
      case PERIOD_H1:  return "H1";
      case PERIOD_H4:  return "H4";
      case PERIOD_D1:  return "D1";
      case PERIOD_W1:  return "W1";
      case PERIOD_MN1: return "MN";
      default:         return IntegerToString((int)tf);
     }
  }
OnInit performs initialization: it captures the chart id and builds the object prefix, resizes and initializes the histogram buffer, creates ATR indicator handles (iATR) for requested timeframes (only if multi-TF mode is enabled), computes an initial raw fused sentiment (ComputeFusedSentiment), sets the smoothed value and zone state, creates UI objects and draws the initial panel with RefreshUI, and installs a 1-second timer (EventSetTimer(1)) so OnTimer can notice new primary bars. The design initializes smoothing with the first raw value so the first displayed smoothed value is stable. Note the code calls UpdateZoneState early so the initial zone is correct.
OnDeinit cleans up when the EA is removed: it kills the timer, deletes UI objects, and removes any signal markers created by this EA (using the g_prefix + "SIG_" naming convention). It also releases the ATR indicator handles with IndicatorRelease. This keeps resources clean and avoids leaving stray labels on the chart or leaking indicator handles.
int OnInit()
  {
   g_chart_id = ChartID();
   g_prefix = Symbol() + "_" + IntegerToString((int)g_chart_id) + "_";
   ui_bg_name = g_prefix + "BG";
   ui_shadow_name = g_prefix + "SHDW";
   ui_title_name = g_prefix + "TITLE";
   ui_score_name = g_prefix + "SCORE";
   ui_zone_name = g_prefix + "ZONE";
   ui_hist_base = g_prefix + BASE_HIST;
   ui_recent_name = g_prefix + "RECENT";
   ui_advice_name = g_prefix + "ADVICE";
   ui_signal_name = g_prefix + "LASTSIG";

   ArrayResize(g_hist_buffer, InpHistogramMaxBars);
   ArrayInitialize(g_hist_buffer, 0.0);
   g_hist_idx = 0;
   g_hist_count = 0;

   g_atr_handle_primary = iATR(Symbol(), InpTFPrimary, InpATRPeriod);
   if(InpUseMultiTF)
     {
      g_atr_handle_extra1 = iATR(Symbol(), InpExtraTF1, InpATRPeriod);
      g_atr_handle_extra2 = iATR(Symbol(), InpExtraTF2, InpATRPeriod);
     }

   double raw_init = ComputeFusedSentiment();
   g_smoothed_score = raw_init;
   g_prev_smoothed = g_smoothed_score;
   g_last_alert_score = raw_init;
   UpdateZoneState(raw_init);

   CreateUIObjects();
   RefreshUI(raw_init, g_smoothed_score);

   EventSetTimer(1);
   return(INIT_SUCCEEDED);
  }

void OnDeinit(const int reason)
  {
   EventKillTimer();
   DeleteUIObjects();

   // delete signal markers created by this EA (prefix-based)
   string name;
   int total = ObjectsTotal(g_chart_id);
   for(int i = total - 1; i >= 0; --i)
     {
      name = ObjectName(g_chart_id, i);
      if(StringFind(name, g_prefix + "SIG_") == 0)
         ObjectDelete(g_chart_id, name);
     }

   if(g_atr_handle_primary != INVALID_HANDLE)
      IndicatorRelease(g_atr_handle_primary);
   if(g_atr_handle_extra1 != INVALID_HANDLE)
      IndicatorRelease(g_atr_handle_extra1);
   if(g_atr_handle_extra2 != INVALID_HANDLE)
      IndicatorRelease(g_atr_handle_extra2);
  }
The EA uses OnTimer as its main polling mechanism. It checks the timestamp of the current primary-TF bar (iTime(Symbol(), InpTFPrimary, 0)) and if that timestamp differs from the last processed value, it calls HandleNewPrimaryBar. This approach avoids processing on every timer tick and only acts once per new completed bar: a good pattern when you want bar-based signals while using a timer rather than OnTick.
datetime g_last_primary_time = 0;
void OnTimer()
  {
   datetime t = iTime(Symbol(), InpTFPrimary, 0);
   if(t == g_last_primary_time) return;
   g_last_primary_time = t;
   HandleNewPrimaryBar();
  }

void HandleNewPrimaryBar()
  {
   double raw = ComputeFusedSentiment();
   double alpha = MathMax(0.0, MathMin(1.0, InpSmoothAlpha));
   g_prev_smoothed = g_smoothed_score;
   g_smoothed_score = alpha * raw + (1.0 - alpha) * g_smoothed_score;
   g_hist_buffer[g_hist_idx] = g_smoothed_score;
   g_hist_idx = (g_hist_idx + 1) % InpHistogramMaxBars;
   if(g_hist_count < InpHistogramMaxBars) g_hist_count++;
   RefreshUI(raw, g_smoothed_score);
   ProcessAlerts(raw, g_smoothed_score);
  }
HandleNewPrimaryBar computes a fresh raw fused sentiment via ComputeFusedSentiment, applies exponential smoothing with the configured alpha (g_smoothed_score = alpha * raw + (1-alpha) * prev), stores the smoothed value into the circular histogram buffer, updates indices and count, refreshes the UI, and calls ProcessAlerts to check if this new smoothed value should trigger messages or signals. The circular buffer is implemented with g_hist_idx modulo InpHistogramMaxBars, and g_hist_count tracks how many entries are valid. This preserves a rolling history for the visual histogram and for sign-hold checks.
ComputeFusedSentiment is the top-level scoring aggregator. It normalizes the absolute values of the three weight inputs so they sum to 1 (with a safe fallback to primary only if the sum is zero). Then it calls ComputeTFScore for the primary and, if enabled, for the two extra timeframes. Finally it computes a weighted average and clamps the fused output to the range [-100, 100]. This keeps the downstream UI and threshold logic consistent regardless of the raw per-TF scale.
double ComputeFusedSentiment()
  {
   double w1 = MathAbs(InpWeightPrimary);
   double w2 = MathAbs(InpWeightExtra1);
   double w3 = MathAbs(InpWeightExtra2);
   double sum = w1 + w2 + w3;
   if(sum <= 0.0) { w1 = 1.0; w2 = 0.0; w3 = 0.0; sum = 1.0; }
   w1 /= sum; w2 /= sum; w3 /= sum;

   double s1 = ComputeTFScore(Symbol(), InpTFPrimary, InpLookback, InpSSWindow, g_atr_handle_primary);
   if(!InpUseMultiTF) return s1;
   double s2 = ComputeTFScore(Symbol(), InpExtraTF1, InpLookback, InpSSWindow, g_atr_handle_extra1);
   double s3 = ComputeTFScore(Symbol(), InpExtraTF2, InpLookback, InpSSWindow, g_atr_handle_extra2);
   double fused = s1 * w1 + s2 * w2 + s3 * w3;
   return MathMax(-100.0, MathMin(100.0, fused));
  }

double ComputeTFScore(string sym, ENUM_TIMEFRAMES tf, int lookback, int ssWindow, int atrHandle)
  {
   MqlRates rates[];
   int needed = MathMax(lookback, ssWindow) + 6;
   int copied = CopyRates(sym, tf, 0, needed, rates);
   if(copied <= 0) return 0.0;

   double atr = 0.0001;
   if(atrHandle != INVALID_HANDLE)
     {
      double abuf[];
      if(CopyBuffer(atrHandle, 0, 1, 1, abuf) > 0)
         atr = abuf[0] * InpATRMultiplier;
     }
   else
     {
      int rc = MathMin(10, copied - 1);
      double ar = 0.0;
      for(int i = 1; i <= rc; i++) ar += (rates[i].high - rates[i].low);
      if(rc > 0) ar /= rc;
      if(ar > 0) atr = ar * 0.6;
     }

   int limit = MathMin(ssWindow, copied - 1);
   double avgRange = 0.0;
   int vr = MathMin(10, copied - 1);
   for(int k = 1; k <= vr; k++) avgRange += (rates[k].high - rates[k].low);
   if(vr > 0) avgRange /= vr;

   double sumSS = 0.0;
   int count = 0;
   for(int i = 1; i <= limit; i++)
     {
      double open = rates[i].open;
      double close = rates[i].close;
      double high = rates[i].high;
      double low = rates[i].low;
      double range = high - low;
      if(range <= 0.0) continue;
      double dir = (close > open) ? 1.0 : -1.0;
      double cbr = (MathAbs(close - open) / range) * dir;
      double cpp = (((close - low) / range) - 0.5) * 2.0 * dir;
      double vad = 0.0;
      if(atr > 0.0) vad = (range / atr) - 1.0;
      vad = MathMax(-1.0, MathMin(3.0, vad));
      double ss = cbr * 0.4 + cpp * 0.3 + vad * 0.3;
      ss = MathMax(-1.0, MathMin(1.0, ss));

      bool conf = false;
      if((i - 1) >= 0 && (i - 1) <= copied - 1)
        {
         double nOpen = rates[i - 1].open;
         double nClose = rates[i - 1].close;
         if(dir > 0.0 && nClose > nOpen) conf = true;
         if(dir < 0.0 && nClose < nOpen) conf = true;
        }

      double confFactor = conf ? 1.0 : 0.6;
      double volFactor = 1.0;
      if(atr > 0.0 && avgRange / atr < InpVolQuietThreshold) volFactor = 0.6;
      double finalSS = ss * confFactor * volFactor;
      sumSS += finalSS;
      count++;
     }
   if(count == 0) return 0.0;
   double avgSS = sumSS / count;
   return avgSS * 100.0;
  }
ComputeTFScore is where the core per-timeframe signal features are computed. It copies a block of recent MqlRates bars from the requested timeframe and computes an ATR proxy: if an ATR handle exists it copies the indicator buffer; otherwise it builds a simple average true range fallback. The code computes an avgRange and then iterates over up to ssWindow past bars to derive three normalized features per bar: cbr (close vs open relative to range, capturing direction and strength), cpp (close position within the bar normalized and biased by direction), and vad (volume/volatility adjusted distance: range relative to ATR minus one). Each feature is weighted (0.4, 0.3, 0.3 respectively), clamped to [-1,1], and then multiplied by two confidence factors: confFactor which checks if the prior bar confirmed direction, and volFactor which reduces the contribution if the market is unusually quiet relative to ATR.
The final per-bar sentiment sample finalSS is accumulated and averaged across the window and then scaled by 100 for a convenient percentage-like range. In short: the routine encodes directional bias, intra-bar closeness, relative range magnitude, and simple cross-bar confirmation into a single per-TF score.
RecentSmoothedSignHold is a helper used by the sign-flip logic to require that the most recent bars smoothed values all share the new sign. It looks backwards through the circular g_hist_buffer and returns false if any of the required recent smoothed values fails the sign test. This prevents flicker from a single spurious bar flipping a signal.
ProcessAlerts is the decision engine for messaging and chart signals. It first checks for enough history (InpMinBarsForSignal) and then checks for a large abrupt flip (absolute difference from g_last_alert_score exceeding InpFlipThreshold), in which case it sends an alert, updates zone state, and optionally draws a BUY/SELL text marker. If not a big flip, it computes the new zone from InpPositiveZone/InpNegativeZone. If InpSignalOnSignFlip is enabled, it also checks for sign flips (positive→negative or negative→positive) and applies three acceptance tests: minimum absolute magnitude of the new smoothed value (InpMinSignFlipAbs), recent sign hold (InpSignFlipHoldBars), and optional momentum (InpRequireMomentum + InpMinMomentum). Only when all tests pass will it accept the sign flip as a true signal, draw the chart marker, update g_last_alert_score, and set g_zone_state.
If the zone changes normally (entering positive or negative zones) the code similarly sends alerts, records the last signal and time, and draws a marker. The result is a layered, conservative signaling strategy that prefers clearer structural changes over choppy noise.
bool RecentSmoothedSignHold(int bars, int desiredSign)
  {
   if(bars <= 1) return true;
   if(g_hist_count < bars) return false;
   int max = InpHistogramMaxBars;
   int idx = (g_hist_idx - 1 + max) % max;
   for(int i = 0; i < bars; i++)
     {
      double v = g_hist_buffer[(idx - i + max) % max];
      if(desiredSign == 1 && v <= 0.0) return false;
      if(desiredSign == -1 && v >= 0.0) return false;
     }
   return true;
  }

void ProcessAlerts(double rawScore, double smoothScore)
  {
   if(g_hist_count < InpMinBarsForSignal)
     {
      PrintFormat("%s: waiting hist_count=%d (need %d)", __FUNCTION__, g_hist_count, InpMinBarsForSignal);
      return;
     }

   // large flip detection
   if(MathAbs(smoothScore - g_last_alert_score) >= InpFlipThreshold)
     {
      string m = StringFormat("STM Flip: %.1f -> %.1f on %s", g_last_alert_score, smoothScore, Symbol());
      SendAlert(m);
      g_last_alert_score = smoothScore;
      UpdateZoneState(smoothScore);

      int newZoneFlip = 0;
      if(smoothScore >= InpPositiveZone) newZoneFlip = 1;
      else if(smoothScore <= InpNegativeZone) newZoneFlip = -1;
      if(newZoneFlip != 0)
        {
         g_last_signal_text = (newZoneFlip == 1) ? "BUY" : "SELL";
         g_last_signal_time = TimeCurrent();
         DrawSignalOnChart(newZoneFlip, smoothScore);
         PruneOldSignals(InpMaxSignalsToKeep);
        }
      RefreshUI(rawScore, g_smoothed_score);
      return;
     }

  }
UpdateZoneState is a trivial function that sets g_zone_state to 1, -1 or 0 given a smoothed score and the configured positive/negative zone thresholds. SendAlert centralizes alert delivery: play a sound if enabled, send a push notification if enabled, call Alert() (local terminal dialog) and Print() for the log. Centralizing alerts makes future expansion (e.g., email or webhooks) easier.
void UpdateZoneState(double smoothScore)
  {
   if(smoothScore >= InpPositiveZone) g_zone_state = 1;
   else if(smoothScore <= InpNegativeZone) g_zone_state = -1;
   else g_zone_state = 0;
  }

void SendAlert(string msg)
  {
   if(InpEnableSound) PlaySound(InpSoundFile);
   if(InpEnablePush) SendNotification(msg);
   Alert(msg);
   Print(__FILE__, ": ", msg);
  }
DrawSignalOnChart takes care of placing the BUY/SELL text and arrow glyph exactly at the last closed primary bar (index 1). It derives a unique object name using the timestamp and g_hist_idx so multiple signals are distinct, computes a small price offset to place the textual label above/below the arrow while leaving the arrow exactly at the price, and creates two chart text objects: one for the text label and one for the arrow glyph. The EA supports a simple arrow glyph selection and sets fonts, colors, z-order and non-selectability so these annotations don’t interfere with the trader’s manual chart work. After creating a signal it calls PruneOldSignals to ensure the chart doesn’t get littered with too many markers.
PruneOldSignals is pragmatic housekeeping: it enumerates all chart objects, selects those starting with the EA’s prefix + SIG_, extracts the timestamp encoded in the object name, sorts by timestamp (implemented by repeatedly removing the minimum) and deletes the oldest until only keep remain. This guarantees that only the most recent InpMaxSignalsToKeep markers remain, prevents chart clutter and keeps object enumeration inexpensive for reasonable keep values.
void DrawSignalOnChart(int zone, double score)
  {
   datetime tm = iTime(Symbol(), InpTFPrimary, 1);
   double price = iClose(Symbol(), InpTFPrimary, 1);
   if(tm == 0 || price == 0.0) return;

   double point = SymbolInfoDouble(Symbol(), SYMBOL_POINT);
   double textOffsetPts = MathMax(1, InpArrowOffsetPoints);
   double textOffset = point * textOffsetPts * 1.5;

   string name = g_prefix + "SIG_" + IntegerToString((int)tm) + "_" + IntegerToString(g_hist_idx);
   string arrName = g_prefix + "SIG_ARR_" + IntegerToString((int)tm) + "_" + IntegerToString(g_hist_idx);

   if(ObjectFind(g_chart_id, name) >= 0) ObjectDelete(g_chart_id, name);
   if(ObjectFind(g_chart_id, arrName) >= 0) ObjectDelete(g_chart_id, arrName);

   double text_price = (zone == 1) ? price + textOffset : price - textOffset;
   if(ObjectCreate(g_chart_id, name, OBJ_TEXT, 0, tm, text_price))
     {
      string txt = (zone == 1) ? "BUY" : ((zone == -1) ? "SELL" : "NEUTRAL");
      color col = (zone == 1) ? clrLime : ((zone == -1) ? clrRed : clrSilver);
      ObjectSetString(g_chart_id, name, OBJPROP_TEXT, txt);
      ObjectSetInteger(g_chart_id, name, OBJPROP_COLOR, (int)col);
      ObjectSetInteger(g_chart_id, name, OBJPROP_FONTSIZE, 12);
      ObjectSetString(g_chart_id, name, OBJPROP_FONT, InpFont);
      ObjectSetInteger(g_chart_id, name, OBJPROP_SELECTABLE, false);
      ObjectSetInteger(g_chart_id, name, OBJPROP_ZORDER, 2);
     }

   if(InpShowArrows)
     {
      string arrowTxt = (zone == 1) ? "▲" : ((zone == -1) ? "v" : "■");
      if(ObjectCreate(g_chart_id, arrName, OBJ_TEXT, 0, tm, price))
        {
         color acol = (zone == 1) ? clrLime : ((zone == -1) ? clrRed : clrSilver);
         ObjectSetString(g_chart_id, arrName, OBJPROP_TEXT, arrowTxt);
         ObjectSetInteger(g_chart_id, arrName, OBJPROP_COLOR, (int)acol);
         ObjectSetInteger(g_chart_id, arrName, OBJPROP_FONTSIZE, InpArrowFontSize);
         ObjectSetString(g_chart_id, arrName, OBJPROP_FONT, InpFont);
         ObjectSetInteger(g_chart_id, arrName, OBJPROP_SELECTABLE, false);
         ObjectSetInteger(g_chart_id, arrName, OBJPROP_ZORDER, 3);
        }
     }

   PruneOldSignals(InpMaxSignalsToKeep);
  }

void PruneOldSignals(int keep)
  {
   if(keep <= 0) return;
   int total = ObjectsTotal(g_chart_id);
   string names[];
   int times[];
   int n = 0;
   string sigPrefix = g_prefix + "SIG_";
   for(int i = 0; i < total; i++)
     {
      string nm = ObjectName(g_chart_id, i);
      if(StringFind(nm, sigPrefix) == 0)
        {
         string rest = StringSubstr(nm, StringLen(sigPrefix));
         int pos = StringFind(rest, "_");
         if(pos > 0)
           {
            string tsStr = StringSubstr(rest, 0, pos);
            int ts = (int)StringToInteger(tsStr);
            ArrayResize(names, n+1);
            ArrayResize(times, n+1);
            names[n] = nm;
            times[n] = ts;
            n++;
           }
        }
     }
   if(n <= keep) return;

   while(n > keep)
     {
      int minIdx = 0;
      for(int j = 1; j < n; j++) if(times[j] < times[minIdx]) minIdx = j;
      ObjectDelete(g_chart_id, names[minIdx]);
      for(int k = minIdx; k < n-1; k++)
        {
         names[k] = names[k+1];
         times[k] = times[k+1];
        }
      ArrayResize(names, n-1);
      ArrayResize(times, n-1);
      n--;
     }
  }
Finally, the EA contains multiple defensive and UX-oriented design choices: unique prefixing of object names to avoid collisions, fallback ATR calculation if indicator handles fail, clamping of fused scores to a fixed range, smoothing with a configurable alpha to reduce noise, and layered signal acceptance (flip threshold, sign-flip magnitude/hold/momentum, zone entry). The UI code includes collision avoidance when placing the zone badge and recent text, and the histogram uses text blocks rather than graphics so it’s lightweight and compatible with earlier MetaTrader 5 builds.
Testing and Outcomes
In this section, we will examine the tested outcomes of our EA, covering both backtesting results and live performance metrics.
Below is a GIF of the backtest on Crash 300 Index. The dashboard panel is a compact, audit-friendly summary of STM’s state: the top line names the tool, the instrument (Crash 300 Index) and the active timeframe (M5). Beneath that, a large, color-coded numeric sentiment score shows the smoothed market tilt on a −100…+100 scale, while a short bias label (e.g., BULL, BEAR, NEUTRAL) gives an immediate qualitative read. Directly under the score the panel reports the last signal (for example, “Bias: Long BUY @ 16:30”), so you can verify direction and exact bar timestamp. A horizontal strength bar visualizes magnitude, and a compact “Recent” row lists the latest candle metrics to put the score in context. All elements are anchored to closed bars, so every alert and label is traceable to a precise time and price.

During live testing on the Crash 1000 Index the EA issued a BUY signal that, when verified against the closed-bar timestamp, proved correct after a short holding period. The dashboard showed a clear positive tilt and the BUY marker was anchored to the exact bar close and price, so the move and its timing are fully auditable on the chart. This outcome illustrates the STM’s ability to detect durable short-term bullish bias—smoothing and momentum checks filtered noise and helped avoid an early whipsaw—while still leaving trade management (position size, stops, profit targets) to the trader.

- Live testing on Crash 300 Index

Conclusion
The Sentiment Tilt Meter (STM) did exactly what it was built to do: point out short-term bias clearly and reliably during the Crash 300 and Crash 1000 runs. Signals are easy to verify — every arrow and label is tied to a closed bar and a price — so you can check what happened and when without guessing. The smoothing and momentum checks kept the meter from ping-ponging on tiny moves, and the per-TF weighting lets you favor the horizons that matter to your style.
This tool is a signal generator and a recorder, not a full trading system. It will tell you when the market is tilted, but it won’t size positions, set stops, or manage exits for you. Results will vary by instrument and session; Crash indices behaved well in these tests, but forex, stocks or futures may need different tuning.
Use STM as a filter or a confirmation layer. Log signals to CSV, run multi-symbol backtests and a short forward-test, and only then consider automating entries. When you do trade from its signals, wrap them in a simple risk plan — fixed R, clear stop rules, and a higher-TF check — so one noisy session can’t undo a month of edge.
In short: STM gives a clean, auditable read on short-term market tilt. It speeds decision making and preserves discipline. Layer it with risk controls and verification steps before you trade real money.
Warning: All rights to these materials are reserved by MetaQuotes Ltd. Copying or reprinting of these materials in whole or in part is prohibited.
This article was written by a user of the site and reflects their personal views. MetaQuotes Ltd is not responsible for the accuracy of the information presented, nor for any consequences resulting from the use of the solutions, strategies or recommendations described.


- Free trading apps
- Over 8,000 signals for copying
- Economic news for exploring financial markets
You agree to website policy and terms of use