
MQL5 Wizard Techniques you should know (Part 63): Using Patterns of DeMarker and Envelope Channels
Introduction
For this article, we are pairing a momentum oscillator with a support/resistance channel. This may seem like an odd pairing, considering that most indicator pairings typically involve a trend following indicator, however this route could be explored because: of a need to avoid lags from trend identification; or a focus on mean reversion plays; or a need for a simpler trade system; or the need to adapt to choppy or range-bound markets; or the need to exploit momentum divergences, etc.
We therefore pair the DeMarker a momentum oscillator with the Envelope Channel a support/resistance tool. In doing so, we are going to look, as always, at the top 10 patterns from pairing these two while testing with the GBP USD pair. We are testing for the year 2023 on the 4-hour time frame and are performing forward walks or the year 2024.

DeMarker Extremes with Price at Envelope
Our first pattern, Pattern-0, gives us a Buy Signal when Price falls below the lower envelope but recovers back inside, when the DeMarker level is below 0.3. This is also referred to as a Bullish Fake out.
It helps in spotting false breakdowns below support, which often serves as a signal that sellers are exhausted. A DeMarker below 0.3 tends to show that conditions are oversold, which in turn raises the potential for a reversal. A quick recovery inside the band is therefore taken as a rejection of the lower band.
Price briefly touching the lower band of the Envelope Channels suggests a breakdown, however reversals to within the channel mark a ‘fake out’. A low DeMarker reading also confirms momentum is oversold, and these two increase the likelihood of a bounce. This sort of setup is used in targeting mean-reverting markets where price respects envelope boundaries.
When making bullish entries on a live setup, it may be a good idea to confirm the recovery with a strong bullish candle, where the candle closes inside the envelope. The use of a stop loss below the lower envelope can also help protect against genuine breakdowns. It is a setup suitable for range-bound markets, on smaller time frames and not strongly trending markets. We implement both signal, bullish and bearish patterns as follows in MQL5:
//| Check for Pattern 0.                                             |
//+------------------------------------------------------------------+
bool CSignalDEM_ENV::IsPattern_0(ENUM_POSITION_TYPE T)
{  if(Close(X()) > ENV_LW(X()) && Close(X() + 1) <= ENV_LW(X() + 1) && Close(X() + 2) >= ENV_LW(X() + 2))
   {  if(T == POSITION_TYPE_BUY && DEM(X()) <= 0.3)
      {  return(true);
      }
   }
   else if(Close(X()) < ENV_UP(X()) && Close(X() + 1) >=  ENV_UP(X() + 1) && Close(X() + 2) <= ENV_UP(X() + 2))
   {  if(T == POSITION_TYPE_SELL && DEM(X()) >= 0.7)
      {  return(true);
      }
   }
   return(false);
}
The sell signal, on the other hand, is when price spikes above the upper Envelope but then retreats to within the Envelope while DeMarker is above 0.7. It is also referred to as a bearish fake out. This sell pattern, in essence, detects false breakouts above resistance, which marks buyers exhaustion. The DeMarker being above 0.7 also indicates over bought conditions, which in turn hint at a reversal. Once price falls back inside the Envelope bands, this confirms rejection of the bullish case.
An initial spike above the Upper band often suggests a breakout, however once price retreats to within the bands this is referred to as a fake out. A strong DeMarker indicates overbought momentum, which supports a potential decline. This sell-pattern is suited for range-bound markets, as with the bullish, since prices oscillating within the Envelope would present more of these opportunities.
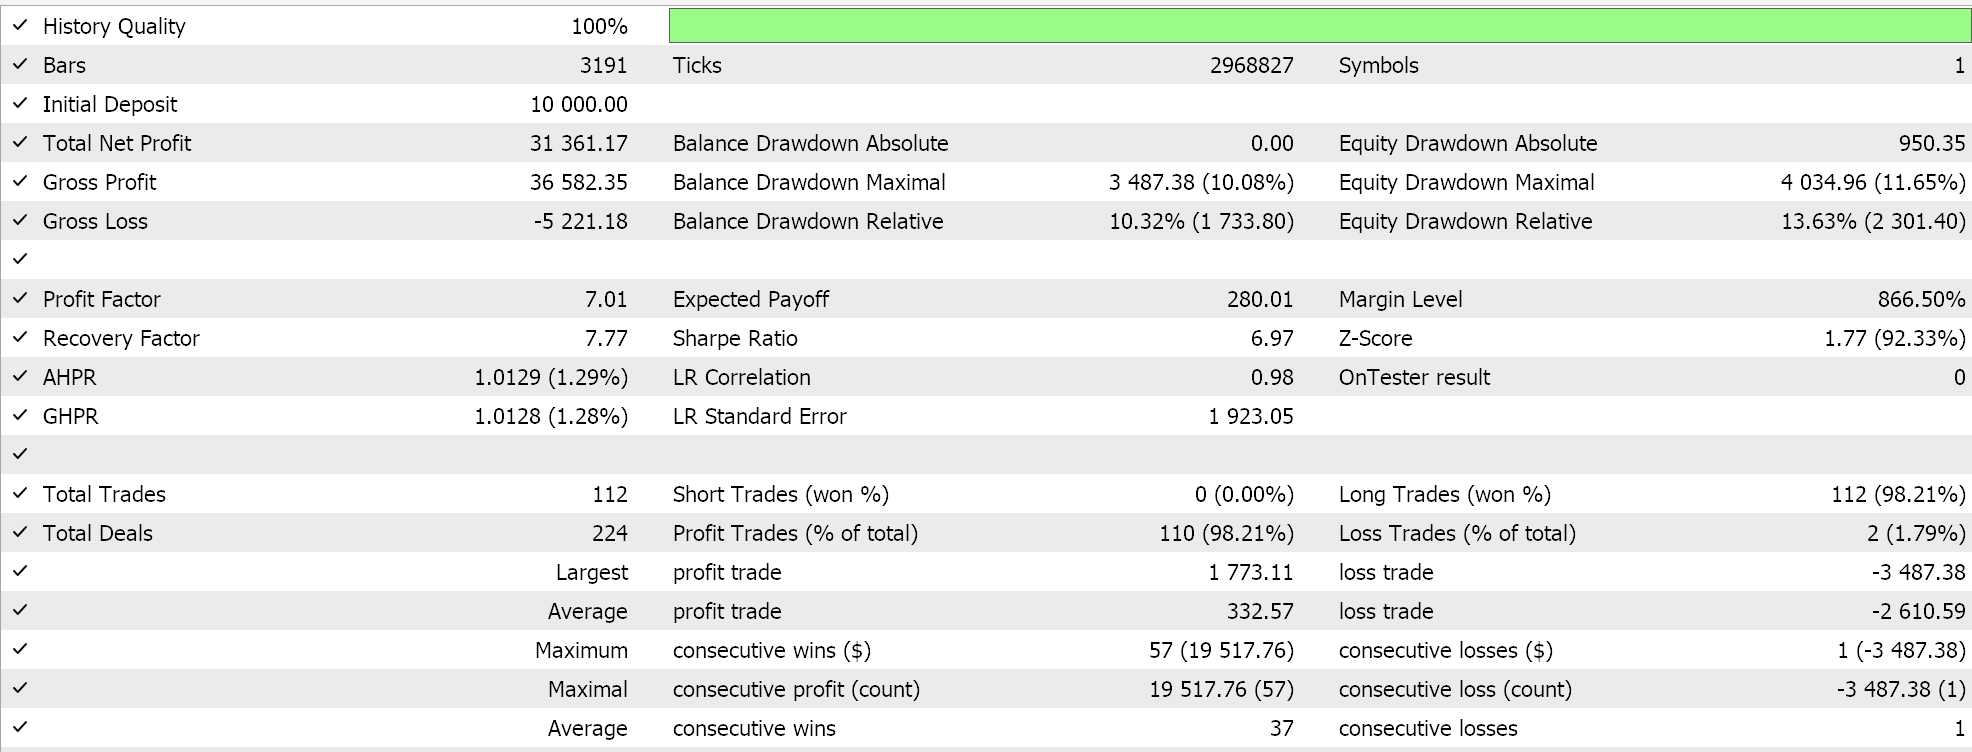
When implementing on live, as proposed with the bullish pattern, it may be a good idea to wait for a bearish candle to close inside the Envelope before entry. Also, as alluded to above, placing a stop-loss above the upper Envelope mitigates break-out risk. This pattern should be avoided in strongly trending markets, and back test optimizations should aim for suitable Envelope settings. After optimizing GBP USD on the 4-hourly for 2023, a test from 2023.01.01 to 2025.01.01 presented us with the following results:
DeMarker Overbought/Oversold + Price Closes beyond Envelope
The title for this pattern is very similar to our first pattern, however the implementation differs. Here, the buy Signal is when Price closes above the upper envelope for two consecutive candles while DeMarker is above 0.7. This marks Strength Continuation. A signal for strong bullish momentum, it marks a sustained breakout above the resistance level. DeMarker being above 0.7, in this case, confirms high buying pressure and support for continuation. The two consecutive closes of the upper Envelope confirm buying pressure and also support continuation.
Price closing above the upper for two successive candles not only indicates a strong breakout, but the DeMarker reading reinforces the thesis for a continuation, making this pattern suited for trending markets.
When in use, it can additionally be ideal to confirm with an increase in volume or candle length when validating the breakout. A trailing stop below the upper Envelope can be used to lock in profits. The Envelope width, as set by the deviation parameter, can also be fine-tuned to balance sensitivity and reliability. We implement Pattern-1 as follows in MQL5:
//+------------------------------------------------------------------+
//| Check for Pattern 1.                                             |
//+------------------------------------------------------------------+
bool CSignalDEM_ENV::IsPattern_1(ENUM_POSITION_TYPE T)
{  if(T == POSITION_TYPE_BUY && DEM(X()) >= 0.7 && Close(X()) > ENV_UP(X()) && Close(X() + 1) > ENV_UP(X() + 1))
   {  return(true);
   }
   else if(T == POSITION_TYPE_SELL && DEM(X()) <= 0.3 && Close(X()) < ENV_LW(X()) && Close(X() + 1) < ENV_LW(X() + 1))
   {  return(true);
   }
   return(false);
}
The Sell Signal, for Pattern-1, is when Price closes below lower Envelope for two consecutive candles while DeMarker is below 0.3; a marker for Strengthening Downtrends. This indication of strong bearish momentum with sustained breakdown below support gets backed up by a weak DeMarker that means sustained selling pressure; supporting the continuation thesis. When price closes below the lower Envelope for 2 consecutive candles and the DeMarker confirms bearish momentum is in play, we have a signal that is best suited for bearish trending with clear directional moves.
As suggested with the bullish signal, it is a good idea to look for high volume or strong bearish candles to confirm the break lower. A trailing-stop for already opened profitable positions can be moved to just above the upper Envelope to lock them in, and back testing of the Envelope deviation parameter should be thorough to avoid whipsaws of choppy markets. After optimizing GBP USD over 2023 and forward walking to 2024 on the 4-hour time frame, we get the following results:

DeMarker Forms Divergence + Envelope
Pattern-2’s buy Signal is when price makes a lower low touching the lower envelope, while the DeMarker makes a higher low, which amounts to a Bullish Divergence with Envelope Support. This pattern highlights a weakening bearish momentum at important support levels. The divergence between price and DeMarker proposes a reversal is about to happen. The lower Envelope acts as a strong support zone, reinforcing the setup.
The argument for this is that when price forms a lower low at the lower Envelope while Demarker’s high is indicating diminishing selling pressure, there is a divergence. When this divergence is combined with price at a support level, a bullish reversal is implied. This setup therefore is ideal for catching reversals in downtrends of preferably range-bound markets.
Guidance in implementing this pattern requires confirmation with a bullish candle or pattern, such as the hammer, at the lower Envelope. Setting the stop-loss below the lower Envelope manages position risk. Also, strong downtrends should be avoided without additional confirmation. We implement both the bullish and bearish as follows in MQL5:
//+------------------------------------------------------------------+
//| Check for Pattern 2.                                             |
//+------------------------------------------------------------------+
bool CSignalDEM_ENV::IsPattern_2(ENUM_POSITION_TYPE T)
{  if(T == POSITION_TYPE_BUY && DEM(X()) > DEM(X() + 1) && Low(X()) <= ENV_LW(X()) && Low(X() + 1) > ENV_LW(X() + 1))
   {  return(true);
   }
   else if(T == POSITION_TYPE_SELL && DEM(X()) < DEM(X() + 1) && High(X()) >= ENV_UP(X()) && High(X() + 1) < ENV_UP(X() + 1))
   {  return(true);
   }
   return(false);
}
For the sell signal, price makes a higher high touching the upper envelope, but DeMarker makes a lower high, indicating a bearish divergence with Envelope resistance. This bearish pattern identifies fading bullish momentum at key resistance levels. The DeMarker’s lower high versus price’s higher high also signals a reversal. Meanwhile, the upper Envelope provides a resistance zone which strengthens the setup.
Reasons for why this is bearish are that when price gets to a higher high at the upper Envelope, while the DeMarker is so low, buying pressure is weakening. This divergence does therefore point to a potential bearish reversal. This sell setup is more effective in uptrends that are running out of steam or range-bound conditions. Test results from running pattern 2 are presented below:

Despite some profit being reflected this pattern did not forward walk or earn profits outside of the trained time period.
On use, it is always a good idea to wait for a bearish-candle, such as a shooting star, for confirmation. And, placing a stop-loss above the upper Envelope will limit losses in the even price breaks out and the range-bound markets turn to trending. This also being a divergence pattern, needs to be tested across multiple time frames in order to find what works.
DeMarker Crossing 0.5 + Pulling Back to Envelope Midline
Pattern-3’s buy Signal is when DeMarker crosses 0.5 upward and price pulls back to envelope midline, a Buy-Pullback. This pattern captures pullbacks to the mean when early bullish momentum shifts. The DeMarker crossing 0.5 upward does indicate growing buying pressure. The Envelope midline then acts as dynamic support, which is suited for low-risk entries.
The explanation for why this is plausible for bullish is that the DeMarker crossing above 0.5 indicates a shift from neutral to bullish momentum. Once price pulls back to the Envelope midline (which typically amounts to a moving average), this tends to offer a high-probability entry point. This setup is suited for trending or consolidating markets with clear pullback patterns.
When in use, it is important to confirm with a bullish candle or with the price holding above the mid-line. Setting of stop loss below the midline or recent swing low should be suitable. The DeMarker indicator period should also be adjusted to align with market volatility. This is how we implement this pattern for both bullish and bearish signals in MQL5:
//+------------------------------------------------------------------+
//| Check for Pattern 3.                                             |
//+------------------------------------------------------------------+
bool CSignalDEM_ENV::IsPattern_3(ENUM_POSITION_TYPE T)
{  if(T == POSITION_TYPE_BUY && DEM(X()) > 0.5 && DEM(X() + 1) < 0.5 && Close(X()) < ENV_MID(X()) && Close(X() + 1) > ENV_MID(X() + 1))
   {  return(true);
   }
   else if(T == POSITION_TYPE_SELL && DEM(X()) < 0.5 && DEM(X() + 1) > 0.5 && Close(X()) > ENV_MID(X()) && Close(X() + 1) < ENV_MID(X() + 1))
   {  return(true);
   }
   return(false);
}
The sell signal for pattern-3 is when the DeMarker crosses 0.5 when heading downward and price pulls back to the Envelope midline. This target pullback to the mean marks an early bearish momentum shift. The DeMarker crossing below 0.5 signals increasing selling pressure, with the Envelope midline acting as dynamic resistance for short entries.
The Envelope midline therefore provides a low-risk entry for short trades. This setup, though, is effective in bearish trends or range-bound markets with pullbacks. Optimization runs for GBP USD for the year 2023 on the 4-hour time frame followed by forward walk test give us this report:
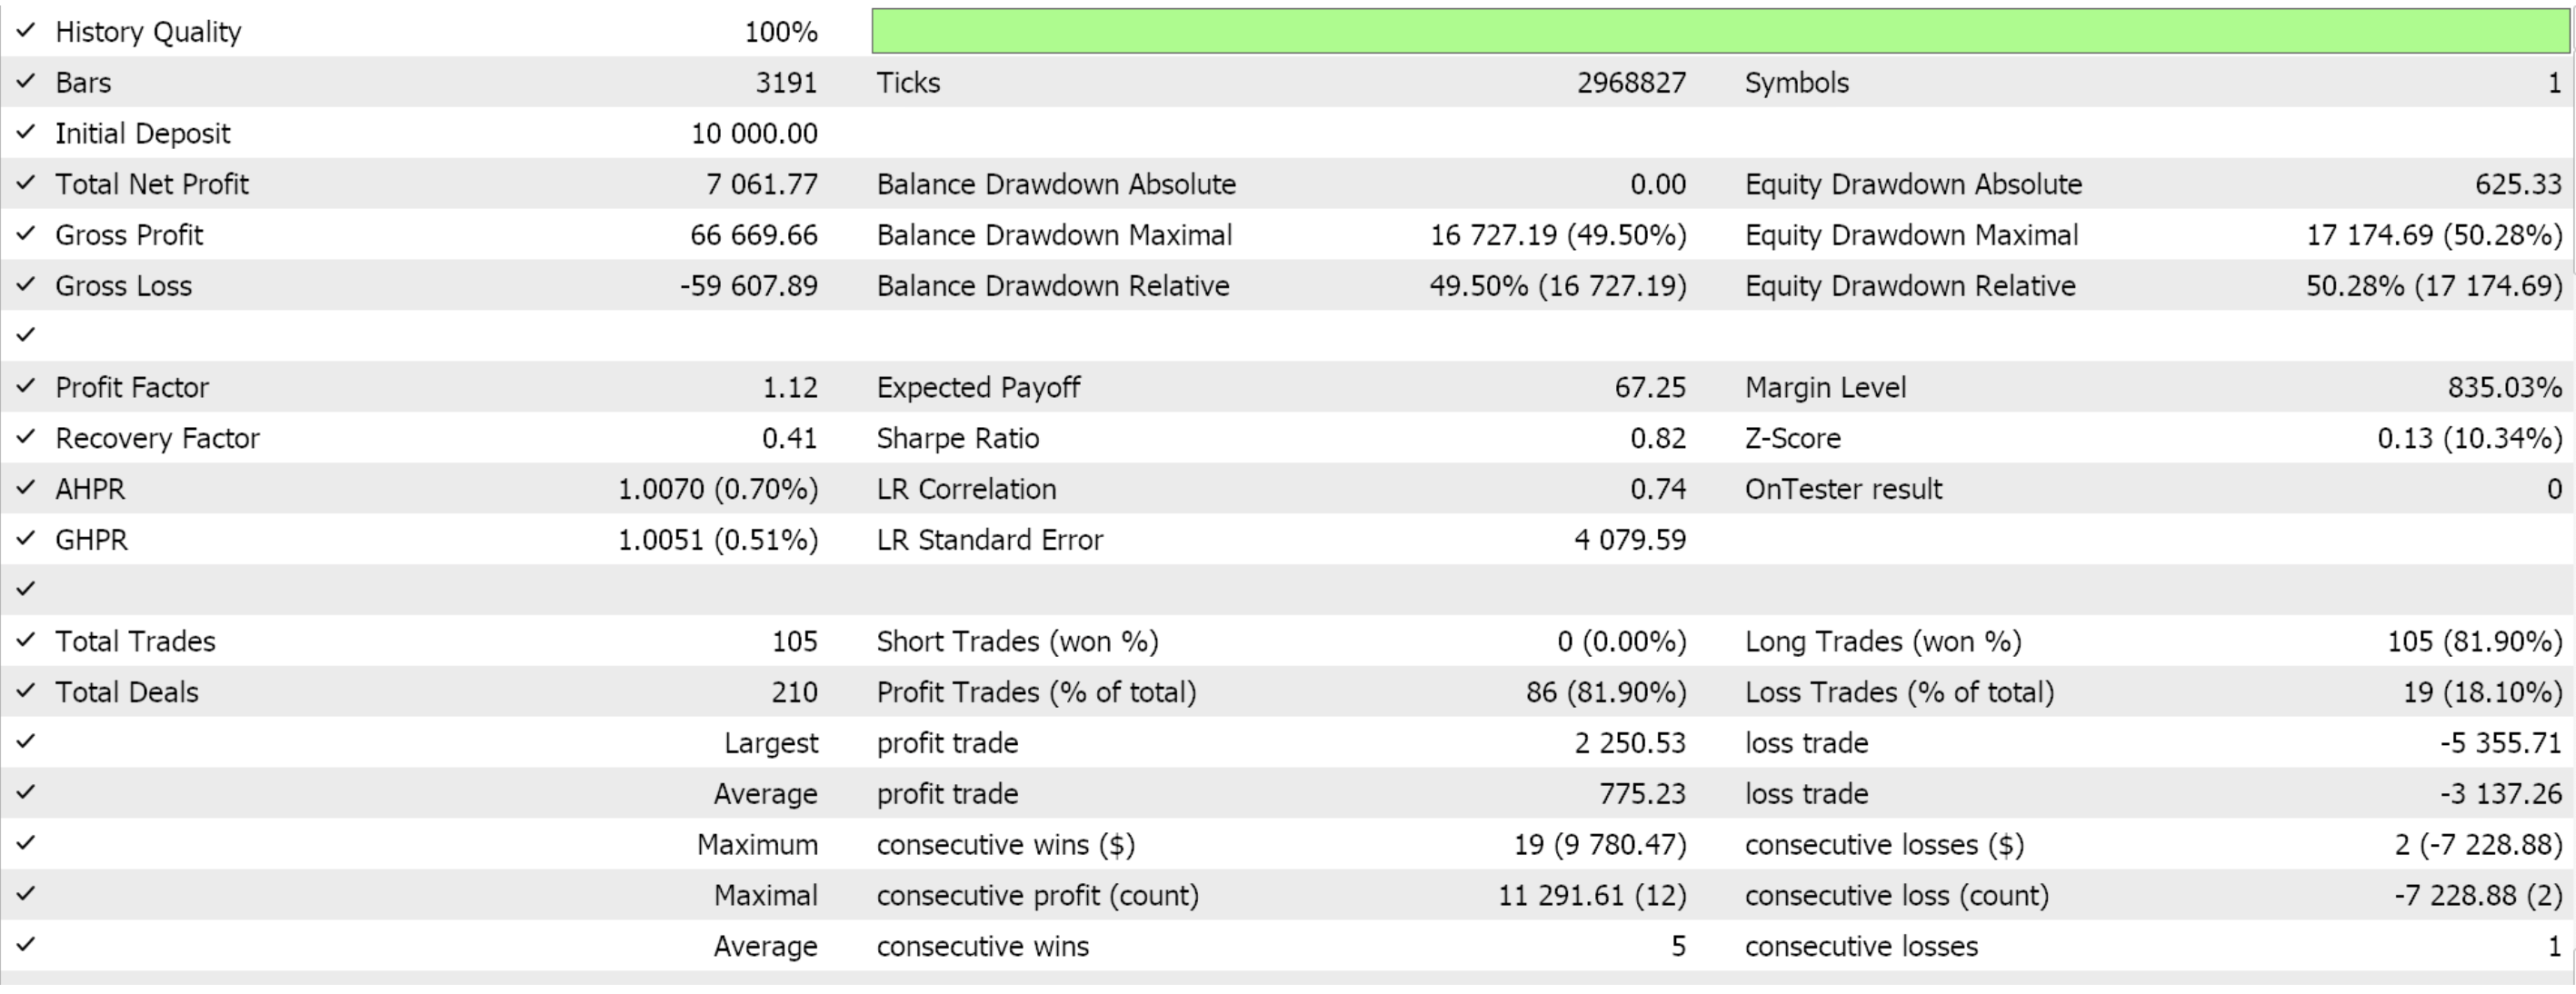
Despite some profit being reflected this pattern did not forward walk or earn profits outside of the trained time period.
Confirmation with a bearish candle or rejection at the midline is also always a good idea. Stop-loss placement can be above the midline or recent swing high. When back testing or optimizing, some emphasis should be placed on the Envelope indicator period in order to have optimal midline accuracy.
Envelope Squeeze + DeMarker Building Pressure
Pattern-4’s buy signal is the Envelope narrowing tightly to form a squeeze, with the DeMarker slowly rising from 0.4–0.6 to signify a likely upward breakout. This pattern picks up impending bullish breakouts after periods of low volatility. The narrowing Envelope indicate a squeeze, with potentially volatile moves to follow. The DeMarker rising within the neutral zone does point to building bullish pressure. This setup is thus suited for breakout trades in anticipation of a strong move upward. Confirmation, when adopted for live, with price closing above the upper Envelope, can be adopted. Stop-loss should be placed below the lower Envelope or recent low. Monitoring for false breakouts will remain important, especially when dealing with low liquidity markets. We implement pattern-4 in MQL5 as follows:
//+------------------------------------------------------------------+
//| Check for Pattern 4.                                             |
//+------------------------------------------------------------------+
bool CSignalDEM_ENV::IsPattern_4(ENUM_POSITION_TYPE T)
{  if(ENV_UP(X() + 1) - ENV_LW(X() + 1) > ENV_UP(X()) - ENV_LW(X()))
   {  if(T == POSITION_TYPE_BUY && DEM(X() + 1) >= 0.4 && DEM(X()) <= 0.6 && DEM(X() + 1) < DEM(X()))
      {  return(true);
      }
      else if(T == POSITION_TYPE_SELL && DEM(X() + 1) <= 0.6 && DEM(X()) >= 0.4 && DEM(X() + 1) > DEM(X()))
      {  return(true);
      }
   }
   return(false);
}
The Sell Signal of this pattern is when the Envelope squeeze and the DeMarker slowly falls from 0.6–0.4, marking a likely breakout to the downside. This bearish pattern spots bearish breakouts that happen after bouts of low-volatility. Tight Envelope mark a squeeze, which sets up potential for a sharp move. A DeMarker that is starting to decline within the neutral zone indicates this bearish pressure is accumulating. This setup suits breakout trades expecting downward move. Optimization over 2023, followed by test run for 2023 and 2024 gives us the following report. We are testing GBP USD on the 4-hour:

Despite some profit being reflected this pattern did not forward walk or earn profits outside of the trained time period.
Confirmation with price closing below the lower envelope can help sharpen entries. Setting stop-loss above the upper envelope or recent high will limit risk, and a Back test can focus on squeeze duration for optimal signal timing.
DeMarker Extremes + Envelope Expansion
Pattern-5’s buy is when DeMarker stays above 0.7 and the upper Envelope expands into a Strong Bullish Breakout, marking continuation Buy. This pattern captures powerful bullish breakouts that have sustained momentum. When DeMarker is above 0.7 it confirms extreme buying pressure. The expanding upper Envelope marks increasing volatility and supports continuation. This is a setup for trending markets and continuation trades. Entry should ideally be on a strong close above the upper Envelope with volume confirmation. A trailing stop can be placed below the midline. This pattern should however be avoided in over extended markets where DeMarker readings above 0.7 are prolonged. Implementation in MQL5 is as follows:
//+------------------------------------------------------------------+
//| Check for Pattern 5.                                             |
//+------------------------------------------------------------------+
bool CSignalDEM_ENV::IsPattern_5(ENUM_POSITION_TYPE T)
{  if(T == POSITION_TYPE_BUY && DEM(X()) > 0.7 && ENV_UP(X()) > ENV_UP(X() + 1))
   {  return(true);
   }
   else if(T == POSITION_TYPE_SELL && DEM(X()) < 0.3 && ENV_LW(X()) < ENV_LW(X() + 1))
   {  return(true);
   }
   return(false);
}
The sell signal is when DeMarker is below 0.3 and lower envelope drops, a Strong Bearish signal, which usually means Continued Selling. This pattern spots robust bearish breakdowns with sustained momentum. The DeMarker being below means selling pressure is elevated, with expanding lower Envelope supporting continuation. It is suited for bearish markets with clear directional moves. Testing GBP USD from 2023.01.01 to 2025.01.01 after optimizing for the year 2023, gives us the following report:

When in use, entry on a strong close below the lower Envelope with volume support will offer safer entries. Using a trailing stop above the midline and monitoring to ensure oversold conditions are not too persistent, can help lock in profits and sharpen entry, respectively.
Double Touch of Envelope + DeMarker Base Formation
This pattern’s buy signal is when Price tests the lower Envelope twice, forming a “W” bottom, while the DeMarker gradually moves up from oversold territory, marking a strong reversal buy. This pattern detects strong bullish reversals at key support levels. The double touch of the lower Envelope forms a “W” pattern that usually means the support is holding. Since the DeMarker is rising from oversold levels, this tends to confirm bullish momentum.
This pattern needs to be heeded in range-bound markets or corrective markets with clear support zones. When in use, confirmation with a bullish candle closing above the “W” neckline can be helpful. The setting of stop-loss should be below the lower Envelope or “W” low. It is also important to ensure that the DeMarker shows clear upward movement in order to avoid false signals. We implement the bullish and bearish patterns in MQL5 as follows:
//+------------------------------------------------------------------+
//| Check for Pattern 6.                                             |
//+------------------------------------------------------------------+
bool CSignalDEM_ENV::IsPattern_6(ENUM_POSITION_TYPE T)
{  if(T == POSITION_TYPE_BUY && DEM(X()) > DEM(X() + 1) && Low(X()) > ENV_LW(X()) && Low(X() + 1) <= ENV_LW(X() + 1) && Low(X() + 2) >= ENV_LW(X() + 2) && Low(X() + 3) <= ENV_LW(X() + 3) && Low(X() + 4) >= ENV_LW(X() + 4))
   {  return(true);
   }
   else if(T == POSITION_TYPE_SELL && DEM(X()) < DEM(X() + 1) && High(X()) < ENV_UP(X()) && High(X() + 1) >= ENV_UP(X() + 1) && High(X() + 2) <= ENV_UP(X() + 2) && High(X() + 3) >= ENV_UP(X() + 3) && High(X() + 4) <= ENV_UP(X() + 4))
   {  return(true);
   }
   return(false);
}
Pattern-6’s sell signal is when Price tests upper envelope twice, creating an “M” top, while DeMarker gradually moves down from overbought, indicating a Strong Reversal Sell. This pattern helps identify strong bearish reversals at significant resistance levels. The double touch of an “M” on the upper Envelope signals that the resistance is holding. A falling DeMarker confirms fading bullish momentum.me frame and Effective in range-bound markets test results for this specific pattern with same symbol time period as the other patterns above give us the following report:
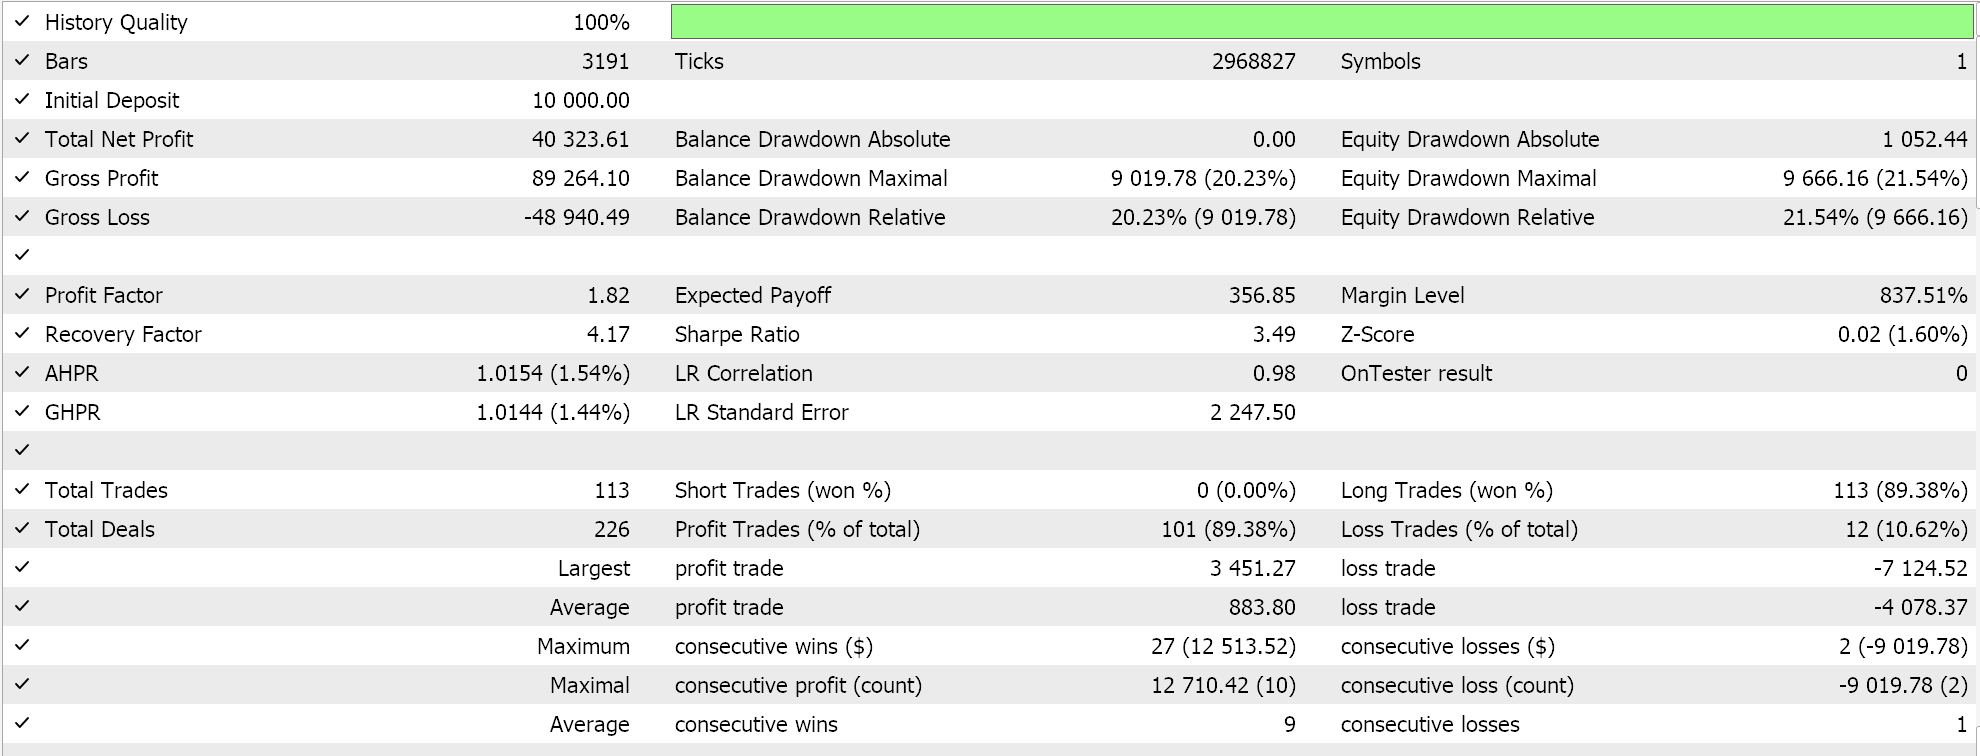
When in use, confirmation with a bearish candle closing below the M neckline can be an extra filter. Stop-loss can be placed above the upper Envelope or “M” high. DeMarker downward trait should also be verified to avoid false entries.
DeMarker Sharp Recovery from Extreme + Breakout Beyond Envelope
Pattern-7’s buy signal is the DeMarker sharply recovering from levels that are sub 0.3 to rise above 0.5 within a few candles; while concurrently price closes above the upper envelope. This pattern captures explosive bullish moves after a spate of oversold conditions. The sharp recovery of the DeMarker also signals a rapid momentum shift, with price breaking above the upper Envelope, confirming the strength of the breakout. This setup can be targeted towards volatile markets or news-driven spikes.
When in use, an extra confirmation filter of high volume and a strong bullish candle can be added. Stop-losses can be below the lower Envelope or recent swing low. Caution should be exercised when dealing with reversals in over extended breakouts, by using trailing stops. We implement pattern-7 in MQL5 as follows:
//+------------------------------------------------------------------+
//| Check for Pattern 7.                                             |
//+------------------------------------------------------------------+
bool CSignalDEM_ENV::IsPattern_7(ENUM_POSITION_TYPE T)
{  if(T == POSITION_TYPE_BUY && DEM(X()) >= 0.5 && DEM(X() + 2) <= 0.3 && Close(X()) > ENV_UP(X()) && Close(X() + 1) <= ENV_UP(X() + 1))
   {  return(true);
   }
   else if(T == POSITION_TYPE_SELL && DEM(X()) <= 0.5 && DEM(X() + 2) >= 0.8 && Close(X()) < ENV_LW(X()) && Close(X() + 1) >= ENV_LW(X() + 1))
   {  return(true);
   }
   return(false);
}
The sell signal for this is the DeMarker sharply dropping from above 0.7 to below 0.5, and price closing below the lower Envelope. This pattern identifies sharp bearish moves after an overbought session(s). The rapid DeMarker drop does indicate swift momentum reversal. Price breaking below the lower Envelope tends to confirm this breakdown in strength. Like the bullish counterpart, it is suited for volatile or event driven sell-offs. Testing, with a forward walk of a year after optimization over one year, presents us with the following results:
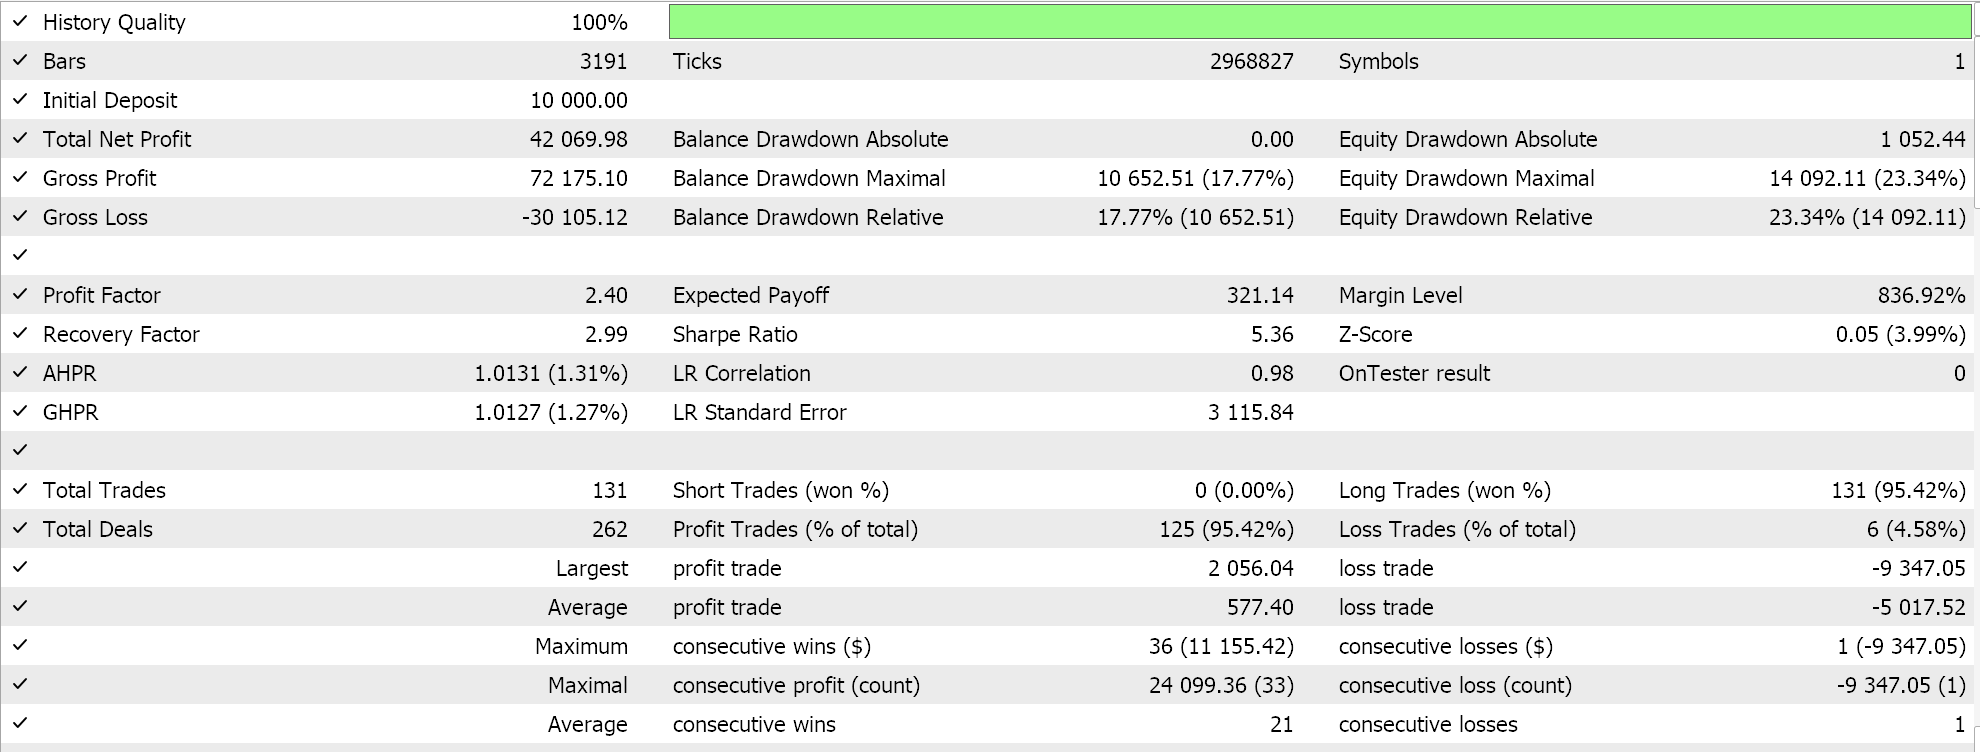
When using, confirmation filter of high volume and strong bearish candle can be applied. Stop loss should be placed above the upper Envelope or recent high-swing. Given the volatile setting of this pattern, constant monitoring for changes in underlying price action is essential.
DeMarker Extreme Levels + Retest of Envelope
Pattern-8, the 9th, has its buy defined as price breaking the upper Envelope with the DeMarker going above 0.7, such that the low is above the upper Envelope. This targets pullbacks for low-risk entries. A high DeMarker reading confirms bullish momentum during the breakout, and the price retesting of the upper Envelope of support offers a high probability entry. It is effective in trending markets, where breakouts are clear. When using a filter to confirm this bullish throwback, a bullish candle can be used where if it's holding above the upper Envelope, it's a green light. Stop-loss can be put below the upper or a recent low. This pattern should be avoided in choppy markets. We implement this in MQL5 as follows:
//+------------------------------------------------------------------+
//| Check for Pattern 8.                                             |
//+------------------------------------------------------------------+
bool CSignalDEM_ENV::IsPattern_8(ENUM_POSITION_TYPE T)
{  if(T == POSITION_TYPE_BUY && DEM(X()) > 0.7 && Low(X()) > ENV_UP(X()))
   {  return(true);
   }
   else if(T == POSITION_TYPE_SELL && DEM(X()) < 0.3 && High(X()) < ENV_LW(X()))
   {  return(true);
   }
   return(false);
}
The sell signal is if price breaks below lower envelope with DeMarker below 0.3, such that high is below lower envelope, a “Pullback Sell”. This sell pattern identifies pullbacks after a breakdown for low-risk short entries. The DeMarker being below 0.3 often confirms strong bearish momentum. Once price retests, the lower Envelope, its implied resistance sets up a high-probability short. This pattern is suited for bearish trends with confirmed breakdowns. Forward walk tests in similar settings to the patterns above give us the following results:
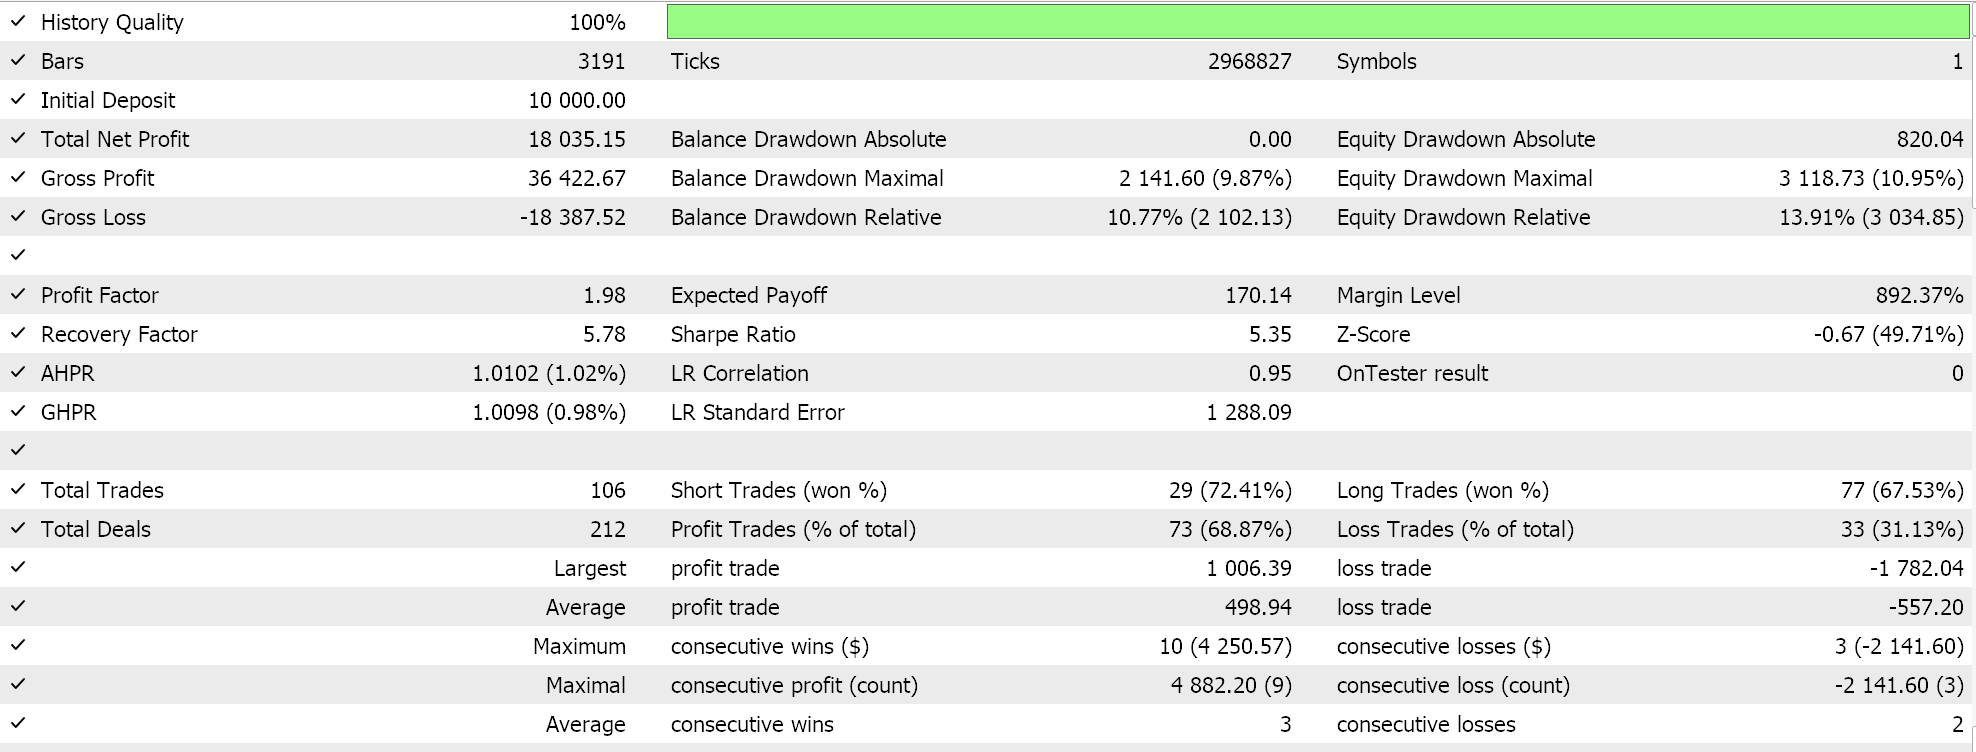
Confirmation of the pullback, with a bearish candle rejecting the lower envelope, can be an added filter. Stop-loss can be placed above the lower envelope or recent high. Back testing for robustness in different market types is also important
Envelope Sharply Tilt + DeMarker Momentum Shift
Our final pattern’s Buy Signal is when the Envelope sharply tilt upward (clearly ascending) and the DeMarker rises above 0.5 as a Strong Trend Buy Signal. Pattern-9’s bullish signal captures the start of strong bullish trends with confirmed momentum. Upward-tilting of the Envelope indicates a clear bull trend and the DeMarker being above 0.5 points to sustained buying pressure. It is ideal for trending markets with sustained directional moves. An extra entry filter can be looking out for price to close above the Envelope midline or the upper Envelope with DeMarker confirmation. The trailing stop-loss can be below the midline, and late entries should be avoided since this pattern has a tendency to overextend. We implement this in MQL5 as follows:
//+------------------------------------------------------------------+
//| Check for Pattern 9.                                             |
//+------------------------------------------------------------------+
bool CSignalDEM_ENV::IsPattern_9(ENUM_POSITION_TYPE T)
{  if(T == POSITION_TYPE_BUY && DEM(X()) > 0.5 && DEM(X() + 1) < 0.5 && ENV_UP(X()) > ENV_UP(X() + 1) && ENV_UP(X() + 1) > ENV_UP(X() + 2))
   {  return(true);
   }
   else if(T == POSITION_TYPE_SELL && DEM(X()) < 0.5 && DEM(X() + 1) > 0.5 && ENV_LW(X()) < ENV_LW(X() + 1) && ENV_LW(X() + 1) < ENV_LW(X() + 2))
   {  return(true);
   }
   return(false);
}
The sell signal on the other mirrors our bullish pattern by having the Envelope sharply tilted downward and the DeMarker falling below 0.5. This bearish pattern identifies the onset of strong bearish trends that are also confirmed by momentum. The downward tilting Envelope support this thesis further, and on top of that a low DeMarker confirms sustained selling pressure. It is, as expected, effective in bearish markets with clear directional moves. Testing with similar settings as the patterns above presents us with the following reports:
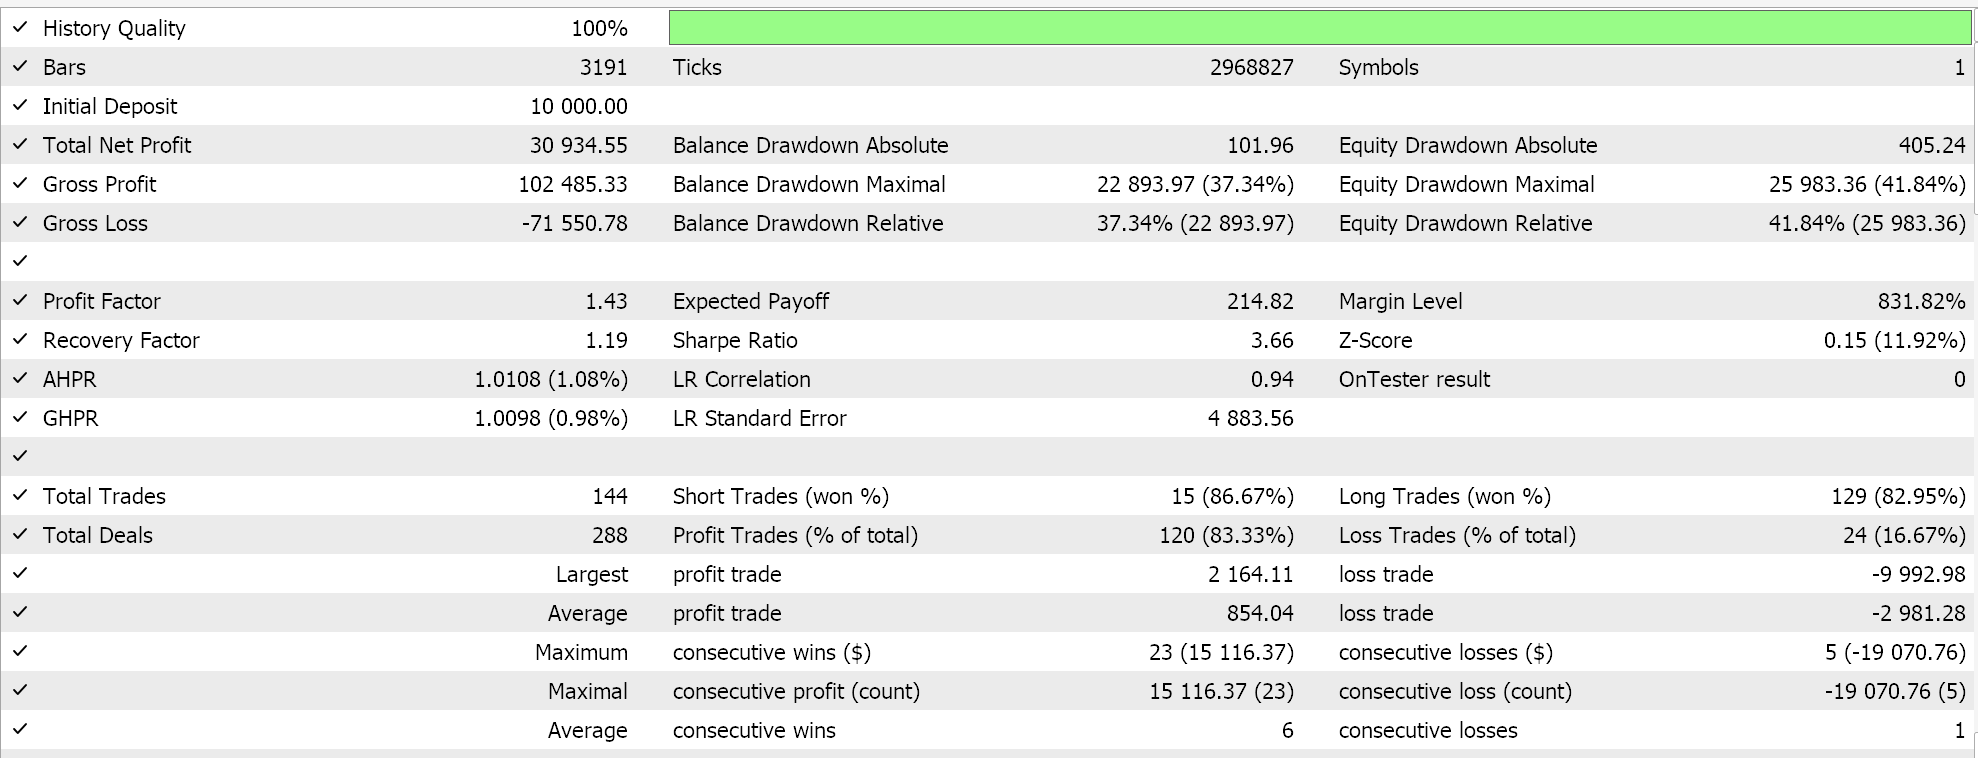
Despite some profit being reflected this pattern did not forward walk or earn profits outside of the trained time period.
An extra filter for bearish pattern-9 can be entry with close below midline or lower Envelope. Trailing stop-loss can then be placed above the midline or lower Envelope, and one should also watch for too many oversold DeMarker readings in order to avoid late entries.
Conclusion
To sum up, we have introduced another indicator pairing that combines momentum with support/resistance to develop a trading system. From the limited testing of 1-yr forward walks after optimization over the previous year, the pair GBP USD on the 4-hour time frame only performed forward walks on 6 of the 10 patterns. As per the usual, many factors are at play here that could explain these particular outcomes. More testing on longer periods and with intended Broker price data is always recommended. We will now consider next if these simple patterns could be adopted and enhanced with machine learning.
| Name | Description |
|---|---|
| wz63.mq5 | Wizard Assembled Expert Advisor to show files included |
| SignalWZ_63_.mqh | Signal Class File |
Warning: All rights to these materials are reserved by MetaQuotes Ltd. Copying or reprinting of these materials in whole or in part is prohibited.
This article was written by a user of the site and reflects their personal views. MetaQuotes Ltd is not responsible for the accuracy of the information presented, nor for any consequences resulting from the use of the solutions, strategies or recommendations described.
 High frequency arbitrage trading system in Python using MetaTrader 5
 Overcoming The Limitation of Machine Learning (Part 1): Lack of Interoperable Metrics
 Finding custom currency pair patterns in Python using MetaTrader 5
 MQL5 Trading Tools (Part 1): Building an Interactive Visual Pending Orders Trade Assistant Tool
- Free trading apps
- Over 8,000 signals for copying
- Economic news for exploring financial markets
You agree to website policy and terms of use