Articles on the MQL5 programming and use of technical indicators
Technical indicators constitute an important part of trading, and every trader tries to find something new. The authors of these articles talk about econometrics and machine learning, automatic marking of Elliott Waves and digital filters - everything from the classical methods of analysis to the modern interpretation of classical ideas.
The category features articles that will teach you how to develop a custom indicator and contains unique collections of ready-to-use mathematically explained William Blau's trading ideas.
Add a new article

You are missing trading opportunities:
- Free trading apps
- Over 8,000 signals for copying
- Economic news for exploring financial markets
Registration
Log in
You agree to website policy and terms of use
If you do not have an account, please register

Multicurrency monitoring of trading signals (Part 5): Composite signals
In the fifth article related to the creation of a trading signal monitor, we will consider composite signals and will implement the necessary functionality. In earlier versions, we used simple signals, such as RSI, WPR and CCI, and we also introduced the possibility to use custom indicators.

Creating a comprehensive Owl trading strategy
My strategy is based on the classic trading fundamentals and the refinement of indicators that are widely used in all types of markets. This is a ready-made tool allowing you to follow the proposed new profitable trading strategy.

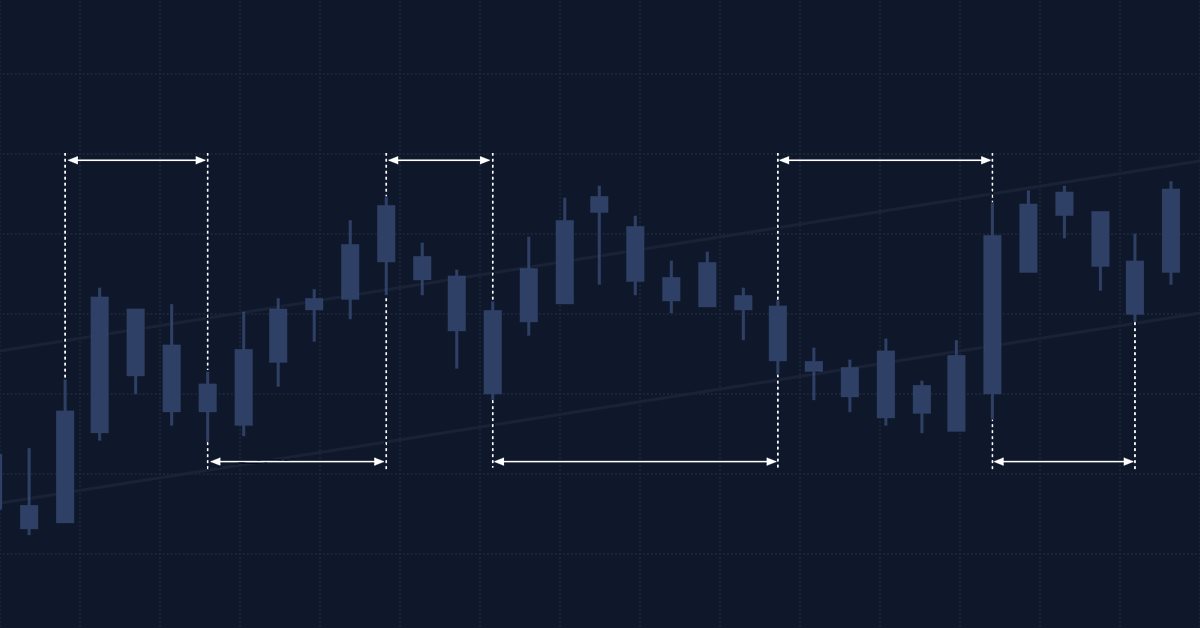
What is a trend and is the market structure based on trend or flat?
Traders often talk about trends and flats but very few of them really understand what a trend/flat really is and even fewer are able to clearly explain these concepts. Discussing these basic terms is often beset by a solid set of prejudices and misconceptions. However, if we want to make profit, we need to understand the mathematical and logical meaning of these concepts. In this article, I will take a closer look at the essence of trend and flat, as well as try to define whether the market structure is based on trend, flat or something else. I will also consider the most optimal strategies for making profit on trend and flat markets.

Learn how to design a trading system by Bear's Power
Welcome to a new article in our series about learning how to design a trading system by the most popular technical indicator here is a new article about learning how to design a trading system by Bear's Power technical indicator.

Learn how to design a trading system by MFI
The new article from our series about designing a trading system based on the most popular technical indicators considers a new technical indicator - the Money Flow Index (MFI). We will learn it in detail and develop a simple trading system by means of MQL5 to execute it in MetaTrader 5.

Design Patterns in software development and MQL5 (Part 4): Behavioral Patterns 2
In this article, we will complete our series about the Design Patterns topic, we mentioned that there are three types of design patterns creational, structural, and behavioral. We will complete the remaining patterns of the behavioral type which can help set the method of interaction between objects in a way that makes our code clean.
Multiple indicators on one chart (Part 01): Understanding the concepts
Today we will learn how to add multiple indicators running simultaneously on one chart, but without occupying a separate area on it. Many traders feel more confident if they monitor multiple indicators at a time (for example, RSI, STOCASTIC, MACD, ADX and some others), or in some cases even at different assets which an index is made of.
MQL5 Cookbook: Development of a Multi-Symbol Indicator to Analyze Price Divergence
In this article, we will consider the development of a multi-symbol indicator to analyze price divergence in a specified period of time. The core topics have been already discussed in the previous article on the programming of multi-currency indicators "MQL5 Cookbook: Developing a Multi-Symbol Volatility Indicator in MQL5". So this time we will dwell only on those new features and functions that have been changed dramatically. If you are new to the programming of multi-currency indicators, I recommend you to first read the previous article.

Object-Oriented Approach to Building Multi-Timeframe and Multi-Currency Panels
This article describes how object-oriented programming can be used for creating multi-timeframe and multi-currency panels for MetaTrader 5. The main goal is to build a universal panel, which can be used for displaying many different kinds of data, such as prices, price changes, indicator values or custom buy/sell conditions without the need to modify the code of the panel itself.

Analyzing charts using DeMark Sequential and Murray-Gann levels
Thomas DeMark Sequential is good at showing balance changes in the price movement. This is especially evident if we combine its signals with a level indicator, for example, Murray levels. The article is intended mostly for beginners and those who still cannot find their "Grail". I will also display some features of building levels that I have not seen on other forums. So, the article will probably be useful for advanced traders as well... Suggestions and reasonable criticism are welcome...

Implementation of Indicators as Classes by Examples of Zigzag and ATR
Debate about an optimal way of calculating indicators is endless. Where should we calculate the indicator values - in the indicator itself or embed the entire logic in a Expert Advisor that uses it? The article describes one of the variants of moving the source code of a custom indicator iCustom right in the code of an Expert Advisor or script with optimization of calculations and modeling the prev_calculated value.

How to build and optimize a cycle-based trading system (Detrended Price Oscillator - DPO)
This article explains how to design and optimise a trading system using the Detrended Price Oscillator (DPO) in MQL5. It outlines the indicator's core logic, demonstrating how it identifies short-term cycles by filtering out long-term trends. Through a series of step-by-step examples and simple strategies, readers will learn how to code it, define entry and exit signals, and conduct backtesting. Finally, the article presents practical optimization methods to enhance performance and adapt the system to changing market conditions.
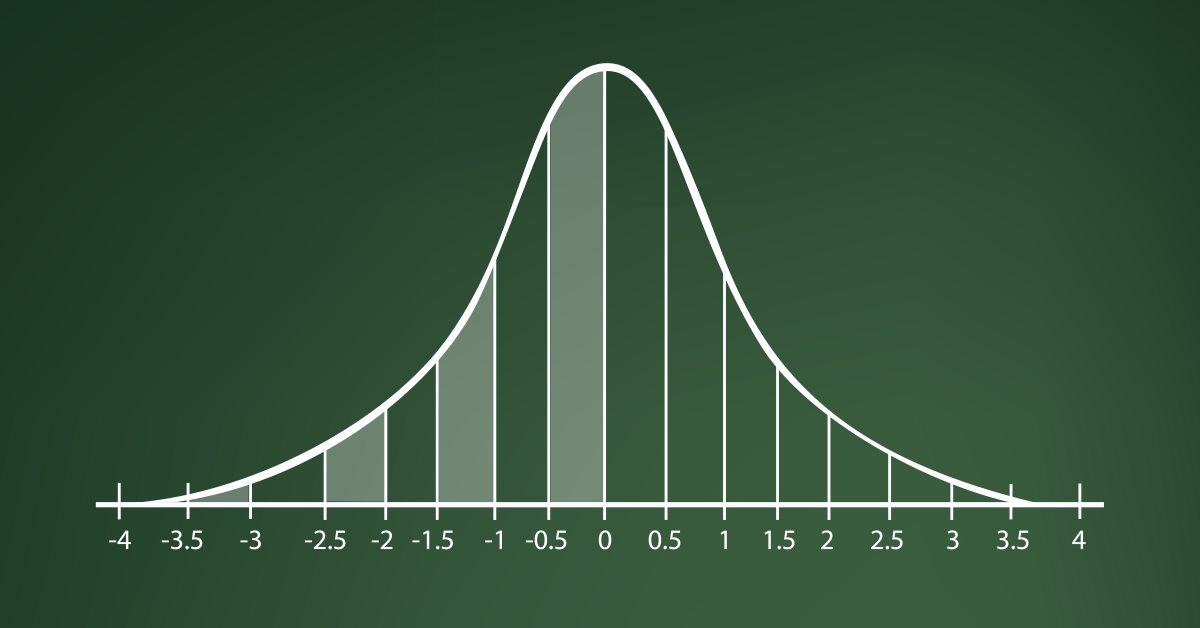
Naive Bayes classifier for signals of a set of indicators
The article analyzes the application of the Bayes' formula for increasing the reliability of trading systems by means of using signals from multiple independent indicators. Theoretical calculations are verified with a simple universal EA, configured to work with arbitrary indicators.

Learn how to design a trading system by Awesome Oscillator
In this new article in our series, we will learn about a new technical tool that may be useful in our trading. It is the Awesome Oscillator (AO) indicator. We will learn how to design a trading system by this indicator.

Drawing Channels - Inside and Outside View
I guess it won't be an exaggeration, if I say the channels are the most popular tool for the analysis of market and making trade decisions after the moving averages. Without diving deeply into the mass of trade strategies that use channels and their components, we are going to discuss the mathematical basis and the practical implementation of an indicator, which draws a channel determined by three extremums on the screen of the client terminal.

Learn how to design a trading system by VIDYA
Welcome to a new article from our series about learning how to design a trading system by the most popular technical indicators, in this article we will learn about a new technical tool and learn how to design a trading system by Variable Index Dynamic Average (VIDYA).

Learn how to design a trading system by Parabolic SAR
In this article, we will continue our series about how to design a trading system using the most popular indicators. In this article, we will learn about the Parabolic SAR indicator in detail and how we can design a trading system to be used in MetaTrader 5 using some simple strategies.

Price Action Analysis Toolkit Development (Part 53): Pattern Density Heatmap for Support and Resistance Zone Discovery
This article introduces the Pattern Density Heatmap, a price‑action mapping tool that transforms repeated candlestick pattern detections into statistically significant support and resistance zones. Rather than treating each signal in isolation, the EA aggregates detections into fixed price bins, scores their density with optional recency weighting, and confirms levels against higher‑timeframe data. The resulting heatmap reveals where the market has historically reacted—levels that can be used proactively for trade timing, risk management, and strategy confidence across any trading style.
Improve Your Trading Charts With Interactive GUI's in MQL5 (Part III): Simple Movable Trading GUI
Join us in Part III of the "Improve Your Trading Charts With Interactive GUIs in MQL5" series as we explore the integration of interactive GUIs into movable trading dashboards in MQL5. This article builds on the foundations set in Parts I and II, guiding readers to transform static trading dashboards into dynamic, movable ones.

Testing Performance of Moving Averages Calculation in MQL5
A number of indicators have appeared since the time of first Moving Average indicator creation. Many of them use the similar smoothing methods, but the performances of different moving averages algorithms have not been studied. In this article, we will consider possible ways of use the Moving Averages in MQL5 and compare their performance.
Learn how to design a trading system by Relative Vigor Index
A new article in our series about how to design a trading system by the most popular technical indicator. In this article, we will learn how to do that by the Relative Vigor Index indicator.
Extending Strategy Builder Functionality
In the previous two articles, we discussed the application of Merrill patterns to various data types. An application was developed to test the presented ideas. In this article, we will continue working with the Strategy Builder, to improve its efficiency and to implement new features and capabilities.

CCI indicator. Upgrade and new features
In this article, I will consider the possibility of upgrading the CCI indicator. Besides, I will present a modification of the indicator.

Freelance Jobs on MQL5.com - Developer's Favorite Place
Developers of trading robots no longer need to market their services to traders that require Expert Advisors - as now they will find you. Already, thousands of traders place orders to MQL5 freelance developers, and pay for work in on MQL5.com. For 4 years, this service facilitated three thousand traders to pay for more than 10 000 jobs performed. And the activity of traders and developers is constantly growing!

Developing a Trading Strategy: The Butterfly Oscillator Method
In this article, we demonstrated how the fascinating mathematical concept of the Butterfly Curve can be transformed into a practical trading tool. We constructed the Butterfly Oscillator and built a foundational trading strategy around it. The strategy effectively combines the oscillator's unique cyclical signals with traditional trend confirmation from moving averages, creating a systematic approach for identifying potential market entries.

Drawing Dial Gauges Using the CCanvas Class
We can find dial gauges in cars and airplanes, in industrial production and everyday life. They are used in all spheres which require quick response to behavior of a controlled value. This article describes the library of dial gauges for MetaTrader 5.

Building a Professional Trading System with Heikin Ashi (Part 1): Developing a custom indicator
This article is the first installment in a two-part series designed to impart practical skills and best practices for writing custom indicators in MQL5. Using Heikin Ashi as a working example, the article explores the theory behind Heikin Ashi charts, explains how Heikin Ashi candlesticks are calculated, and demonstrates their application in technical analysis. The centerpiece is a step-by-step guide to developing a fully functional Heikin Ashi indicator from scratch, with clear explanations to help readers understand what to code and why. This foundational knowledge sets the stage for Part Two, where we will build an expert advisor that trades based on Heikin Ashi logic.
Creating Non-Lagging Digital Filters
The article describes one of the approaches to determining a useful signal (trend) in stream data. Small filtering (smoothing) tests applied to market quotes demonstrate the potential for creating non-lagging digital filters (indicators) that are not redrawn on the last bars.
Learn how to design a trading system by Standard Deviation
Here is a new article in our series about how to design a trading system by the most popular technical indicators in MetaTrader 5 trading platform. In this new article, we will learn how to design a trading system by Standard Deviation indicator.

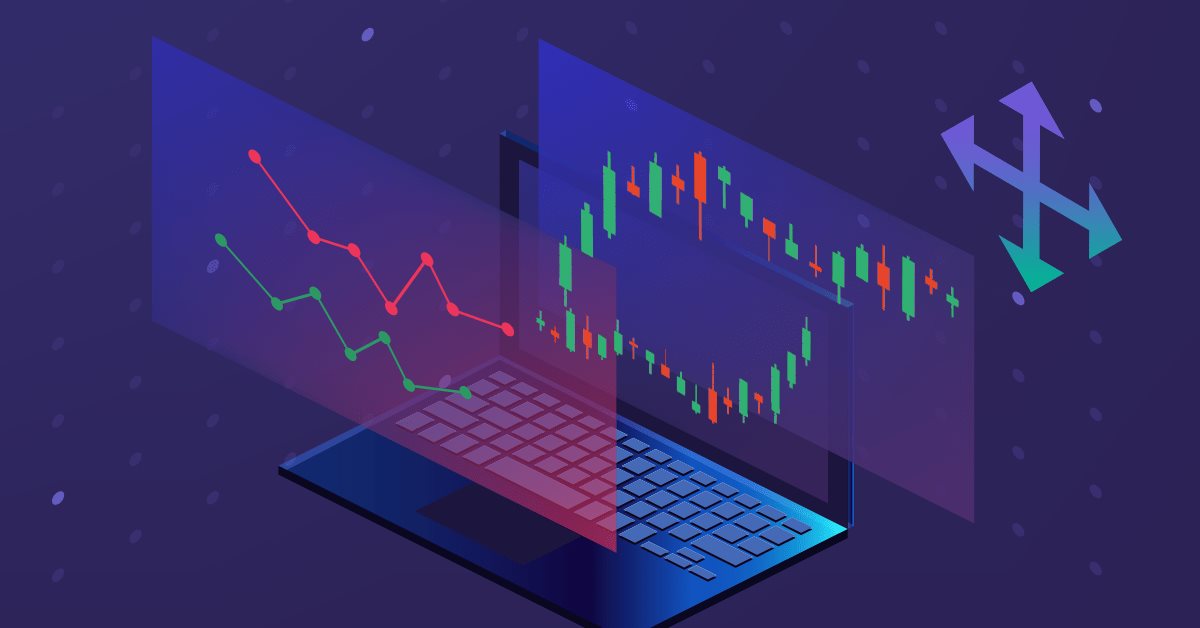
Pair trading
In this article, we will consider pair trading, namely what its principles are and if there are any prospects for its practical application. We will also try to create a pair trading strategy.

Event handling in MQL5: Changing MA period on-the-fly
Suppose that simple MA (Moving Average) indicator with period 13 is applied to a chart. And we want to change the period to 20, but we do not want to go to indicator properties dialog box and edit the number 13 to 20: simply tired of these tedious actions with mouse and keyboard. And especially we don't want to open indicator code and modify it. We want to do all this with a single press of a button - "up arrows" next to the numeric keypad. In this article I'll describe how to do it.
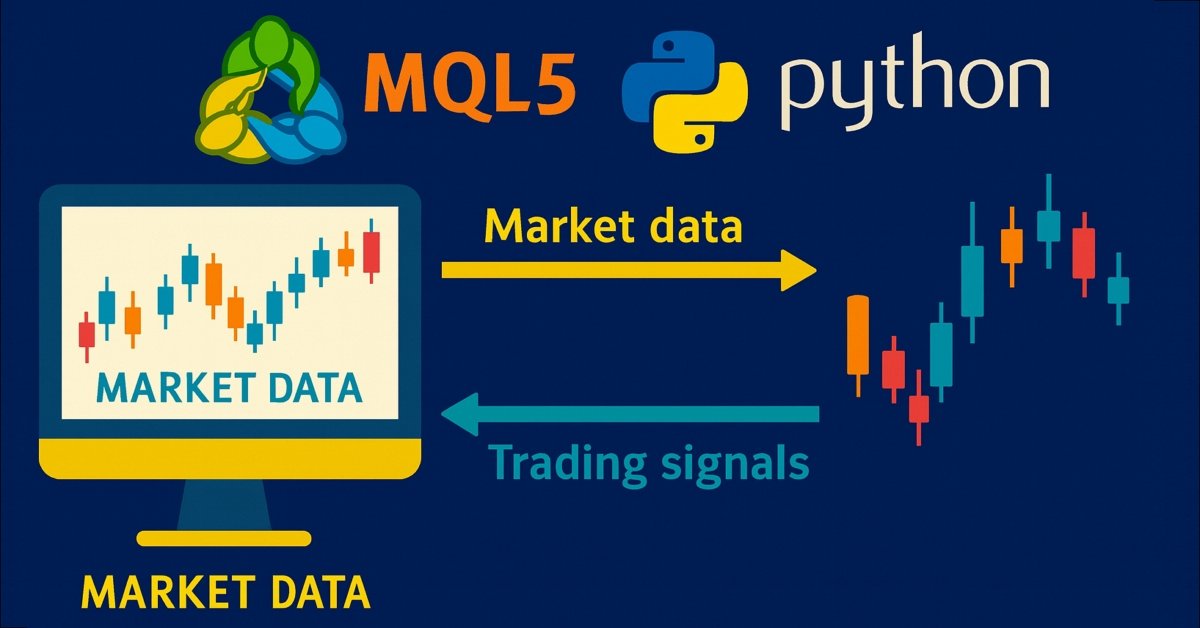
Price Action Analysis Toolkit Development (Part 36): Unlocking Direct Python Access to MetaTrader 5 Market Streams
Harness the full potential of your MetaTrader 5 terminal by leveraging Python’s data-science ecosystem and the official MetaTrader 5 client library. This article demonstrates how to authenticate and stream live tick and minute-bar data directly into Parquet storage, apply sophisticated feature engineering with Ta and Prophet, and train a time-aware Gradient Boosting model. We then deploy a lightweight Flask service to serve trade signals in real time. Whether you’re building a hybrid quant framework or enhancing your EA with machine learning, you’ll walk away with a robust, end-to-end pipeline for data-driven algorithmic trading.
Learn how to design a trading system by Williams PR
A new article in our series about learning how to design a trading system by the most popular technical indicators by MQL5 to be used in the MetaTrader 5. In this article, we will learn how to design a trading system by the Williams' %R indicator.

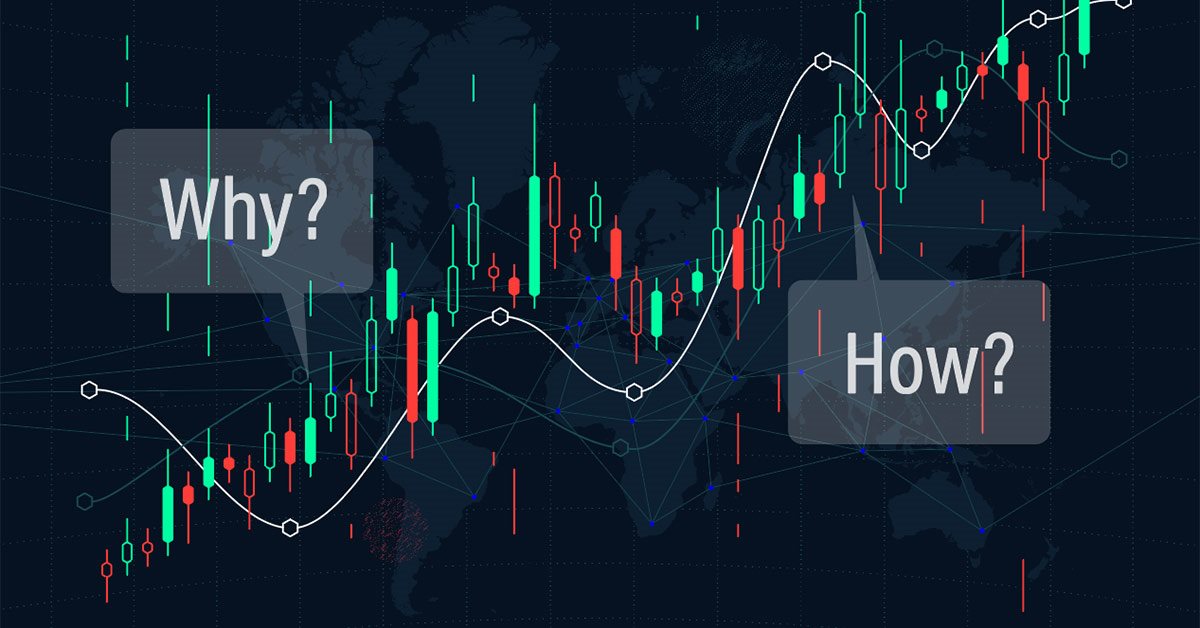
Econometric Approach to Analysis of Charts
This article describes the econometric methods of analysis, the autocorrelation analysis and the analysis of conditional variance in particular. What is the benefit of the approach described here? Use of the non-linear GARCH models allows representing the analyzed series formally from the mathematical point of view and creating a forecast for a specified number of steps.
Adaptive indicators
In this article, I will consider several possible approaches to creating adaptive indicators. Adaptive indicators are distinguished by the presence of feedback between the values of the input and output signals. This feedback allows the indicator to independently adjust to the optimal processing of financial time series values.
Learn how to design a trading system by OBV
This is a new article to continue our series for beginners about how to design a trading system based on some of the popular indicators. We will learn a new indicator that is On Balance Volume (OBV), and we will learn how we can use it and design a trading system based on it.

Technical Indicators and Digital Filters
In this article, technical indicators are treated as digital filters. Operation principles and basic characteristics of digital filters are explained. Also, some practical ways of receiving the filter kernel in MetaTrader 5 terminal and integration with a ready-made spectrum analyzer proposed in the article "Building a Spectrum Analyzer" are considered. Pulse and spectrum characteristics of the typical digital filters are used as examples.

How to visualize multicurrency trading history based on HTML and CSV reports
Since its introduction, MetaTrader 5 provides multicurrency testing options. This possibility is often used by traders. However the function is not universal. The article presents several programs for drawing graphical objects on charts based on HTML and CSV trading history reports. Multicurrency trading can be analyzed in parallel, in several sub-windows, as well as in one window using the dynamic switching command.
Learn how to design a trading system by Accelerator Oscillator
A new article from our series about how to create simple trading systems by the most popular technical indicators. We will learn about a new one which is the Accelerator Oscillator indicator and we will learn how to design a trading system using it.

Introduction to MQL5 (Part 12): A Beginner's Guide to Building Custom Indicators
Learn how to build a custom indicator in MQL5. With a project-based approach. This beginner-friendly guide covers indicator buffers, properties, and trend visualization, allowing you to learn step-by-step.