
MQL5 Wizard Techniques you should know (Part 50): Awesome Oscillator
Introduction
The awesome oscillator is another indicator that was developed by the legendary investor Bill Williams, besides the Alligator that we considered in the last indicator-pattern article. In principle, it is designed to measure market momentum and help pinpoint potential changes in prevalent trends. The Awesome Oscillator (AO) is based on the difference between a 34-period simple moving average (SMA) and a 5-period SMA, where both are applied to the median price. The median price is given by:
(High-Price + Low-Price) / 2
The AO is displayed as an oscillating histogram, above and below the zero-line, which zero-line serves as a marker for no momentum, with a crossing above or below suggesting a potential trend shift. The green-bars on the histogram represent increasing bullish momentum from the previous price bar, while red-bars mark increasing bearish momentum also from the prior bar. Also, as a general overview rule, when histogram bars are above the zero-line this often suggests that a bullish trend is prevalent while if the same histogram bars (again regardless of colour per se) are mirrored on the other side of the zero-line this implies prevalent bearish momentum.
Why the name ‘Awesome’? Well, there isn’t a concise answer, or authoritative source to direct the question to; however, it is argued AO simplifies complicated momentum calculations into a simple visual indicator. By having a dual focus on fast-paced and ‘long-term’ SMAs, it helps traders get a relative sense of both short-term and long-term market dynamics. It is highly versatile, functioning well in trend-following and reversal strategies. Its practical applications are mostly with helping trades align with prevailing market momentum. It can provide potential entry and exit points as we cover below with a variety of signal-patterns, and it can also be useful in divergence analysis which we also exploit is the signal-patterns we consider below.
Despite its many signal-patterns and potential uses, it also has some inherent limitations. Like many oscillators, AO can produce false signals in range-bound or choppy markets a trait which unfortunately means it may work best when combined with other indicators in order to have a broader more comprehensive strategy.
With this quick intro, in keeping with our tradition, let's now consider some of the patterns of AO. For this article, we are looking at 9 different patterns indexed 0 to 8. We, as always, will look at and test each pattern individually, before concluding with a multi-pattern testing which I have argued against rolling out in live account environments unless the trader is very certain of the relative pattern weighting based on his own use experience. To test one pattern at a time, we need to assign the input parameter m_inputs or ‘Patterns Used Bitmap’ to a specific index. If we want to test only pattern 0, this index will be 2 to the power 0. If it is pattern, 4 the index will be 2 to the power 4; and so on.
The attached code is meant to be assembled by the MQL5 wizard and as such it is in a format that makes this assembly straightforward. There are guides here and here on how to do this for readers that are new. These series are about exploiting/ harnessing the advantages afforded by this MQL5 wizard, chief among which are quickly testing and prototyping new ideas. The need to code everything from scratch is an obvious benefit but what could be overlooked is the standard testing platform it presents when testing multiple ideas that can be key in getting a sense of what is really important to one’s own strategy and approach to the markets. Let’s jump in.
Zero Line Crossover
Our first pattern at index 0 is probably the most common pattern for this indicator, and this is the zero-line cross over. By definition, the zero-line in the AO represents a neutral momentum state, meaning the crossing of the histogram above or below this line implies a shift in momentum. It is straightforward, with a bullish cross being marked when AO crosses from below the zero-line to above it, presenting buying opportunity; while a bearish cross is when the AO crosses this zero-line from above to go below it. We implement this in MQL5 as follows:
//+------------------------------------------------------------------+
//| Check for Pattern 0.                                             |
//+------------------------------------------------------------------+
bool CSignalAwesome::IsPattern_0(ENUM_POSITION_TYPE T)
{  if(T == POSITION_TYPE_BUY && AO(X() + 1) < 0.0 && AO(X()) > 0.0)
   {  return(true);
   }
   else if(T == POSITION_TYPE_SELL && AO(X() + 1) > 0.0 && AO(X()) < 0.0)
   {  return(true);
   }
   return(false);
}
Key pointers here with this pattern worth emphasizing are that crosses of the zero-line represent a shift in momentum from bearish to bullish or vice versa depending on the direction of the cross. This has the potential of acting as an early indicator to trend changes for the trader. This last point also leads to the need to have crosses of this line confirmed by alternative indicators such as trend-lines etc. The histogram bars of this oscillator also have their height and steepness about the zero-line serve as indicator of the momentum strength, with taller bars indicating stronger momentum which goes to say that gradual crossings (or crossings with shorter sized bars) often indicate weaker signals than crossings with taller bars.
As always, context matters, therefore the gradual crossings in a bullish environment may not necessarily be a weak signal in the same way that crossings with large-sized histograms in a choppy market may not indicate a strong signal per se. This oscillator can serve as a guide for an entry signal and that is our primary application in this article although since we are using long and short condition thresholds for both opening and closing, inherently signal classes of wizard assembled Expert Advisors also exploit the exit potential of any applied/ selected signal.
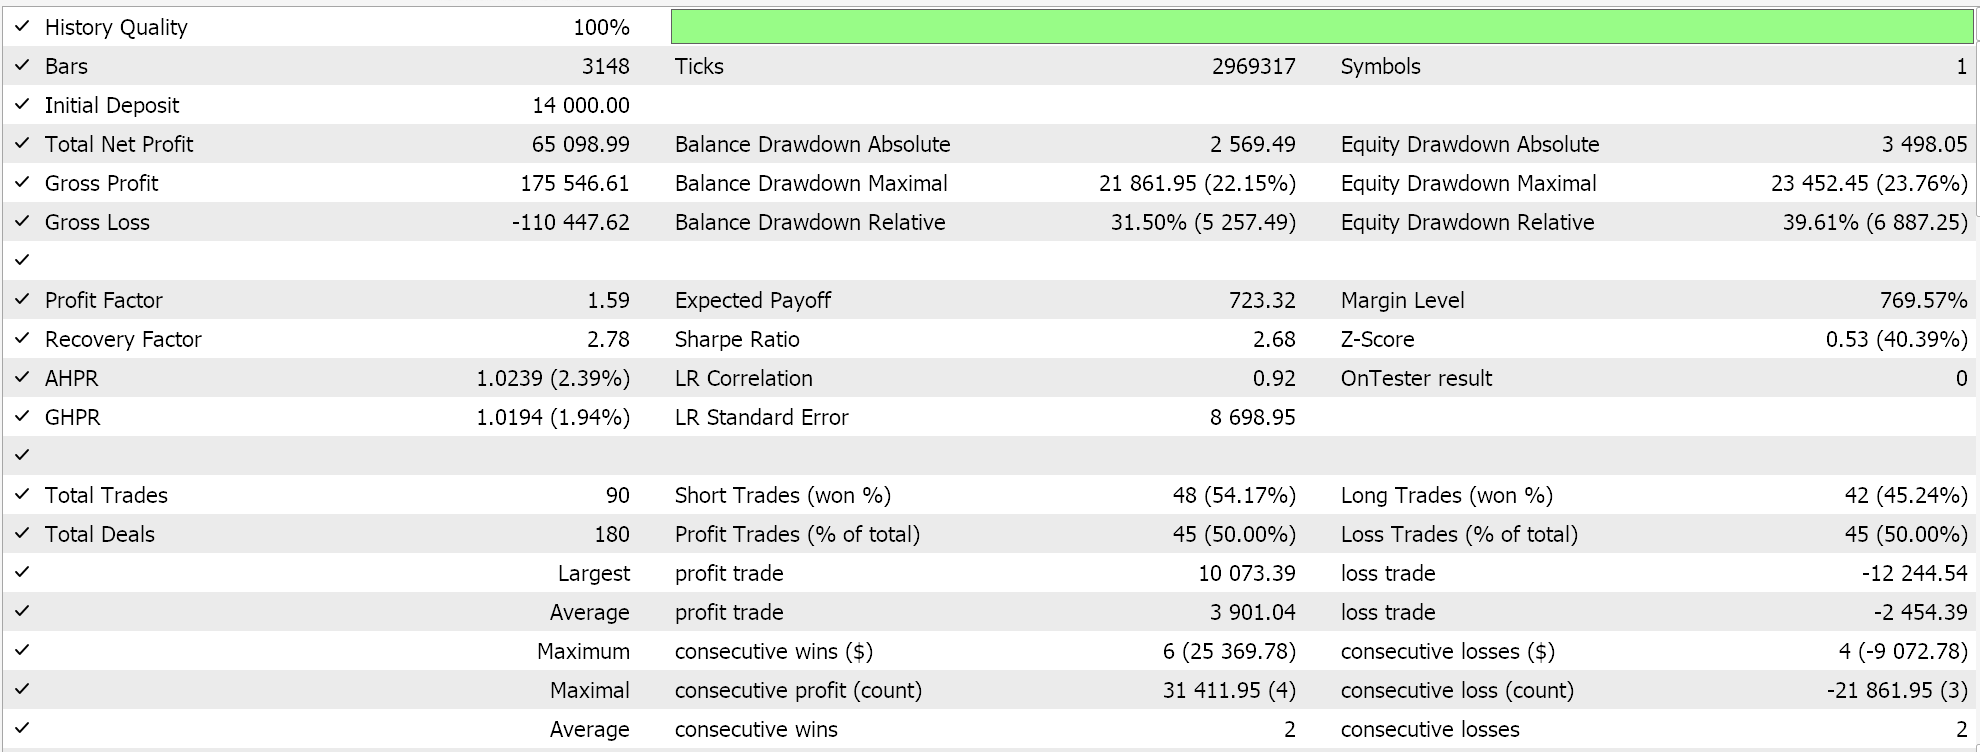
Basic advantages of pattern-0 are ease to interpret, scalability since this oscillator can be attached across multiple time-frames from intraday to long-term charts, and it can act as an early warning for potential trend reversals. Its drawbacks are its lagging nature, since it is based on moving averages and the signal may lag in fast-moving markets. Also, false signals can be common in consolidating markets or when markets are in minor corrections within a prevalent trend. Finally, as already eluded confirmation of its signals is good practice and this inherently means it is not a very strong signal, at least independently. Test results with input settings from a short optimization stint with GBP JPY for the year 2022 on the 4-hourly time frame are presented below:
Twin Peaks Signal
Our second pattern, pattern-1, is the twin-peaks signal and while this is relatively straightforward to interpret when manual trading, automated trading implementation or realizing this in a custom signal, is a bit convoluted. So, for the definition, Twin Peaks occur when two peaks form on the same side of the zero-line either above for bearish or below for bullish with the second peak being closer to the zero line. A key rule for pattern-1 is that the zero-line should not have been breached between the two peaks.
Our bullish signal or bullish twin-peaks are when both peaks are below the zero-line with the more recent peak being closer to the zero-line and conversely the bearish peaks are when both peaks are above the zero line with the most recent peak being closer to the zero-bound. For this, pattern as described, the histogram height between the peaks needs to diminish, to reflect a loss in momentum in the previous trend (the trend about to be flipped). The zero-line also serves as a boundary whereby a crossover prior to the formation of the two peaks invalidates the signal, with also having of the peaks being too close invalidating the signal. Our implementation does not check for the latter and readers can look to implement this independently, however our source is presented below:
//+------------------------------------------------------------------+
//| Check for Pattern 1.                                             |
//+------------------------------------------------------------------+
bool CSignalAwesome::IsPattern_1(ENUM_POSITION_TYPE T)
{  bool _1 = false;
   int _i = X();
   if(T == POSITION_TYPE_BUY && AO(_i) < 0.0 && LowerColor(_i) == clrGreen && LowerColor(_i + 1) == clrRed)
   {  while(AO(_i) < 0.0)
      {  _i++;
         if(LowerColor(_i) == clrGreen && LowerColor(_i + 1) == clrRed)
         {  if(fabs(AO(_i)) < fabs(AO(X())))
            {  _1 = true;
            }
            break;
         }
         if(AO(_i) >= 0.0)
         {  break;
         }
      }
   }
   else if(T == POSITION_TYPE_SELL && AO(_i) > 0.0 && UpperColor(_i) == clrRed && UpperColor(_i + 1) == clrGreen)
   {  while(AO(_i) > 0.0)
      {  _i++;
         if(UpperColor(_i) == clrRed && UpperColor(_i + 1) == clrGreen)
         {  if(fabs(AO(_i)) < fabs(AO(X())))
            {  _1 = true;
            }
            break;
         }
         if(AO(_i) <= 0.0)
         {  break;
         }
      }
   }
   return(_1);
}
Pattern-1 is significant because it often points to prevalent momentum divergence from price-action, which acts as an early warning to reversals. The ability to catch reversals is probably the forte for pattern-1. The exact entry points with these Twin Peaks’ patterns can precisely be after the second peak that is closer to the zero-line has formed and this is what we have implemented in our source above; however, an alternative ‘safer’ approach could be after the oscillator crosses the zero bound after forming the two peaks.
Pattern-1 can also be resourceful in stop loss placement whereby rather than traditionally placing a price stop loss after opening the position on this pattern’s formation, the position gets closed in the event that the oscillator revisits the higher of the two peaks (i.e. the first peak). We do not implement this, but it is something for the reader to explore. In addition, this pattern could be extended to establish profit targets whereby when the zero-line is crossed by the oscillator the position that was opened on the registering of the second smaller peak, gets closed if it is in profit. This last approach would ideally work best on larger time frames, since on smaller time frames, the zero-line could be crossed when the price is still within the spread.
This pattern even though it is rarer and therefore arguably more certain than pattern-0, it can still be paired with trend lines; volume-analysis if volume data is available where higher volume on the second smaller peak can serve as a clear confirmation of the signal; and, with divergence tools in the form of MACD, or RSI where divergence can provide extra confidence for the indicated signal. Its pros include its non-lagging nature when compared to SMA cross-overs or pattern-0, directional precision since it pinpoints not only the next trend but backs this up by highlighting prevalent momentum weakness with the current trend, of course its scalability across different time frames and markets. Testing with optimized settings for GBP JPY for the year 2022 on the 4-hour time frame present us with the following results:
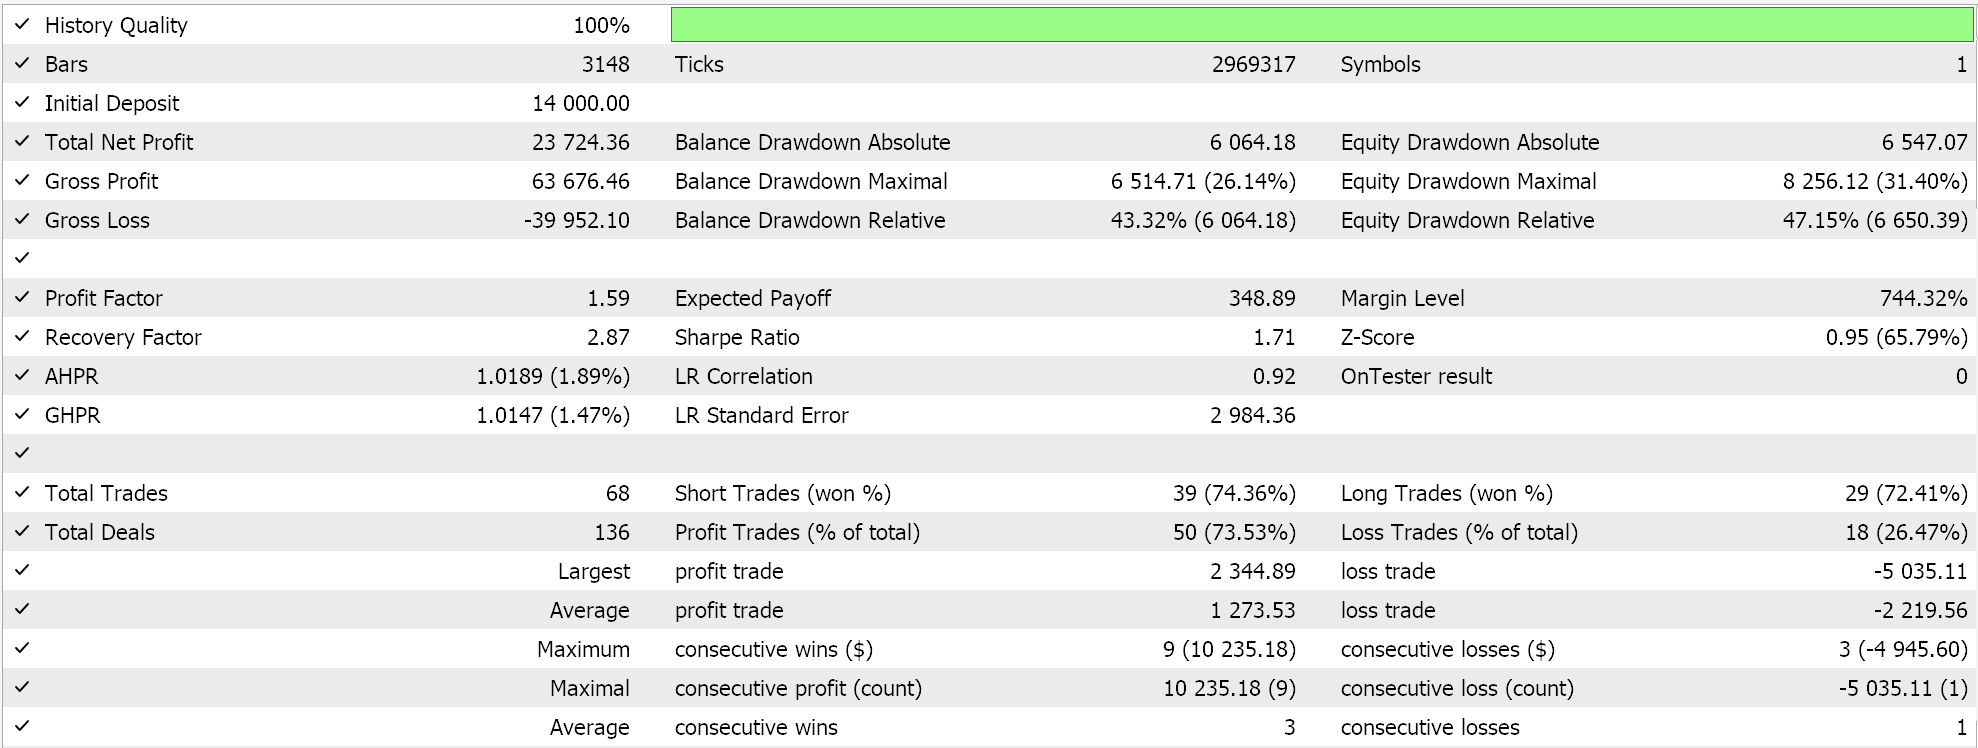
Limitations for pattern-1, stem from its complexity, especially when it comes to implementing this in code. As already argued, this is a relatively simple pattern to infer from a price chart, but having an Expert Advisor interpret it from a price buffer is not the same thing. Also, false signals are bound to be plenty for this pattern in choppy or undecided market environments. Using confirmation with already mentioned tools or even candle stick patterns can help alleviate this.
Saucer Setup
The saucer pattern, our pattern-2, is another AO signal pattern that helps identify potential reversals by reading the colour of the oscillator histogram bars. The bullish saucer setup indicates potential upward reversal in market momentum that is marked by two consecutive red histogram bars, where the second histogram bar is of a smaller magnitude than the prior, and the third bar, following these two, is green and taller than the second short red bar. These bars all need to be above the zero-line, and the entry signal is often at the close of the green bar.
The bearish saucer setup is as one would expect, the flip of the bullish, where we have 2 consecutive green bars with the second closer to the zero-line (or shorter) and the third bar being red and taller than the 2nd shorter green bar. All these bars would be flipped from the bullish saucer and would be below the zero-line, and the entry signal would be, as we saw with the bullish, at the close of the red bar. Key with this pattern is that it depends on momentum shifts rather than raw price action, and this tends to make it effective in identifying short-term trend reversals or re-affirming the strength of larger trends. We implement this in MQL5 as follows:
//+------------------------------------------------------------------+
//| Check for Pattern 2.                                             |
//+------------------------------------------------------------------+
bool CSignalAwesome::IsPattern_2(ENUM_POSITION_TYPE T)
{  if(T == POSITION_TYPE_BUY && UpperColor(X() + 2) == clrRed && UpperColor(X() + 1) == clrRed && UpperColor(X()) == clrGreen)
   {  return(true);
   }
   else if(T == POSITION_TYPE_SELL && LowerColor(X() + 2) == clrGreen && LowerColor(X() + 1) == clrGreen && LowerColor(X()) == clrRed)
   {  return(true);
   }
   return(false);
}
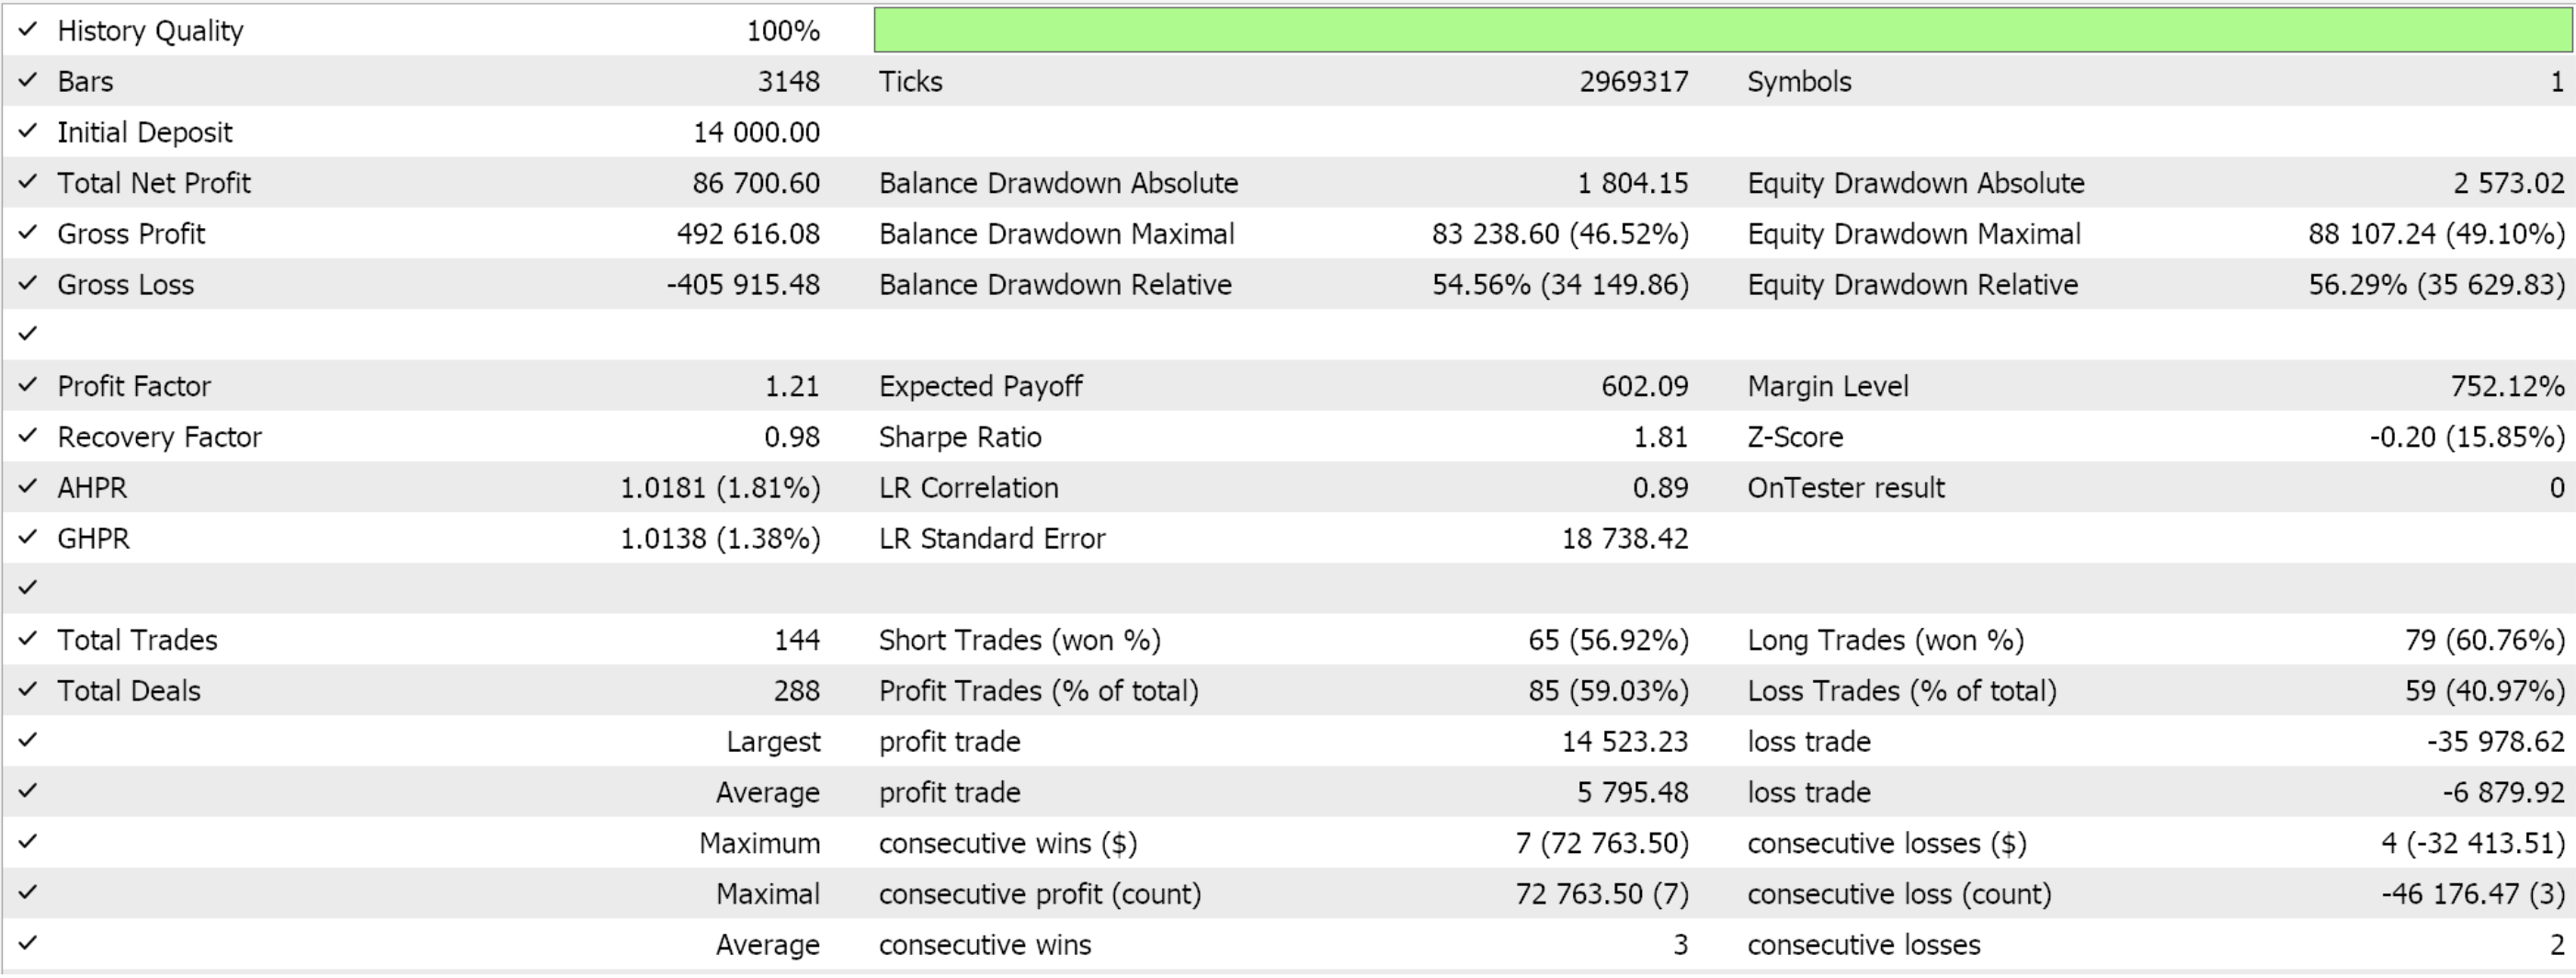
The main pros of this pattern are that it is simple to identify and interpret, can be used alongside other common indicators to enhance signal accuracy, and it tends to handle volatile markets relatively well; a setting where momentum changes can be quite common. Limitations include reduced accuracy in low-volatile non-trending settings, where it would be better to pair it with an extra indicator. Test run with favourable optimized input settings using GBP JPY over 2022 on the 4-hour do give us the following:
Divergence between Price and AO
Our pattern-3 is based on divergence. And what is divergence? Simply a deviation between an indicator reading and price action, which often signals a potential reversal or weakening of the prevalent trend. With this pattern, though, we tend to focus on the divergence between the highs/ lows of price and the AO oscillator peaks/ troughs. For this article, though, we are exploring a simpler form of divergence, that being the trends of the highs/ lows price action and the AO histogram values.
A Bullish divergence occurs when the price forms lower lows, but the AO oscillator is forming higher highs. The thesis behind this pattern goes that a weakening bearish momentum is being hinted at, and therefore there is a possible trend reversal to the upside. A possible, sharpened, entry signal could be to pick up this pattern when AO is below the zero line and wait for it to cross the zero line in order to enter a buy position.
Conversely, a bearish divergence will happen when price forms higher highs but the AO oscillator gets to lower lows, indicating waning bullish momentum in spite of the price action. This would signify a trend reversal to the downside, and a suitable entry point for the short position could be when the AO crosses below the zero-line or a secondary indicator bearish pattern is confirmed. We implement this in MQL5 as follows:
//+------------------------------------------------------------------+
//| Check for Pattern 3.                                             |
//+------------------------------------------------------------------+
bool CSignalAwesome::IsPattern_3(ENUM_POSITION_TYPE T)
{  if(T == POSITION_TYPE_BUY && Low(X() + 3) > Low(X()) && AO(X() + 3) < AO(X()))
   {  return(true);
   }
   else if(T == POSITION_TYPE_SELL && High(X() + 3) < High(X()) && AO(X() + 3) > AO(X()))
   {  return(true);
   }
   return(false);
}
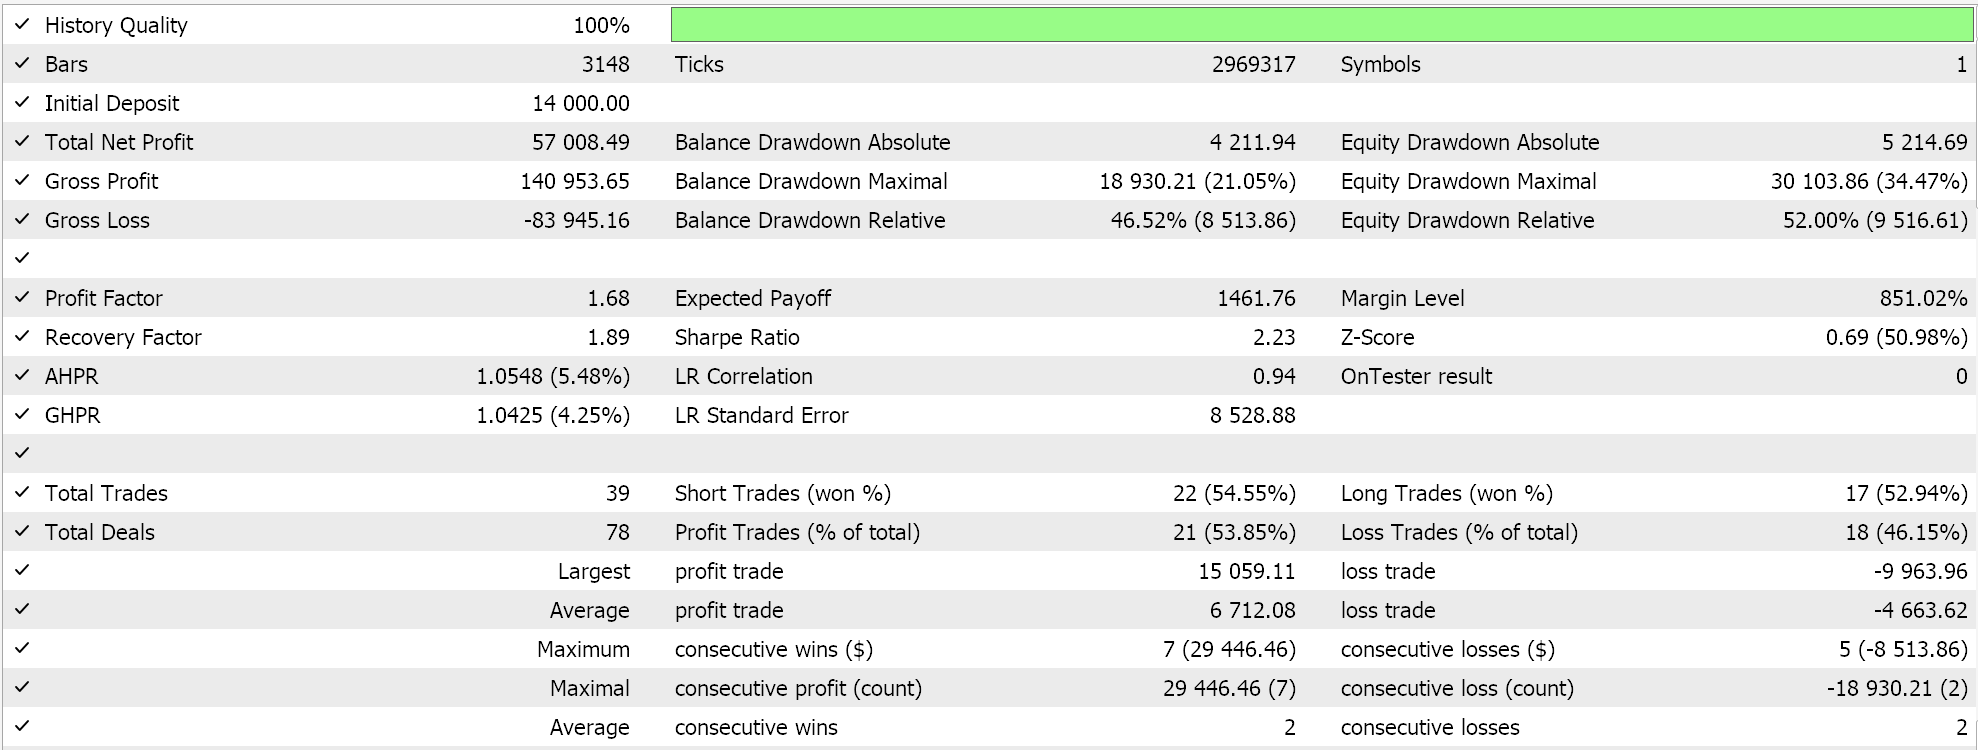
The key characteristics of this pattern are that it draws attention to changes in momentum that often precede price reversals, especially at overbought or oversold price levels. It is therefore built more for identifying potential reversals rather than price continuations. A test run with ideal settings from optimization of the same symbol and settings we’ve been using with the patterns above does give us the following report:
Its advantages are not very different from the patterns already considered in that it helps anticipate early trend changes before they occur, is versatile across various markets & time frames, and it can be paired with other indicators in confirming breakout signals. Similarly, its drawbacks are not very different given that it tends to be unreliable in sideways markets, often requires confirmation by being paired with another indicator, and it is also a laggard.
False Breakout Filtering
Our Pattern-4 is about false-breakouts, and false-breakouts are when price appears to break a major support/ resistance level but then reverses direction, arguably because it failed to maintain the momentum that took it beyond the barrier it broke in the first place. Filtering these breakouts therefore for falsehoods can on paper at least improve trade accuracy if we presuppose that momentum is a key metric in a breakthrough being sustainable.
As presented in the introduction, the AO measures momentum through comparing a short-term SMA (5-period) to a long-term SMA (34-period) when applying the median price. By therefore analysing AO values when a breakout happens, traders get to determine if it is sufficiently supported by momentum or a gap between 5-period price action and 34-period price action. We implement pattern-4 in MQL5 as follows:
//+------------------------------------------------------------------+
//| Check for Pattern 4.                                             |
//+------------------------------------------------------------------+
bool CSignalAwesome::IsPattern_4(ENUM_POSITION_TYPE T)
{  if(T == POSITION_TYPE_BUY && Close(X() + 1) < MA(X() + 1) && Close(X()) > MA(X()) && UpperColor(X() + 1) == clrGreen && UpperColor(X()) == clrGreen && AO(X() + 1) > 0.0)
   {  return(true);
   }
   else if(T == POSITION_TYPE_SELL && Close(X() + 1) > MA(X() + 1) && Close(X()) < MA(X()) && LowerColor(X() + 1) == clrRed && LowerColor(X()) == clrRed && AO(X() + 1) < 0.0)
   {  return(true);
   }
   return(false);
}
From our source, we identify a breakout as a cross of the moving average at 8-period. This moving average period should have perhaps been longer, probably 34? In order to make the support/ resistance barrier more significant, but this short period did suffice for our testing purposes. Alternative approaches at identifying the breakout do include trend lines, or chart patterns like triangles or rectangles. Any triggering of price beyond the levels defined by these indicators would clearly mark a breakout.
A further analysis of the AO at the breakout point can provide some insight on whether the breakout in play is sustainable. If the histogram size (oscillator bar graph size) is significant at breakout then it could be bankable, however short or tepid-sized histograms would often require further confirmation before a signal can be embarked on. Means of having this confirmation do include if the AO does eventually cross the zero-line, or if the histogram is already in the half that indicates momentum to the prevalent/ signal’s trend then longer or similar coloured histogram bars of the AO would need to be seen before a position is opened.
For the signal definitions, a bullish breakout is when price crosses the moving average from below it to close above it when the AO is above the zero-line and the last two bars are green in colour. On the flip side, the bearish breakout is when price crosses the moving average from above it to close below it when the AO is below the zero-line and the last 2 bars of it were red. Test results with similar symbol and settings as used above with the other patterns present us with this report:

Trend Continuation Confirmation
Pattern-5, acts as a check that ensures any given trend (whether uptrend or downtrend) is likely to persist; something which reduces the risk of opening trades before a reversal. AO can be effective in conforming trend continuation through momentum analysis. A bullish trend continuation is when the AO histogram remains green above the zero-line and the close price continues to trend higher. On the flip, the bearish trend continuation is when AO is below the zero-line, price is trending lower and the AO histograms are red. We implement this as follows in MQL5:
//+------------------------------------------------------------------+
//| Check for Pattern 5.                                             |
//+------------------------------------------------------------------+
bool CSignalAwesome::IsPattern_5(ENUM_POSITION_TYPE T)
{  if(T == POSITION_TYPE_BUY && Close(X() + 1) < Close(X()) && UpperColor(X() + 1) == clrGreen && UpperColor(X()) == clrGreen && AO(X() + 1) > 0.0)
   {  return(true);
   }
   else if(T == POSITION_TYPE_SELL && Close(X() + 1) > Close(X()) && LowerColor(X() + 1) == clrRed && LowerColor(X()) == clrRed && AO(X() + 1) < 0.0)
   {  return(true);
   }
   return(false);
}
Test runs from optimization settings of GBP JPY for the year 2022 on the 4-hour time frame do give us the following report:
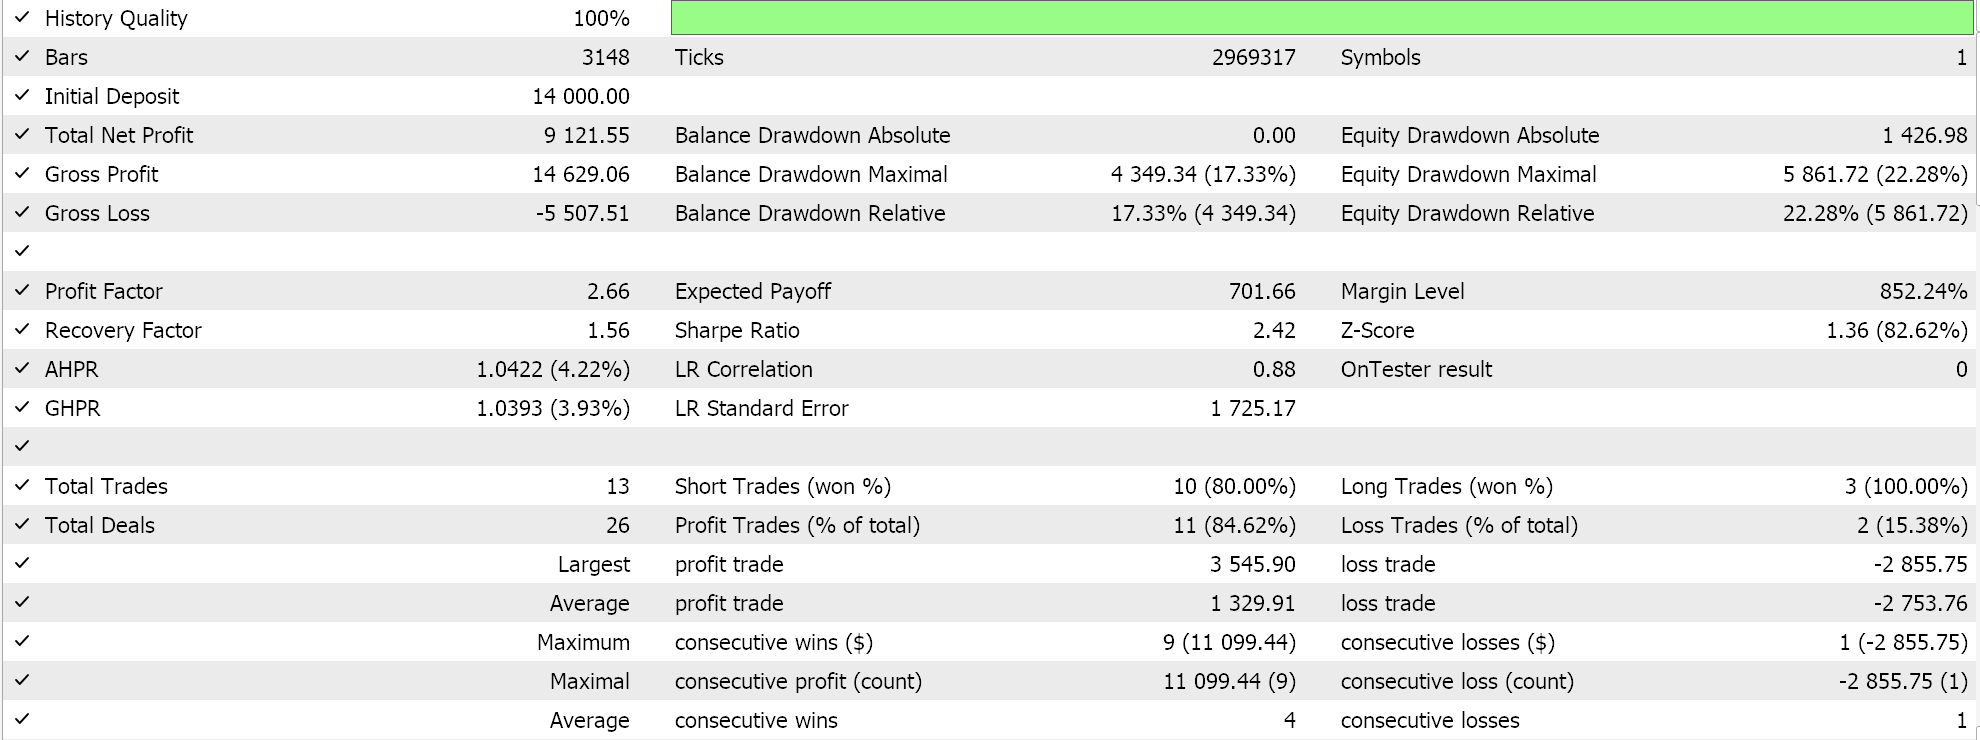
Extra patterns that can support trend continuation and can be coded to supplement what is presented above are the zero-cross line (pattern-0), or the pullback signal where a brief weakening of momentum (e.g. smaller bars) is followed by a renewed strengthening of the AO histogram bars does signify the prevalent price trend is intact, or a Twin Peaks signal that we considered above in pattern-1. The combination of these multiple patterns to place trades is something the assembled Expert Advisor can do, and we consider at the end of each indicator’s custom signal article.
However, to trade with just pattern 5, we assign our input parameter for bit map used to 32, and if we optimize with this pattern in similar strategy tester settings as above with the other patterns we get the following report from some of the favourable input settings. Being inherently momentum influenced, its pros and limitations do not vary a lot from the other patterns we have covered above.
Zero Line Bounce
Bouncing off or close to the zero-line is our pattern-6, and the premise behind this formation when the AO approaches the zero-line but fails to cross it, resuming its prior trend. The trading strategy therefore is that a bullish bounce is implied if the AO, when above the zero line, descends towards the zero-line and then retreats from it without a crossover. The bearish bounce is also when the AO is below the zero-line and swoons towards it before retreating without making a cross. We have this coded as follows for our custom signal class:
//+------------------------------------------------------------------+
//| Check for Pattern 6.                                             |
//+------------------------------------------------------------------+
bool CSignalAwesome::IsPattern_6(ENUM_POSITION_TYPE T)
{  if(T == POSITION_TYPE_BUY && AO(X() + 2) > AO(X() + 1) && AO(X() + 1) >= 0.0 && AO(X() + 1) < AO(X()))
   {  return(true);
   }
   else if(T == POSITION_TYPE_SELL && AO(X() + 2) < AO(X() + 1) && AO(X() + 1) <= 0.0 && AO(X() + 1) > AO(X()))
   {  return(true);
   }
   return(false);
}
Test run with favourable optimization settings as we have done with the other patterns above do give us the following results:
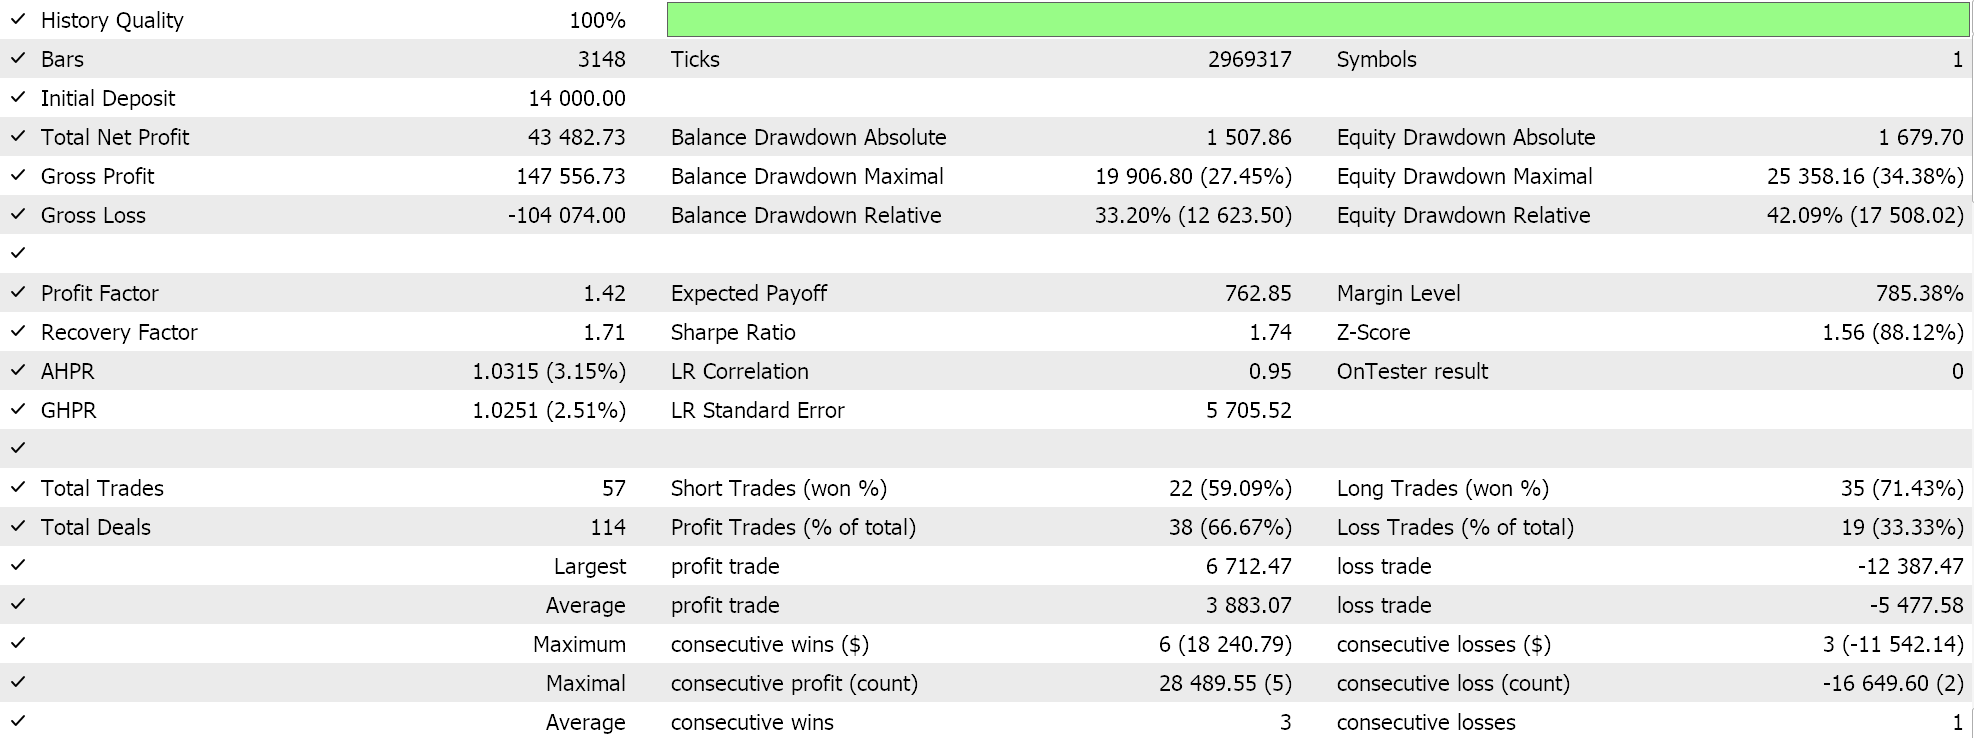
Early Reversal Warning
Our pattern-7, which is the 8th, is marked by a sudden change in colour from either green to red or vice versa. We implement colour readings from the AO as follows:
   //
   color             UpperColor(int ind)
   {  //
      return(AO(ind) >= AO(ind + 1) && AO(ind + 1) > 0.0 ? clrGreen : clrRed);
   }
   color             LowerColor(int ind)
   {  //
      return(AO(ind) <= AO(ind + 1) && AO(ind + 1) < 0.0 ? clrRed : clrGreen);
   }
These functions are in the class interface of the custom signal class and are used throughout the class and not just for this pattern. The trading strategy for pattern-7, is that a bearish to bullish transition is when AO histogram colour changes from red to green regardless of the AO position relative to the zero-line. Similarly, a bullish to bearish transition is marked by a sudden change in histogram colour from green to red again, regardless of where the AO is relative to the zero-line. We implement this as follows:
//+------------------------------------------------------------------+
//| Check for Pattern 7.                                             |
//+------------------------------------------------------------------+
bool CSignalAwesome::IsPattern_7(ENUM_POSITION_TYPE T)
{  if(T == POSITION_TYPE_BUY && ((UpperColor(X() + 1) == clrRed && UpperColor(X()) == clrGreen) || (LowerColor(X() + 1) == clrRed && LowerColor(X()) == clrGreen)))
   {  return(true);
   }
   else if(T == POSITION_TYPE_SELL && ((UpperColor(X() + 1) == clrGreen && UpperColor(X()) == clrRed) || (LowerColor(X() + 1) == clrGreen && LowerColor(X()) == clrRed)))
   {  return(true);
   }
   return(false);
}
Testing this pattern only with suitable optimization settings in conditions similar to what has been used above with other patterns with the obvious exception of the pattern's used input being assigned to 128, does give us the following report:

Strength of trend via Histogram
Our final pattern, histogram size, is indexed 8, and it aims to take the simple pattern 7 above a step further by adding a measure to AO histogram size. From our colour code implementation above, it can be seen that colour coding of AO is driven by changes to histogram size. So, and increasing histogram when above the zero-line or a decreasing bar size when the AO is below the zero, does lead to green AO bars. This in many ways is the premise of pattern-7. For pattern-8 though, a bullish momentum increase is marked by subsequent green bars (which imply increasing/ or relevant decreasing) and the most recent AO histogram bar being more than 8 times the security spread. The use of 8 times the spread is an arbitrary choice. Typically, an optimized input parameter could better hone what this threshold should be, or some fraction of the current volatility could also be used. A bearish momentum increase is the flip of this. We implement this in MQL as follows:
//+------------------------------------------------------------------+
//| Check for Pattern 8.                                             |
//+------------------------------------------------------------------+
bool CSignalAwesome::IsPattern_8(ENUM_POSITION_TYPE T)
{  if(T == POSITION_TYPE_BUY && AO(X() + 2) > 0.0 && fabs(AO(X() + 2)) >= 8.0 * m_symbol.Spread()*m_symbol.Point() && UpperColor(X() + 2) == clrGreen && UpperColor(X() + 1) == clrGreen && UpperColor(X()) == clrGreen)
   {  return(true);
   }
   else if(T == POSITION_TYPE_SELL && AO(X() + 2) < 0.0 && fabs(AO(X() + 2)) >= 8.0 * m_symbol.Spread()*m_symbol.Point() && LowerColor(X() + 2) == clrRed && LowerColor(X() + 1) == clrRed && LowerColor(X()) == clrRed)
   {  return(true);
   }
   return(false);
}
The primary thesis here is that smaller bars (whether green or red) do suggest a weakening trend and therefore a consolidation period, while a longer, more prominent histogram does suggest strong momentum and a prevalent trend has some staying power. A test run for just this pattern gives us the following report:
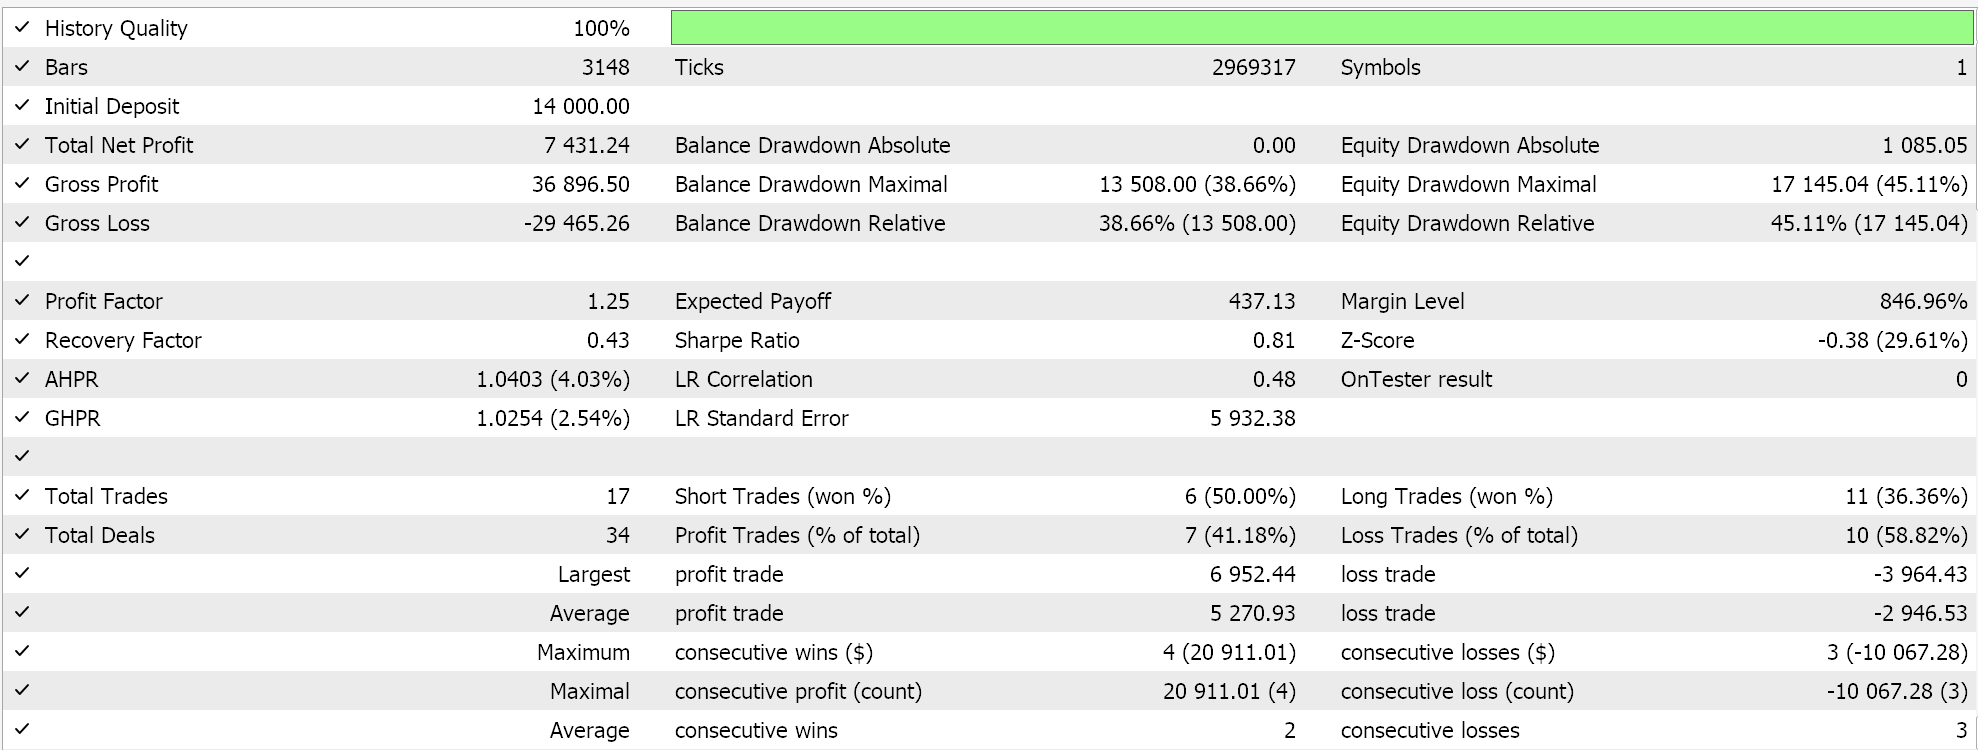
Our custom signal class can also trade across multiple patterns and if we perform optimizations for the suitable pattern weights with GBP JPY in the same year and time frame as with the individual pattern runs, we get the following results:
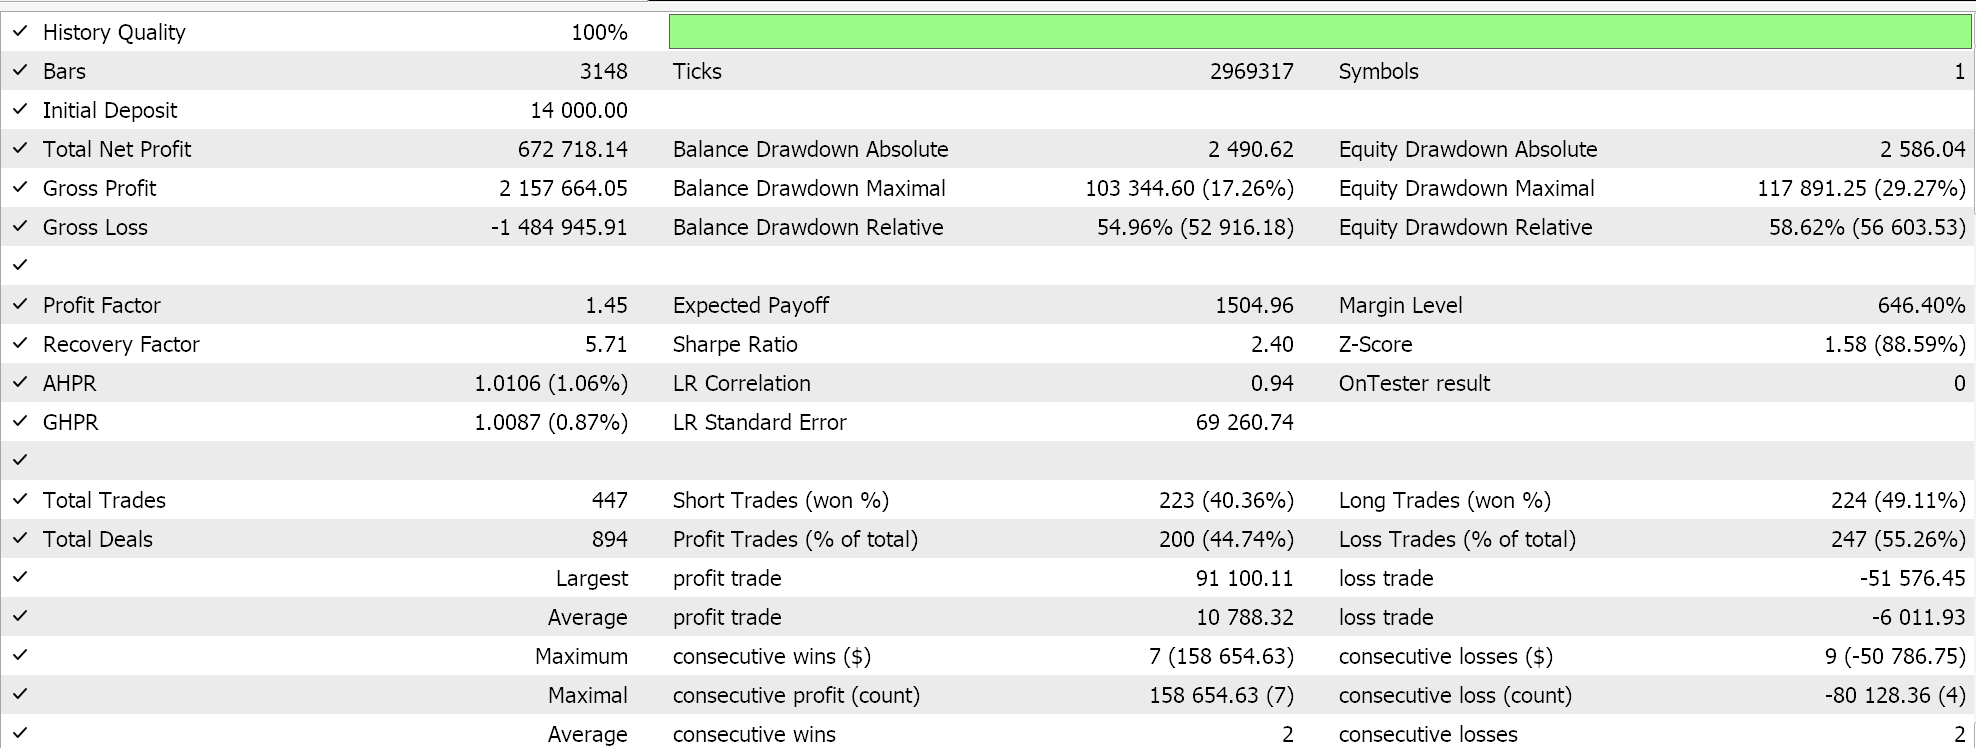
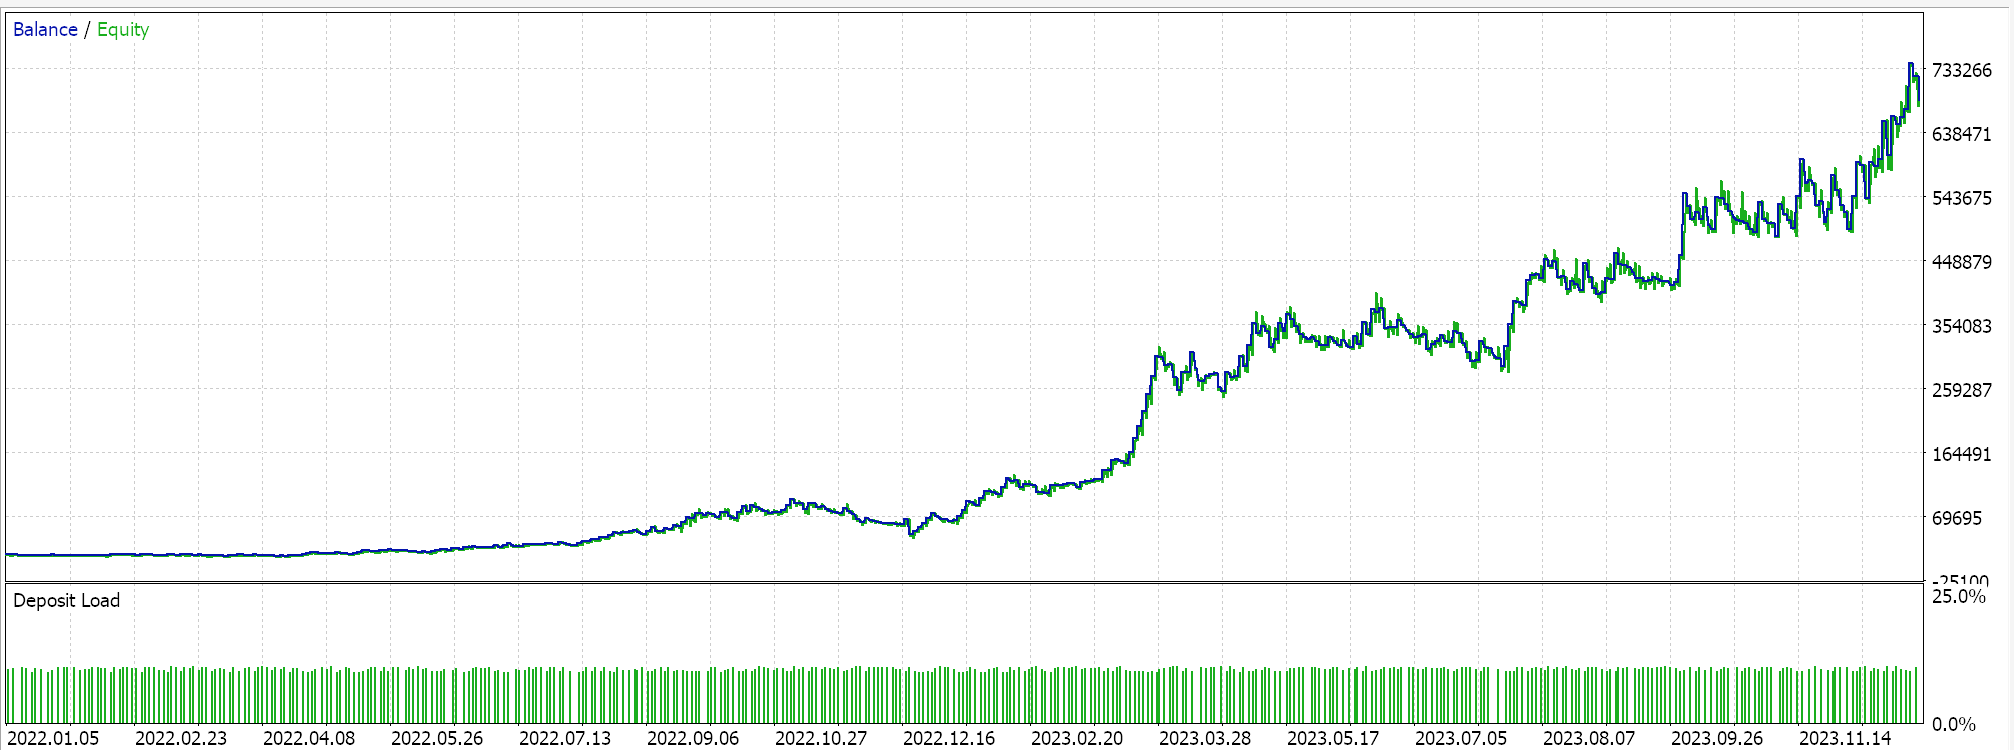
Conclusion
We have considered another Bill Williams indicator, the Awesome Oscillator, on a pattern-by-pattern basis, as we did with previous indicators. There are a number of implementations and aspects we have not looked at coding these patterns, such as adding more input parameters to better manage the threshold of each pattern and of course properly cross validating any favoured input parameters before use. This, as always is, left to the reader since our complete source code is attached at the bottom of the article.
| File Name | Description |
|---|---|
| SignalWZ_50.mqh | Custom Signal Class File, based on the Awesom Oscillator |
| wz_50.mq5 | Sample of Wizard Assembled Expert Advisor, showing included/ used files |
Warning: All rights to these materials are reserved by MetaQuotes Ltd. Copying or reprinting of these materials in whole or in part is prohibited.
This article was written by a user of the site and reflects their personal views. MetaQuotes Ltd is not responsible for the accuracy of the information presented, nor for any consequences resulting from the use of the solutions, strategies or recommendations described.
 Price Action Analysis Toolkit Development (Part 3): Analytics Master — EA
 Trading with the MQL5 Economic Calendar (Part 3): Adding Currency, Importance, and Time Filters
 Generative Adversarial Networks (GANs) for Synthetic Data in Financial Modeling (Part 1): Introduction to GANs and Synthetic Data in Financial Modeling
 Neural Networks Made Easy (Part 94): Optimizing the Input Sequence
- Free trading apps
- Over 8,000 signals for copying
- Economic news for exploring financial markets
You agree to website policy and terms of use