
Price Action Analysis Toolkit Development (Part 54): Filtering Trends with EMA and Smoothed Price Action

Contents
- Introduction
- Strategy Mechanics
- Implementation
- Core Functions Breakdown
- Deployment Guide
- Testing
- Conclusion
Introduction
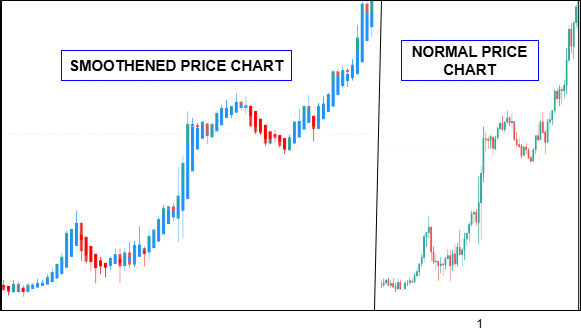
For decades, traders have sought methods to filter market noise and focus on genuine price movement. The Heikin‑Ashi technique, in particular, has stood out for its ability to smooth candles, making trends clearer and short‑term volatility less distracting. In simple terms, Heikin-Ashi acts like a clear roadmap from point A to point B, smoothing out price noise so the overall direction is easier to follow. In earlier work, I examined a price action analysis system built entirely on Heikin‑Ashi, which delivered clean entries and recognizable patterns. However, experience showed that such a singular approach can be vulnerable in certain market conditions, where strong bullish or bearish candles misrepresent the underlying trend.
To address this limitation, I integrated exponential moving averages (EMAs) to enhance signal reliability. EMA20 on high and low prices helps define short‑term boundaries, while EMA50 on closing prices provides a broader directional filter. When Heikin‑Ashi signals align with these EMA measures, false positives are greatly reduced and trade entries become more disciplined. This combination retains the visual clarity that makes Heikin‑Ashi appealing while adding quantitative structure, creating a balanced methodology that strengthens decision‑making and confirms trend direction.
In the sections that follow, we will look at the system mechanics, followed by implementation in MQL5, a breakdown of core functions, a deployment guide, testing procedures, and finally, the conclusion.
Strategy Mechanics
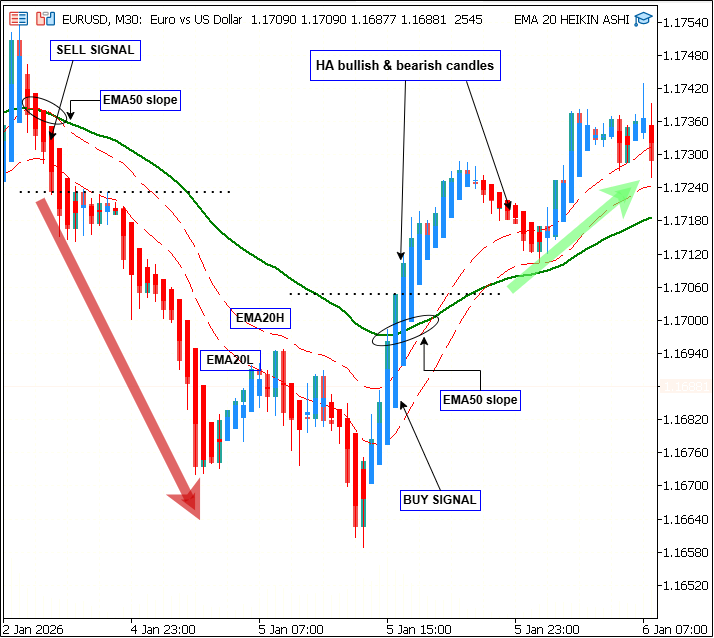
In volatile or transitional market phases, candlestick charts often display large bullish or bearish bars that suggest strong momentum but are in fact the result of short‑term fluctuations. These misleading signals frequently appear during shallow retracements or low‑volume sessions, when price briefly moves above or below recent ranges without a true change in underlying trend. Acting on them can mean buying into the tail end of a correction or selling just before the market resumes climbing, scenarios that produce whipsaws and erode trading consistency.
This system was developed to prevent those false positives. It combines Heikin‑Ashi smoothing with exponential moving average filtering so that visually strong candles are traded only when they align with measurable momentum. The Heikin‑Ashi layer recalculates each bar from averaged OHLC values, producing a chart where colors follow sustained trends and change only at genuine reversals. This offers a cleaner directional picture than conventional candlesticks, easing identification of the prevailing bias.
To guard against the situations where Heikin‑Ashi can mislead, such as a single bullish candle in the middle of a downtrend, the strategy adds a second layer of validation. EMA50 calculated on closing prices defines the broad directional context, with its slope providing a quick, numerical measure of trend strength. A pair of EMA20 lines, calculated on highs and lows, frames recent price extremes. Before a Heikin‑Ashi signal is accepted, it must break beyond these EMA20 boundaries and agree with the EMA50 slope. If either condition fails, the setup is ignored.
By enforcing agreement between smoothed visual signals and structural trend metrics, the mechanics ensure that trades are taken when short‑term momentum, long‑term bias, and candle structure all point in the same direction. This reduces exposure to noise, preserves the clarity that makes Heikin‑Ashi appealing, and integrates disciplined quantitative checks into an otherwise visual method.
Detailed Heikin‑Ashi computation
The Heikin‑Ashi technique modifies the standard OHLC candlestick calculation to produce smoothed values that filter out small fluctuations. Instead of plotting the raw open, high, low, and close of each period, the system uses averaged values.
Below is the Heikin-Ashi standard formula.
Heikin-Ashi Close
![]()
![]()
![]()
![]()
- HA_Close: Takes the mean of the real candle’s open, high, low, and close, giving an average closing level for that period.
- HA_Open: Uses the average of the previous HA candle’s open and close, tying each new open to the smoothed values of the last bar.
- HA_High / HA_Low: Reflect the highest and lowest points between the smoothed open/close and the actual high/low of the real candle.
Color logic (trend bias)
Bullish HA candle: (HA Close > HA Open)- Depicted in green (or trader’s preferred bullish color).
- Depicted in red (or trader’s preferred bearish color).
Because each new open references the smoothed figures of the previous candle, abrupt changes in raw price have less immediate impact—resulting in longer runs of same‑color candles during trends and reduced erratic switching during minor consolidations.
While this characteristic helps traders ride trends with more confidence, it also introduces a small amount of lag. Because each candle’s values are averaged, reversals tend to be confirmed later than they would on a standard candlestick chart. In strong trends, this delay is beneficial, keeping traders in profitable positions longer. But in complex or range‑bound markets, the smoothing can obscure early signs of change, leading to entries or exits that are slightly mistimed. This is where an additional analytical layer becomes essential, something that can validate or challenge what the Heikin‑Ashi chart appears to suggest. So in this case, that's why we have fused with exponential moving averages.
EMA calculation settings
EMAs are designed to capture the average price over a specific period while giving more weight to recent data, resulting in a measure that is responsive yet steady. The calculation applies a multiplier that prioritizes new prices, generating a line that can track the shifting balance between short‑term momentum and longer‑term trends. Traders commonly use EMAs to define dynamic levels of support and resistance, assess the current trend direction, and spot points where momentum is accelerating or fading. Comparing EMAs of different periods allows one to gauge the strength and stability of a trend: for example, a rising 50‑period EMA signals sustained bullish momentum, while a falling one defines the opposite. This strategy uses three exponential moving averages.
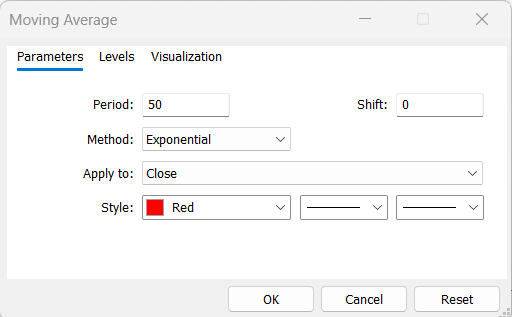
- EMA50 on closing prices: the long‑term trend filter
ema50 = iMA(_Symbol, WorkTF, 50, 0, MODE_EMA, PRICE_CLOSE);
Measures trend bias by slope over time. Smooth enough to ignore small fluctuations, responsive enough for daily/short‑term trend shifts. Rather than relying solely on price crossing EMA50, the system measures the slope (directional change) between the latest EMA50 value and the previous candle’s EMA50 value.
trendBull = (ema50_current > ema50_previous);
trendBear = (ema50_current < ema50_previous);
- 1) If the current EMA50 > previous EMA50, the average is rising, market bias is bullish.
- 2) If the current EMA50 < previous EMA50, the average is falling, market bias is bearish.
Crossovers can happen in sideways markets when price drifts across the EMA without sustaining momentum. Slope analysis keeps the trade direction aligned with actual trend acceleration or deceleration, filtering out signals during flat averages.
- EMA20 on high prices: upper short‑term boundary.
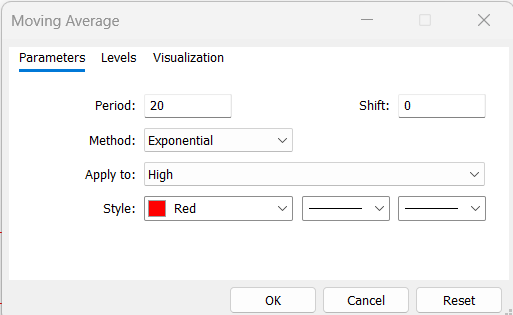
ema20_high = iMA(_Symbol, WorkTF, 20, 0, MODE_EMA, PRICE_HIGH);
Captures the averaged high extreme of recent bars; a HA close above this suggests notable upward force.
- EMA20 on low prices: lower short‑term boundary.
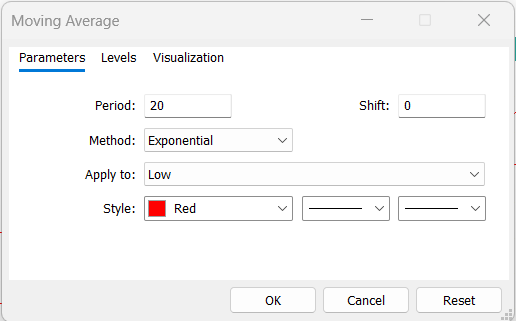
ema20_low = iMA(_Symbol, WorkTF, 20, 0, MODE_EMA, PRICE_LOW);
Captures the averaged low extreme; an HA close below this suggests notable downward force.
A 20‑period exponential moving average responds quickly to brief surges or drops in momentum, capturing the market’s short‑term fluctuations. When calculated separately on highs and lows, the two lines form an adaptive envelope around price that defines the immediate trading range. In contrast, the 50‑period EMA reacts more slowly, filtering out transient noise and providing a steadier view of the prevailing long‑term direction.
Signal Rules
Buy Signals
1) Smoothed candle closes above EMA20 High
- (HA Close > EMA20 High): price breaks above the short‑term upper boundary.
2) HA candle is bullish
- (HA Close > HA Open): candle body points upward.
3) Smoothed close above EMA50
- (HA Close > EMA50 Close): price is above the long‑term trend filter.
4) EMA50 slope is positive
- (EMA50 current > EMA50 previous): the long‑term trend line is rising.
5) Previous HA close was below EMA50: confirms a breakout context (price has crossed from below to above the trend line).
Sell signals
1) Smoothed candle closes below EMA20 Low- (HA Close < EMA20 Low): price drops under the short‑term lower boundary.
- (HA Close < HA Open): candle body points downward.
- (HA Close < EMA50 Close): price sits under the long‑term trend filter.
- (EMA50 current < EMA50 previous): the long‑term trend line is falling.
Accepted Buy
- A bullish Heikin‑Ashi candle closes above the EMA20 High, and the EMA50 is sloping upward. The previous HA close was below EMA50, with the current bar breaking above it, confirming upward momentum.
Rejected Buy
- A bullish HA candle closes above the EMA20 High, but the EMA50 slope is flat or negative. The lack of broad trend alignment leads to rejection of the signal.
Accepted Sell
- A bearish Heikin‑Ashi candle closes below the EMA20 Low, and the EMA50 is sloping downward. The previous HA close was above EMA50, with the current bar breaking below it, confirming downward momentum.
Rejected Sell
- A bearish HA candle closes below EMA20 Low, but the EMA50 slope is positive. Because the broader trend is up, the signal is discarded.
Visuals and Alerts
Buy arrows are displayed in green (or lime) and plotted at a distance defined by ArrowOffsetPoints below the low of the signal candle, while sell arrows are shown in red and positioned the same offset above the candle’s high. This placement prevents overlap with price bars and maintains chart clarity. Each arrow is named with a specific prefix, such as “EMA20HA_BUY_,” and includes a timestamp to ensure duplicate signals on the same candle are avoided. When a valid signal occurs, the EA generates an alert message containing the symbol and signal type, with the option to extend notifications to push or email outputs according to trader preference.
Implementation
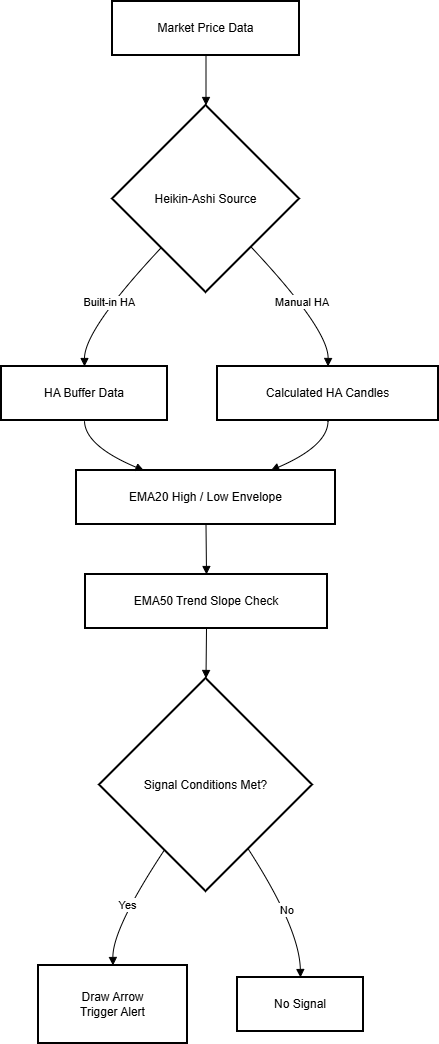
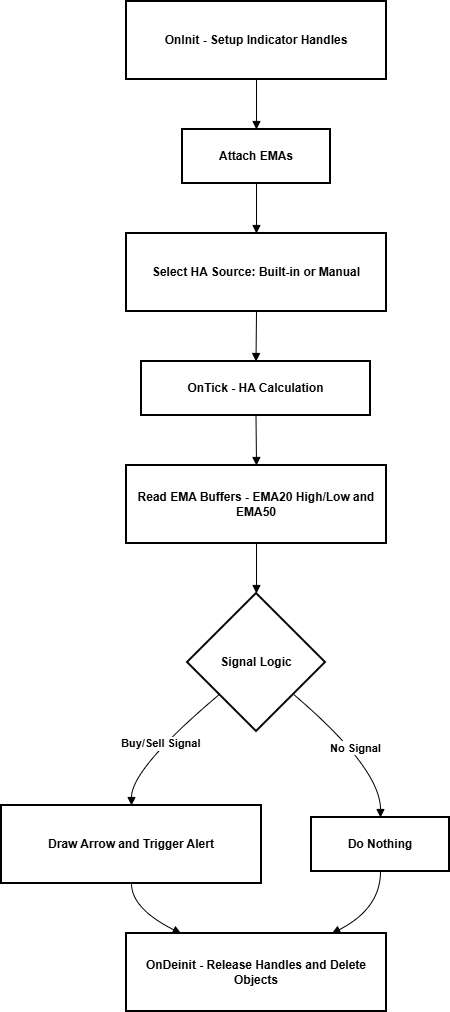
The Expert Advisor is structured to run reliably both in live trading and within the Strategy Tester, ensuring identical logic across environments. Its architecture separates operational responsibilities into distinct modules: initialization, indicator management, signal analysis, and visual output. This modular design simplifies debugging, enhances clarity, and allows components to adapt dynamically to runtime conditions.
The diagram below illustrates the EA’s workflow, from initialization through Heikin‑Ashi calculation, EMA filtering, and signal validation to arrow plotting and alerts.
Indicator Initialization
At startup, the system obtains indicator handles for the three exponential moving averages used in analysis. Each handle is verified to ensure successful creation before execution continues.
handleEMA50  = iMA(_Symbol, WorkTF, 50, 0, MODE_EMA, PRICE_CLOSE);
handleEMA20H = iMA(_Symbol, WorkTF, 20, 0, MODE_EMA, PRICE_HIGH);
handleEMA20L = iMA(_Symbol, WorkTF, 20, 0, MODE_EMA, PRICE_LOW);
Handle checks are vital in preventing partial loads that could distort test results. If any call fails, the EA exits with INIT_FAILED, ensuring that calculations are never performed on incomplete data. The same handles are released on deinitialization usingIndicatorRelease() to free system resources.
- Each candle is checked.
if(handleEMA50 == INVALID_HANDLE || handleEMA20H == INVALID_HANDLE || handleEMA20L == INVALID_HANDLE)
   return(INIT_FAILED);
- Handles are released on exit.
IndicatorRelease(handleEMA50);
IndicatorRelease(handleEMA20H);
IndicatorRelease(handleEMA20L);
Dual‑Mode Candle Handling
Because the built‑in Heikin‑Ashi indicator may not always draw within the tester environment, the EA includes a redundant drawing mechanism. When a built‑in call succeeds, its buffers are used for data retrieval.
double haOpen = (prevHAopen + prevHAclose) / 2.0;
double haClose = (open[i] + high[i] + low[i] + close[i]) / 4.0;
double haHigh = MathMax(high[i], MathMax(haOpen, haClose));
double haLow  = MathMin(low[i],  MathMin(haOpen, haClose));
If it fails or if tester mode is detected, a custom function constructs each candle manually using Heikin‑Ashi formulas. These are rendered on the chart through rectangle objects whose colours correspond to candle bias. This dual‑mode approach guarantees that both environments display identical visual information and analytical output.
ObjectCreate(0, name, OBJ_RECTANGLE, 0, t1, haHigh, t2, haLow);
ObjectSetInteger(0, name, OBJPROP_COLOR, (haClose > haOpen) ? clrLime : clrRed);
Chart Object Management
All chart objects—arrows, rectangles, and labels—follow strict naming conventions. Each is created with a predefined prefix indicating its role and signal type.
string arrowName = "EMA20HA_BUY_" + IntegerToString(TimeCurrent());
Functions such as DeleteObjectsByPrefix() allow targeted removal of expired or redundant objects without touching unrelated chart elements.
DeleteObjectsByPrefix("EMA20HA_", OBJ_ARROW);
This disciplined housekeeping prevents clutter during extended testing sessions and ensures that new signals remain clearly visible.
Signal Control and De‑duplication
The engine employs timestamp tracking to avoid generating repeated alerts or drawings for the same candle. Each signal event records its time and type; subsequent checks compare the current conditions to the stored values before creating a new arrow or alert.
if(lastSignalTime == Time[0] && lastSignalType == currentSignal)
   return; // skip duplicate
If a match is found, the operation is skipped. This lightweight control prevents excessive visual output and avoids confusing users during fast‑moving markets or rapid updates in simulation.
Trend Validation Routine
During each tick, the EA calculates current and previous EMA50 values to determine overall directional slope. This assessment is performed before any short‑term checks, allowing the program to reject signals that oppose the prevailing trend. The sequence follows a strict hierarchy:
- Evaluate EMA50 slope—define trend context.
- Retrieve HA and EMA20 data—assess short‑term pressure.
- Validate combination—trigger or reject signal.
bool trendBull = ema50_current > ema50_previous;
bool trendBear = ema50_current < ema50_previous;
This layered evaluation mirrors the logic described in the Mechanics section, ensuring both consistency and computational efficiency.
Visualization Management
After confirmation of a valid signal, graphical elements are drawn precisely once per candle. Arrows are placed using the predefined offset so they remain legible above or below the chart, and their names include the symbol and candle time to keep them unique.
double arrowPrice = High[0] + (ArrowOffsetPoints * _Point);
ObjectCreate(0, arrowName, OBJ_ARROW, 0, Time[0], arrowPrice);
ObjectSetInteger(0, arrowName, OBJPROP_COLOR, clrLime);
Manual Heikin‑Ashi candles, if in use, are refreshed only on new bars to limit processor load. The balance between responsiveness and efficiency keeps the interface clean even when multiple instruments are monitored simultaneously.
DeleteObjectsByPrefix("EMA20HA_", OBJ_ARROW);
Resource Handling and Exit Routine
Upon deinitialization, all indicator handles are released, and every object carrying the EA’s naming prefixes is deleted. These measures prevent gradual memory consumption that could otherwise occur during prolonged operation. The design philosophy is simple: indicators do the heavy lifting during runtime, and the chart remains lightweight once the program is removed.
IndicatorRelease(handleEMA50);
IndicatorRelease(handleEMA20H);
IndicatorRelease(handleEMA20L);
DeleteObjectsByPrefix("EMA20HA_", OBJ_ARROW);
DeleteObjectsByPrefix("EMA20HA_", OBJ_RECTANGLE);
Core Functions Breakdown
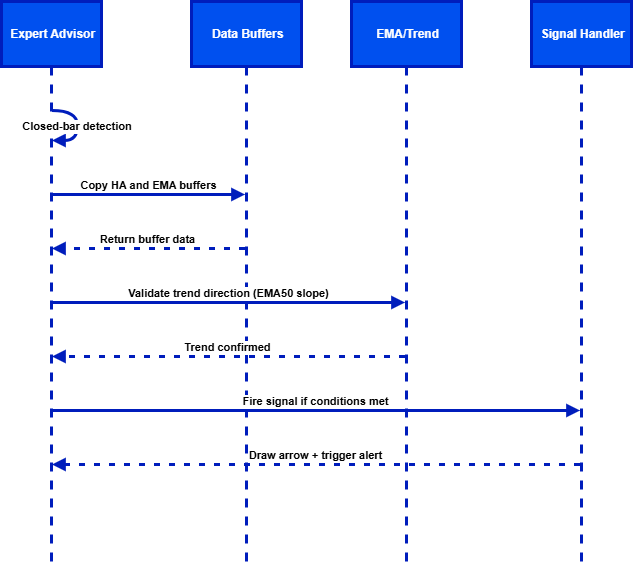
The diagram above outlines the EA’s internal process flow—from closed‑bar detection and buffer handling through EMA trend validation to final signal firing, arrow plotting, and alert generation.
OnInit()—Initialization Routine
The initialization function is responsible for setting up the core indicators and preparing the chart environment. When the Expert Advisor loads, it creates three indicator handles—one for the EMA50 calculated on closing prices and two for EMA20 calculated separately on high and low prices. Each handle is then validated to ensure it was created successfully; invalid handles could lead to calculation errors or runtime exceptions. Before returning a success status, the function also clears any residual chart objects related to previous runs, guaranteeing that signals and visuals start fresh.
int OnInit()
{
   // Load EMA indicators
   handleEMA50  = iMA(_Symbol, WorkTF, 50, 0, MODE_EMA, PRICE_CLOSE);
   handleEMA20H = iMA(_Symbol, WorkTF, 20, 0, MODE_EMA, PRICE_HIGH);
   handleEMA20L = iMA(_Symbol, WorkTF, 20, 0, MODE_EMA, PRICE_LOW);

   // Check handles
   if(handleEMA50 == INVALID_HANDLE || handleEMA20H == INVALID_HANDLE || handleEMA20L == INVALID_HANDLE)
   {
      Print("Failed to create EMA handles");
      return(INIT_FAILED);
   }

   // Remove any old objects from chart
   DeleteObjectsByPrefix("EMA20HA_", OBJ_ARROW);
   DeleteObjectsByPrefix("EMA20HA_", OBJ_RECTANGLE);

   return(INIT_SUCCEEDED);
}
OnTick()—Main Execution Loop
This function executes on each market tick, handling data updates, verifying trade conditions, and drawing signal outputs. It begins by retrieving the current and previous values of EMA50, alongside the most recent EMA20 High and EMA20 Low readings. Using these data points, it then generates the current Heikin‑Ashi candle structure and determines the prevailing trend direction by comparing the slope of EMA50. Finally, it evaluates buy and sell signals using dedicated condition functions, triggering visual outputs when conditions are met.
void OnTick()
{
   // Get latest indicator values
   double ema50_current = CopyBufferValue(handleEMA50, 0);
   double ema50_previous = CopyBufferValue(handleEMA50, 1);
   double ema20_high = CopyBufferValue(handleEMA20H, 0);
   double ema20_low  = CopyBufferValue(handleEMA20L, 0);

   // Compute current Heikin-Ashi candle
   HA_Candle ha = GetHeikinAshiCandle(0);

   // Validate trends
   bool trendBull = ema50_current > ema50_previous;
   bool trendBear = ema50_current < ema50_previous;

   // Signal detection
   if(IsBuySignal(ha, ema20_high, ema50_current, trendBull))
      PlaceSignalArrow(true);

   if(IsSellSignal(ha, ema20_low, ema50_current, trendBear))
      PlaceSignalArrow(false);
}
GetHeikinAshiCandle()—HA Calculation Utility
This helper function produces the smoothed candle data for a given shift in history. It calculates the HA close as the average of the raw OHLC values, then calculates the HA open as the average of the previous HA open and close. The high and low are determined by comparing smoothed values with raw extremes. A boolean flag indicates whether the candle is bullish or bearish based on the relationship between HA close and HA open.
HA_Candle GetHeikinAshiCandle(int shift)
{
   HA_Candle ha;
   ha.close = (Open[shift] + High[shift] + Low[shift] + Close[shift]) / 4.0;
   double prev_ha_open = (Open[shift+1] + Close[shift+1]) / 2.0;
   ha.open  = (prev_ha_open + ha.close) / 2.0;
   ha.high  = MathMax(High[shift], MathMax(ha.open, ha.close));
   ha.low   = MathMin(Low[shift], MathMin(ha.open, ha.close));
   ha.isBull = ha.close > ha.open;
   return(ha);
}
IsBuySignal()—Buy Condition Check
The buy signal function evaluates whether the current HA candle meets all criteria for a long trade. It checks for a bullish candle, a close above the EMA20 High, a close above EMA50, and a positive trend slope on EMA50. If any of these conditions fail, the function returns false; otherwise, it returns true to indicate a valid buy setup.
bool IsBuySignal(HA_Candle ha, double ema20_high, double ema50, bool trendBull)
{
   if(!ha.isBull) return(false);
   if(ha.close <= ema20_high) return(false);
   if(ha.close <= ema50) return(false);
   if(!trendBull) return(false);
   return(true);
}
PlaceSignalArrow()—Visual Output
This function handles chart visualization for valid trade signals. It calculates an arrow’s placement offset below the low for buys or above the high for sells, assigns a color depending on trade type, creates the object, and ensures uniqueness by embedding the timestamp in the arrow’s name.
void PlaceSignalArrow(bool isBuy)
{
   double price = isBuy ? (High[0] + ArrowOffsetPoints * _Point) : (Low[0] - ArrowOffsetPoints * _Point);
   string name  = isBuy ? "EMA20HA_BUY_" + IntegerToString(Time[0]) : "EMA20HA_SELL_" + IntegerToString(Time[0]);
   int color    = isBuy ? clrLime : clrRed;

   ObjectCreate(0, name, OBJ_ARROW, 0, Time[0], price);
   ObjectSetInteger(0, name, OBJPROP_COLOR, color);
}
DeleteObjectsByPrefix()—Chart Clean-Up
To prevent clutter and manage resources, this utility function removes any chart object that begins with a given prefix and matches the specified type. It is called during initialization and de‑initialization to maintain a clean workspace.
void DeleteObjectsByPrefix(string prefix, ENUM_OBJECT type)
{
   for(int i = ObjectsTotal()-1; i >= 0; i--)
   {
      string name = ObjectName(i);
      if(StringFind(name, prefix) == 0 && ObjectType(name) == type)
         ObjectDelete(0, name);
   }
}
Deployment Guide
To implement the strategy, copy the .mq5 source file into the terminal’s Experts folder and compile it in MetaEditor using F7. Once compilation is successful, open a chart of the preferred symbol and timeframe, then drag the EA from the Navigator—Expert Advisors panel onto the chart. Ensure Algo Trading is enabled so signals can be processed on new bars.
The gif below demonstrates creating the EA in MetaEditor and compiling it successfully for use in MetaTrader.
Before running, verify that your terminal has historical data for the chosen timeframe; Heikin‑Ashi and EMA calculations require complete series data. After attaching, check the Experts tab; a successful initialization message confirms readiness.
Typical parameters include
input ENUM_TIMEFRAMES WorkTF = PERIOD_M15;
input int ArrowOffsetPoints  = 50;
input bool EnableAlerts      = true;
These control timeframe selection, arrow‑placement offset, and alert behavior. Adjust them as needed for volatility and chart readability. For reliability, test the EA in Strategy Tester visual mode before moving to live operation. Once performance and visuals are verified, apply the same settings to a demo or live account.
After compiling and attaching the EA, you can test it in live charts or in Strategy Tester. If you normally use MetaTrader’s built‑in Heikin‑Ashi indicator, be aware that in backtesting you do not need to attach it. The EA calculates and plots its own HA‑smoothed candles directly on the chart during testing. This ensures you’ll see the same HA structure whether the built‑in indicator is on or off. For clarity, you may run two quick visual tests.
- Backtest with the built‑in HA disabled, you will still see HA candles generated by the EA.
input bool UseBuiltInHA = false;
- Backtest with built‑in HA enabled, the chart will show both, but the EA’s version is the one used for signals.
input bool UseBuiltInHA = true;
This helps confirm that the visual output comes from the EA’s internal calculations, not from the platform’s default indicator.
Testing
Initial backtests and demo/live observations suggest that the Heikin-Ashi EMA Fusion approach behaves consistently under different market conditions. The layered filter design generated more selective signals, generally aligning with sustained price movement rather than short-term volatility. The visual output makes signal conditions easy to verify on the chart.
Live chart outcome on demo account.
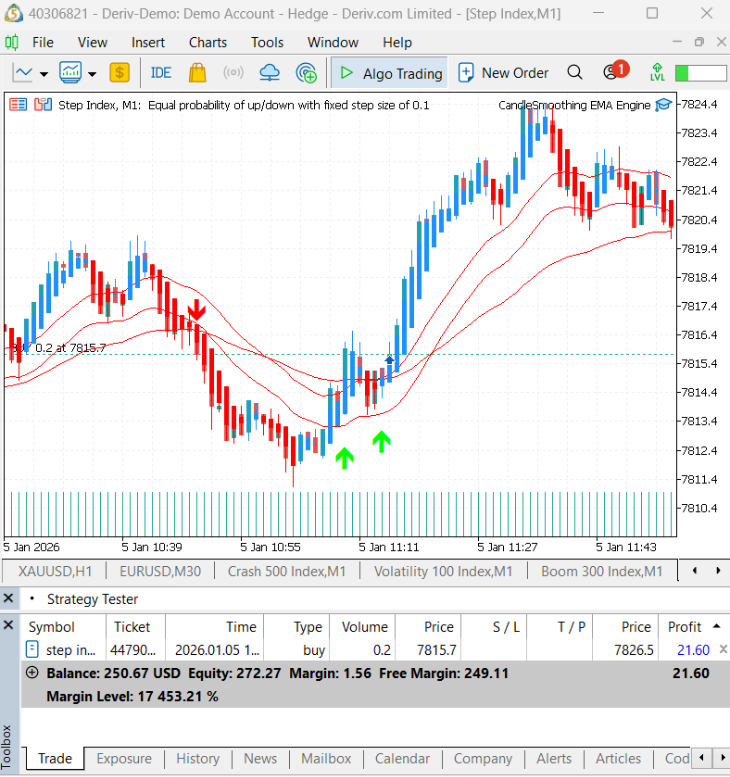
In visual backtesting mode, CandleSmoothing EMA Engine.mq5draws its own Heikin-Ashi-smoothed candles directly on the chart. It does not rely on the platform’s built-in Heikin-Ashi indicator. These candles are shown together with the EMA20 high and low boundaries and the EMA50 trend filter line. This makes it easier to see the overall market structure at a glance.
When a trade setup is confirmed, the indicator places an arrow on the chart. Green arrows mark buy signals, while red arrows mark sell signals. The arrows are positioned slightly above or below the candle so they remain easy to see. Each signal is also written to the Experts tab, including the symbol, time, and trade direction. This allows traders to check the chart signals against the actual calculation logic. This H1 backtest example shows how the multi-layer filter removes many false signals. The result is fewer trades, but entries that are more reliable and better aligned with the current market momentum.
During both backtests and live runs, the EA adjusted its signal frequency as market conditions changed. In strong trends, signals were generated only when price broke out of the short-term EMA20 channel and the EMA50 slope confirmed the direction. This helped avoid trades during weak counter-trend pullbacks. Alerts were printed immediately after a bar closed, and arrows were drawn only once per signal, with no duplicates. This confirms that the closed-bar processing logic and the lastSignalType safeguard are working as intended. Overall testing shows that the expert advisor performs reliably across commodities, synthetic indices, and forex pairs.
Conclusion
The development and early testing of the Candle Smoothing EMA Signal EA suggest that using multiple filters helps solve many of the weaknesses seen in Heikin-Ashi-only strategies. In my tests, combining the EMA20 high and low boundaries with an EMA50 trend check resulted in fewer and cleaner signals that stayed more consistent with the overall market direction.
Both backtests and demo or live runs show that the EA reduces noise-driven reversals and false signals. Testing was carried out across multiple instruments and timeframes. Full details, including symbols, timeframes, date ranges, tick model, and spread settings, are provided in the Backtesting section to support reproducibility.
With clear chart arrows, EMA overlays, and alerts generated at bar close, the EA is intended as a practical, signal-only tool that adds confirmation to a trader’s workflow. It is not an automated money-management system. Users should run their own tests and apply proper risk management. Past performance does not guarantee future results.
Warning: All rights to these materials are reserved by MetaQuotes Ltd. Copying or reprinting of these materials in whole or in part is prohibited.
This article was written by a user of the site and reflects their personal views. MetaQuotes Ltd is not responsible for the accuracy of the information presented, nor for any consequences resulting from the use of the solutions, strategies or recommendations described.

- Free trading apps
- Over 8,000 signals for copying
- Economic news for exploring financial markets
You agree to website policy and terms of use