MQL5 Wizard Techniques you should know (Part 67): Using Patterns of TRIX and the Williams Percent Range
Introduction
We continue our series on studying signal patterns generated by pairing technical indicators. Last time, we looked at the fractal adaptive moving average when paired with the force index oscillator. For this article, we are looking at the Triple Exponential Moving Average Oscillator (TRIX) when paired with another oscillator, the Williams Percent Range (WPR). TRIX being a moving average oscillator is a trend signalling indicator, while the Williams Percent Range acts as a compliment on support and resistance levels.
We look at typical 10 patterns that can be generated from combining these two indicators, as we have in past articles, and are training or optimizing with CHF JPY on the 4-hour time frame for the year 2023. Forward walks or testing are done with this symbol for the year 2024.
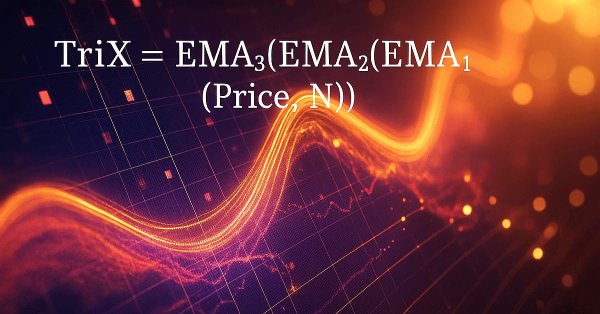
The basic definition of TRIX is it is a momentum oscillator that smoothes price by using a triple exponential moving average. It is best suited for identifying trends by smoothing or filtering out noise. It is able to achieve this by measuring the rate of change of a triple smoothed moving average. Besides trend confirmation, it does also provide divergence signals. TRIX is derived by applying an exponential average (EMA) three times. This is followed up by calculating a percentage change. Its formula is as follows:

Where:
- EMA₁: First EMA applied to price (e.g., closing price) over period N.
- EMA₂: Second EMA applied to EMA₁.
- EMA₃: Third EMA applied to EMA₂.
- TriX Line: Percentage change of the triple-smoothed EMA (momentum oscillator).
Common settings for the TRIX often have its period set to 15. We use the 3 value for our testing, as this turned out to be sufficiently sensitive given our small test window of one year. We use the constant parameter ‘__PERIOD’ in the custom signal class header to define this.
#define __PERIOD 3
class CSignalTRX_WPR : public CExpertSignal
{
protected:
   CiTriX            m_trix;
   CiWPR             m_wpr;
   int               m_patterns_used;
   //--- adjusted parameters

   //--- "weights" of market models (0-100)
   int               m_pattern_0;      // model 0
   int               m_pattern_1;      // model 1

...


   int               m_pattern_9;      // model 9
   //
   //int               m_patterns_usage;   //

public:
   CSignalTRX_WPR(void);
   ~CSignalTRX_WPR(void);
   //--- methods of setting adjustable parameters
   //--- methods of adjusting "weights" of market models
   void              Pattern_0(int value)
   {  m_pattern_0 = value;
   }
   void              Pattern_1(int value)
   {  m_pattern_1 = value;
   }
   void              Pattern_2(int value)
   {  m_pattern_2 = value;
   }


...

   void              PatternsUsed(int value)
   {  m_patterns_used = value;
      PatternsUsage(value);
   }
   //--- method of verification of settings
   virtual bool      ValidationSettings(void);
   //--- method of creating the oscillator and timeseries
   virtual bool      InitIndicators(CIndicators *indicators);
   //--- methods of checking if the market models are formed
   virtual int       LongCondition(void) override;
   virtual int       ShortCondition(void) override;
   virtual double    Direction(void) override;

protected:
   //--- method of initialization of the oscillator
   bool              InitTRX_WPR(CIndicators *indicators);
   //--- methods of getting data
   double            TRX(int ind)
   {  //
      m_trix.Refresh(-1);
      return(m_trix.Main(ind));
   }
   double            TRX_MAX(int ind)
   {  //
      m_trix.Refresh(-1);
      return(m_trix.Main(m_trix.Maximum(0, ind, __PERIOD)));
   }
   double            TRX_MIN(int ind)
   {  //
      m_trix.Refresh(-1);
      return(m_trix.Main(m_trix.Minimum(0, ind, __PERIOD)));
   }
   double            WPR(int ind)
   {  //
      m_wpr.Refresh(-1);
      return(m_wpr.Main(ind));
   }
   double            Close(int ind)
   {  //
      m_close.Refresh(-1);
      return(m_close.GetData(ind));
   }
   double            High(int ind)
   {  //
      m_high.Refresh(-1);
      return(m_high.GetData(ind));
   }
   double            Low(int ind)
   {  //
      m_low.Refresh(-1);
      return(m_low.GetData(ind));
   }
   long              Volume(int ind)
   {  //
      m_tick_volume.Refresh(-1);
      return(m_tick_volume.GetData(ind));
   }
   int               X()
   {  //
      return(StartIndex());
   }
   //--- methods to check for patterns
   bool              IsPattern_0(ENUM_POSITION_TYPE T);
   bool              IsPattern_1(ENUM_POSITION_TYPE T);

...


   bool              IsPattern_9(ENUM_POSITION_TYPE T);
};
MQL5 offers this indicator as an inbuilt function, so minimal coding is required on our part. We implement it from the CiTRIX class. Its interpretation is subject to its position or absolute value. A positive TRIX is a sign of bullish trend or upward trending price. A negative TRIX marks the opposite, downward trending price. The zero line is also a key threshold, whose crossing often marks trend reversal.
Divergence is another key phenomenon of this indicator with opposing directions with price, often signalling weak price trends. Its advantages are it reduces lag and noise compared to single EMAs and works well in trending markets. Its limitations could be false signalling in choppy markets.
The WPR is a support/resistance oscillator that marks price regions of overbought and oversold. Developed by Larry Williams, it compares the current closing price to the high-low range to the high-low range over a given period. Its primary purpose could be taken as identifying key reversal points in the market. It thus works best in ranging and non-trending markets. Its formula is as follows:

Where:
- Highest High_N is the highest price over the last N periods.
- Lowest Low_N is the lowest price over the last N periods.
- Close_today is Current closing price.
- × (-100) Inverts the value for easier interpretation (0 to -100 scale).
For both shared formula, ‘today’ is the same as the current/last price bar values. ‘Today’ was simply adapted from the daily time frame. Typically, the used look back period is 14, but we use a similar period with the TRIX oscillator which is 3 as highlighted above. The reader is free to adjust these and even have customized periods for the two indicators. The interpretation of this oscillator has values from -80 to -100 as a sign of an asset being at support. This is a potential buying opportunity. Values in the range -20 to 0 are a sign the asset’s price is at resistance. This signals a selling opportunity. The crossing of the -50 mid-point threshold can indicate trend shifts.
The oscillator also provides divergence signals, such as the bullish divergence where if price makes a lower low but WPR makes a higher low, then an upward reversal is imminent. A bearish divergence, on the flip side, is when price makes a higher high but WPR makes a lower high, a sign of a possible downward reversal. Advantages of the WPR are it is simple and effective for short term trading. It also tends to work well with other indicators. Its limitations are giving false signals in strong trending markets and the requirement for additional confirmation whenever it logs particular signals.
With that, we can now look at the 10 patterns. All testing is performed on the pair CHF JPY on the 4-hour time frame for the period 2023.01.01 to 2025.01.01. The year 2023 is a training or optimizing period, while 2024 is the testing or forward walk period.
TRIX Crossover and WPR Pivot
Our first pattern, has the TRIX crossing the zero line and the WPR pivoting from either support or resistance. When TRIX crosses above its zero line, it marks a turn to bullish trend, since the triple smoothed EMA is accelerating upward. Simultaneously, once the WPR moves above -80 from below, it indicates price exiting an over sold condition or bouncing off support. This often means buying pressure is building up, and together these two signals confirm a potential trend reversal or continuation with reduced risk of a false breakout.
When implementing this, one can in addition to the TRIX crossover look for a crossing with increasing slope for stronger confirmation. It is also important to ensure WPR moves above -80 but remain below -50 to avoid premature entries in weak reversals. Confirmation with volume spikes or price breaking above key resistance for added confidence can be considered as well. Risks will always abound in choppy markets, therefore the use of additional filters like MA could help. We implement this in MQL5 as follows:
//+------------------------------------------------------------------+
//| Check for Pattern 0.                                             |
//+------------------------------------------------------------------+
bool CSignalTRX_WPR::IsPattern_0(ENUM_POSITION_TYPE T)
{  if(T == POSITION_TYPE_BUY && 0.0 < TRX(X()) && 0.0 >  TRX(X() + 1) && -80.0 > WPR(X() + 1) && WPR(X()) > -80.0)
   {  return(true);
   }
   else if(T == POSITION_TYPE_SELL && 0.0 < TRX(X() + 1) && 0.0 >  TRX(X()) && -20.0 > WPR(X()) && WPR(X() + 1) > -20.0)
   {  return(true);
   }
   return(false);
}
The bearish signal is when TRIX crosses below zero bound, a sign of a bearish trend, since the smoothed EMA is decelerating. WPR would concurrently drop below -20 from above, marking price’s exit from overbought or resistance zone a sign of rising selling pressure. This combination usually points to a potential trend reversal or downward continuation. Pertinent guidance notes mirror points above on bullish where increasing downward slope can be checked to ensure stronger bearish momentum, and WPR should be below -20 but not yet at -50.
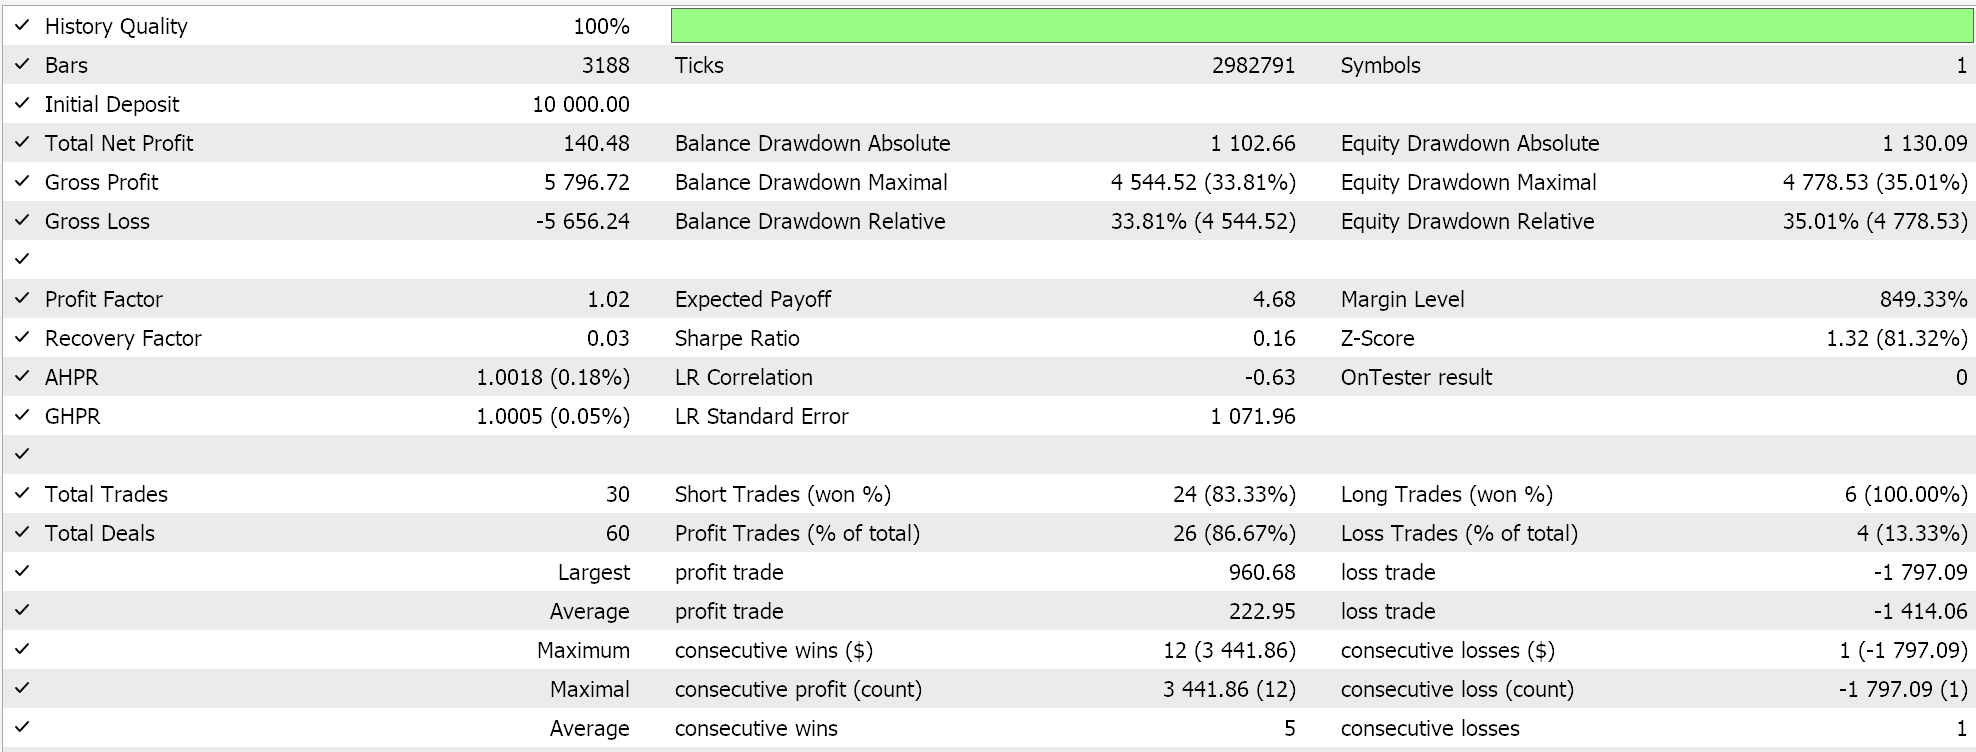
There should also be checks for price breaking below support or declining long volume to give extra validation. Risks in whipsaw or range bound markets could be abated with trend lines or RSI. Our test results from 2023.01.01 to 2025.01.01 having trained only on the year 2023 are given below:
TRIX Price Divergence and WPR at extremes
Our next pattern uses divergence between price and TRIX while WPR is extreme. The bullish signal is when price makes lower lows, but TRIX forms higher lows, indicating a weakening bearish momentum. When this is combined with WPR being below -80 a support level, it suggests the price is oversold and likely to reverse upward. This would be supported by TRIX’s bullish trend shift. When using, identify divergence over at least two price swings for reliability. It is also good to wait for WPR to start rising from below -80 to confirm buying pressure.
Candlestick patterns like the hammer can also be incorporated for entry confirmation. Risks with the pattern are divergence fails in strong downtrends. Confirmation on higher time frames though can help minimize these. We implement this as follows in MQL5:
//+------------------------------------------------------------------+
//| Check for Pattern 1.                                             |
//+------------------------------------------------------------------+
bool CSignalTRX_WPR::IsPattern_1(ENUM_POSITION_TYPE T)
{  if(T == POSITION_TYPE_BUY && Low(X() + 1) > Low(X()) && -80.0 > WPR(X()) && TRX(X()) > TRX(X() + 1))
   {  return(true);
   }
   else if(T == POSITION_TYPE_SELL && High(X()) > High(X() + 1) && WPR(X()) > -20.0 && TRX(X() + 1) > TRX(X()))
   {  return(true);
   }
   return(false);
}
The bearish signal is registered when we have negative divergence in TRIX with WPR in the resistance/overbought territory. This negative divergence occurs when price makes higher highs but TRIX forms lower highs, marking a fade in bullish momentum. WPR above -20 signals the resistance zone and suggests a potential reversal. This is often a high probability sell signal. When implementing this, it is often a good idea to confirm divergence across multiple peaks for accuracy. Waiting for WPR to drop below -20 after more than one bar can also be preferred.
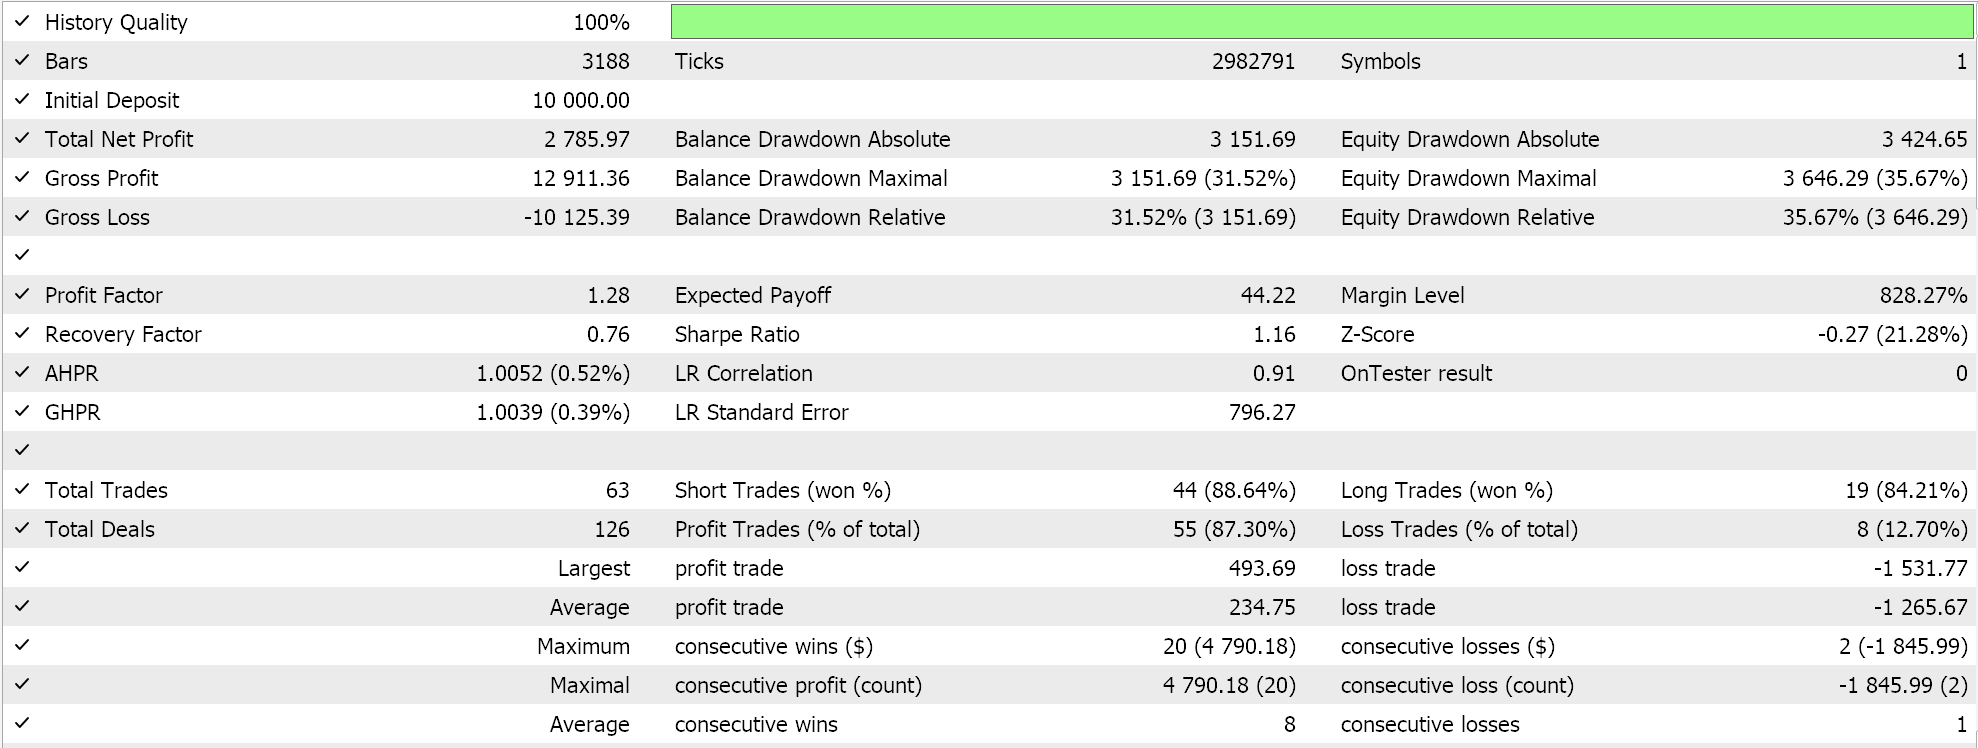
In addition, a look-out for bearish candlestick patterns can serve as an extra confirmation for this pattern. Pattern limitations are in strong trending markets, where divergences are often prone to failing. Our test results for this pattern are presented below:
TRIX Crossover and WPR Position
The bullish signal for our next pattern has the TRIX crossing above its signal zero-line as a sign of shift to bullish trend, while WPR is above -50 which implies price is in a neutral to resistance zone. This setup supports the thesis for a strengthening bullish trend with less likelihood for a pullback. If the TRIX crossover happens at a steepening slope, this is a sign of a strong signal. The WPR should be above -50 but below -20 as we are looking for neutral zones that are approaching resistance. Extra confirmation can be sought from price breaking above key moving averages or by running checks on the ADX. We implement this in MQL5 as follows:
//+------------------------------------------------------------------+
//| Check for Pattern 2.                                             |
//+------------------------------------------------------------------+
bool CSignalTRX_WPR::IsPattern_2(ENUM_POSITION_TYPE T)
{  if(T == POSITION_TYPE_BUY && 0.0 < TRX(X()) && 0.0 >  TRX(X() + 1) && WPR(X()) > -50.0)
   {  return(true);
   }
   else if(T == POSITION_TYPE_SELL && 0.0 < TRX(X() + 1) && 0.0 >  TRX(X()) && -50.0 > WPR(X()))
   {  return(true);
   }
   return(false);
}
The bearish pattern is the TRIX crossing below the zero line from above, with the WPR being below -50. This hints at a downward trend with sustained selling pressure. This argument, as with the bullish mirror of this above , is based on the less likelihood of a reversal given that price is at a neutral point and away from support. Looking out for steepening TRIX as with the other patterns above works towards a strong signal. WPR should also be below -50, but not yet at -80. Choppy markets, as with the bullish, do not suit this pattern, so it should be applied in trending markets. Our test results for pattern-2 are as follows:

TRIX Trending and WPR Exit
Our next pattern is defined as TRIX finding support at or near its zero-line, with WPR exiting the support/resistance zones. For the bullish, TRIX would oscillate in a tight range about the zero before decisively breaking above the zero. At the same time, WPR would leave the support region by crossing the -80 threshold from below to close above it. When implementing identification of historical TRIX support levels using past-chart can be a challenge and act as a too strong filter that could limit trade setups or opportunities.
The WPR -80 cross can be confirmed by using another momentum indicator that signals rising momentum. Engulfing price patterns in bullish price action or volume spikes can also be incorporated as extra confirmation signals. The limitation of this pattern are weak support levels, that can fail. Verification on higher time frame can serve as a good check for this pattern. Our MQL5 implementation is as follows:
//+------------------------------------------------------------------+
//| Check for Pattern 3.                                             |
//+------------------------------------------------------------------+
bool CSignalTRX_WPR::IsPattern_3(ENUM_POSITION_TYPE T)
{  if(T == POSITION_TYPE_BUY && TRX(X()) >= 0.0 && TRX(X() + 1) <= 0.0 && TRX(X() + 2) >= 0.0 && WPR(X() + 1) < -80.0 && WPR(X()) > -80.0)
   {  return(true);
   }
   else if(T == POSITION_TYPE_SELL && TRX(X() + 2) <= 0.0 && TRX(X() + 1) >= 0.0 && TRX(X()) <= 0.0 && WPR(X()) < -20.0 && WPR(X() + 1) > -20.0)
   {  return(true);
   }
   return(false);
}
The bearish signal has TRIX in a range before breaking lower, with WPR crossing the -20 level from above to close below it. This supports a bearish move. The TRIX consolidation followed by a lower breakout signals it hitting a ‘resistance’. Fading bullish momentum. WPR moves also confirms selling pressure. TRIX confirmation for prior peaks, as with the bullish, can be inhibitive in generating signals. Waiting on WPR to stay below -20 is important in order to avoid false signals. Bearish price action like the bearish engulfing can also play into this. Strong trending markets do make this pattern use very challenging, so users need to be on a lookout for this by supplementing with other indicators such as the RSI. Our test results for this pattern are shared below:

TRIX breakout and WPR exiting neutral
Our fifth pattern’s bullish signal has TRIX, like with pattern-3, breaking through a resistance while WPR is between -50 and -20. This tends to confirm price is in a bullish or neutral zone and therefore points to sustainable breakout. When using this pattern, TRIX slope and volume can act to support signal strength. Looking out for price breakouts on a chart, especially through key indicators like MA, can all be incorporated. This pattern is limited to trending markets at volatile markets can throw a few false signals. The MQL5 implementation is as follows:
//+------------------------------------------------------------------+
//| Check for Pattern 4.                                             |
//+------------------------------------------------------------------+
bool CSignalTRX_WPR::IsPattern_4(ENUM_POSITION_TYPE T)
{  if(T == POSITION_TYPE_BUY && 0.0 < TRX(X()) && 0.0 >  TRX(X() + 1) && TRX(X()) == TRX_MAX(X()) && WPR(X()) > -50.0 && WPR(X()) < -20.0)
   {  return(true);
   }
   else if(T == POSITION_TYPE_SELL &&  0.0 < TRX(X() + 1) && 0.0 >  TRX(X()) && TRX(X()) == TRX_MIN(X()) && WPR(X()) > -80.0 && WPR(X()) < -50.0)
   {  return(true);
   }
   return(false);
}
The bearish signal is TRIX breakdown below support, with WPR in neutral to bearish zone. Once TRIX is below a ‘historical’ support such as a prior low or even the zero line it can imply an acceleration in bearish momentum. The WPR would be between -50 and -80 which is a neutral to bearish zone, supporting breakdown validity. TRIX slope at the breakdown point again needs to be considered, and WPR should be below -50 but not oversold so as to have optimal timing. Extra confirmation can be had by having price breaks on chart such as below an MA. Choppy markets do not have this pattern faring well. Test results for this pattern, are presented below;

TRIX Reversal and WPR Exit
The bullish signal for this pattern, features the TRIX peaking at an extreme high, typically significantly above the zero bound, and reversing lower while the WPR drops below -20. This tends to suggest price is no longer overbought and therefore a healthy pullback or trend continuation is on the cards. With this pattern it is key to ensure WPR drops towards -50 but does not become oversold. One should also be on the lookout for price holding key support levels or parity with an important moving average.
Limitations for this pattern are overbought pullbacks can devolve into sharp pullbacks; which is why using fibonacci retracements with it could help manage this. We implement this in MQL5 as follows:
//+------------------------------------------------------------------+
//| Check for Pattern 5.                                             |
//+------------------------------------------------------------------+
bool CSignalTRX_WPR::IsPattern_5(ENUM_POSITION_TYPE T)
{  if(T == POSITION_TYPE_BUY && TRX(X() + 2) < TRX(X() + 1) && TRX(X() + 1) >  TRX(X()) && TRX(X() + 1) == TRX_MAX(X()) && WPR(X() + 1) > -20.0 && WPR(X()) < -20.0)
   {  return(true);
   }
   else if(T == POSITION_TYPE_SELL && TRX(X() + 2) > TRX(X() + 1) && TRX(X() + 1) <  TRX(X()) && TRX(X() + 1) == TRX_MIN(X()) && WPR(X()) > -80.0 && WPR(X() + 1) < -80.0)
   {  return(true);
   }
   return(false);
}
The bearish signal is the TRIX reversing from an oversold level with WPR exiting oversold suggesting a potential pullback to a bearish trend. TRIX bottoming at an extreme low followed by reversal upward suggests oversold conditions could be easing. WPR would need to rise above -80 to confirm the price is no longer oversold and thus the prior bearish trend would be about to resume. Steep TRIX that remains below zero can be a healthy extra confirmatio filter. WPR should rise towards -50, but it should not breach this key level as we do not want to get to overbought.
Another useful signal can be price hovering about a key level or an important MA. Limitations with this pattern are in choppy markets, thus trendlines could be supplemented to filter this out. Our testing for this pattern gives us the following report:

TRIX Continuation and Mid-Range WPR
Bullish signal for this pattern has TRIX continuing above zero with WPR in the mid-range of -50 to -20. This is meant to signal a sustained bullish trend, potentially with room for growth. The Explanation for this is that when TRIX remains above zero with a positive slope, that serves as confirmation of an ongoing bullish trend. A complimentary mid-range WPR does also indicate that price is neither overbought nor oversold. This does suggest that the trend potentially has room to continue without an imminent risk to a reversal.
Using this pattern can involve ensuring TRIX does maintain a consistent upward slope without sharp reversals. The WPR should also stay -50 to -20 bound in order to have an optimal trend continuation. Confirmation with price by following a trendline or staying above a key MA can be supplemented. Limitations of this pattern are that mid-range signals can weaken in low volatility markets. Our implementation in MQL5 for this is as follows:
//+------------------------------------------------------------------+
//| Check for Pattern 6.                                             |
//+------------------------------------------------------------------+
bool CSignalTRX_WPR::IsPattern_6(ENUM_POSITION_TYPE T)
{  if(T == POSITION_TYPE_BUY && TRX(X() + 2) > TRX(X() + 1) && TRX(X() + 1) > TRX(X()) && TRX(X()) > 0.0 && WPR(X()) > -80.0 && WPR(X()) < -20.0)
   {  return(true);
   }
   else if(T == POSITION_TYPE_SELL && TRX(X() + 2) < TRX(X() + 1) && TRX(X() + 1) < TRX(X()) && TRX(X()) < 0.0 && WPR(X()) > -80.0 && WPR(X()) < -20.0)
   {  return(true);
   }
   return(false);
}
The bearish pattern features TRIX continuing below zero with WPR in the mid-range signalling a sustained bearish trend. Reasoning for why this is bearish is that TRIX remaining below zero with a negative slope tends to confirm a bearish trend. WPR in the mid-range of -50 to -80 also shows that price is not yet oversold. This could imply the downtrend can continue without immediate reversal. When applying this bearish pattern as already mentioned with most of the patterns above, the TRIX slope is crucial. It should consistently be downward.
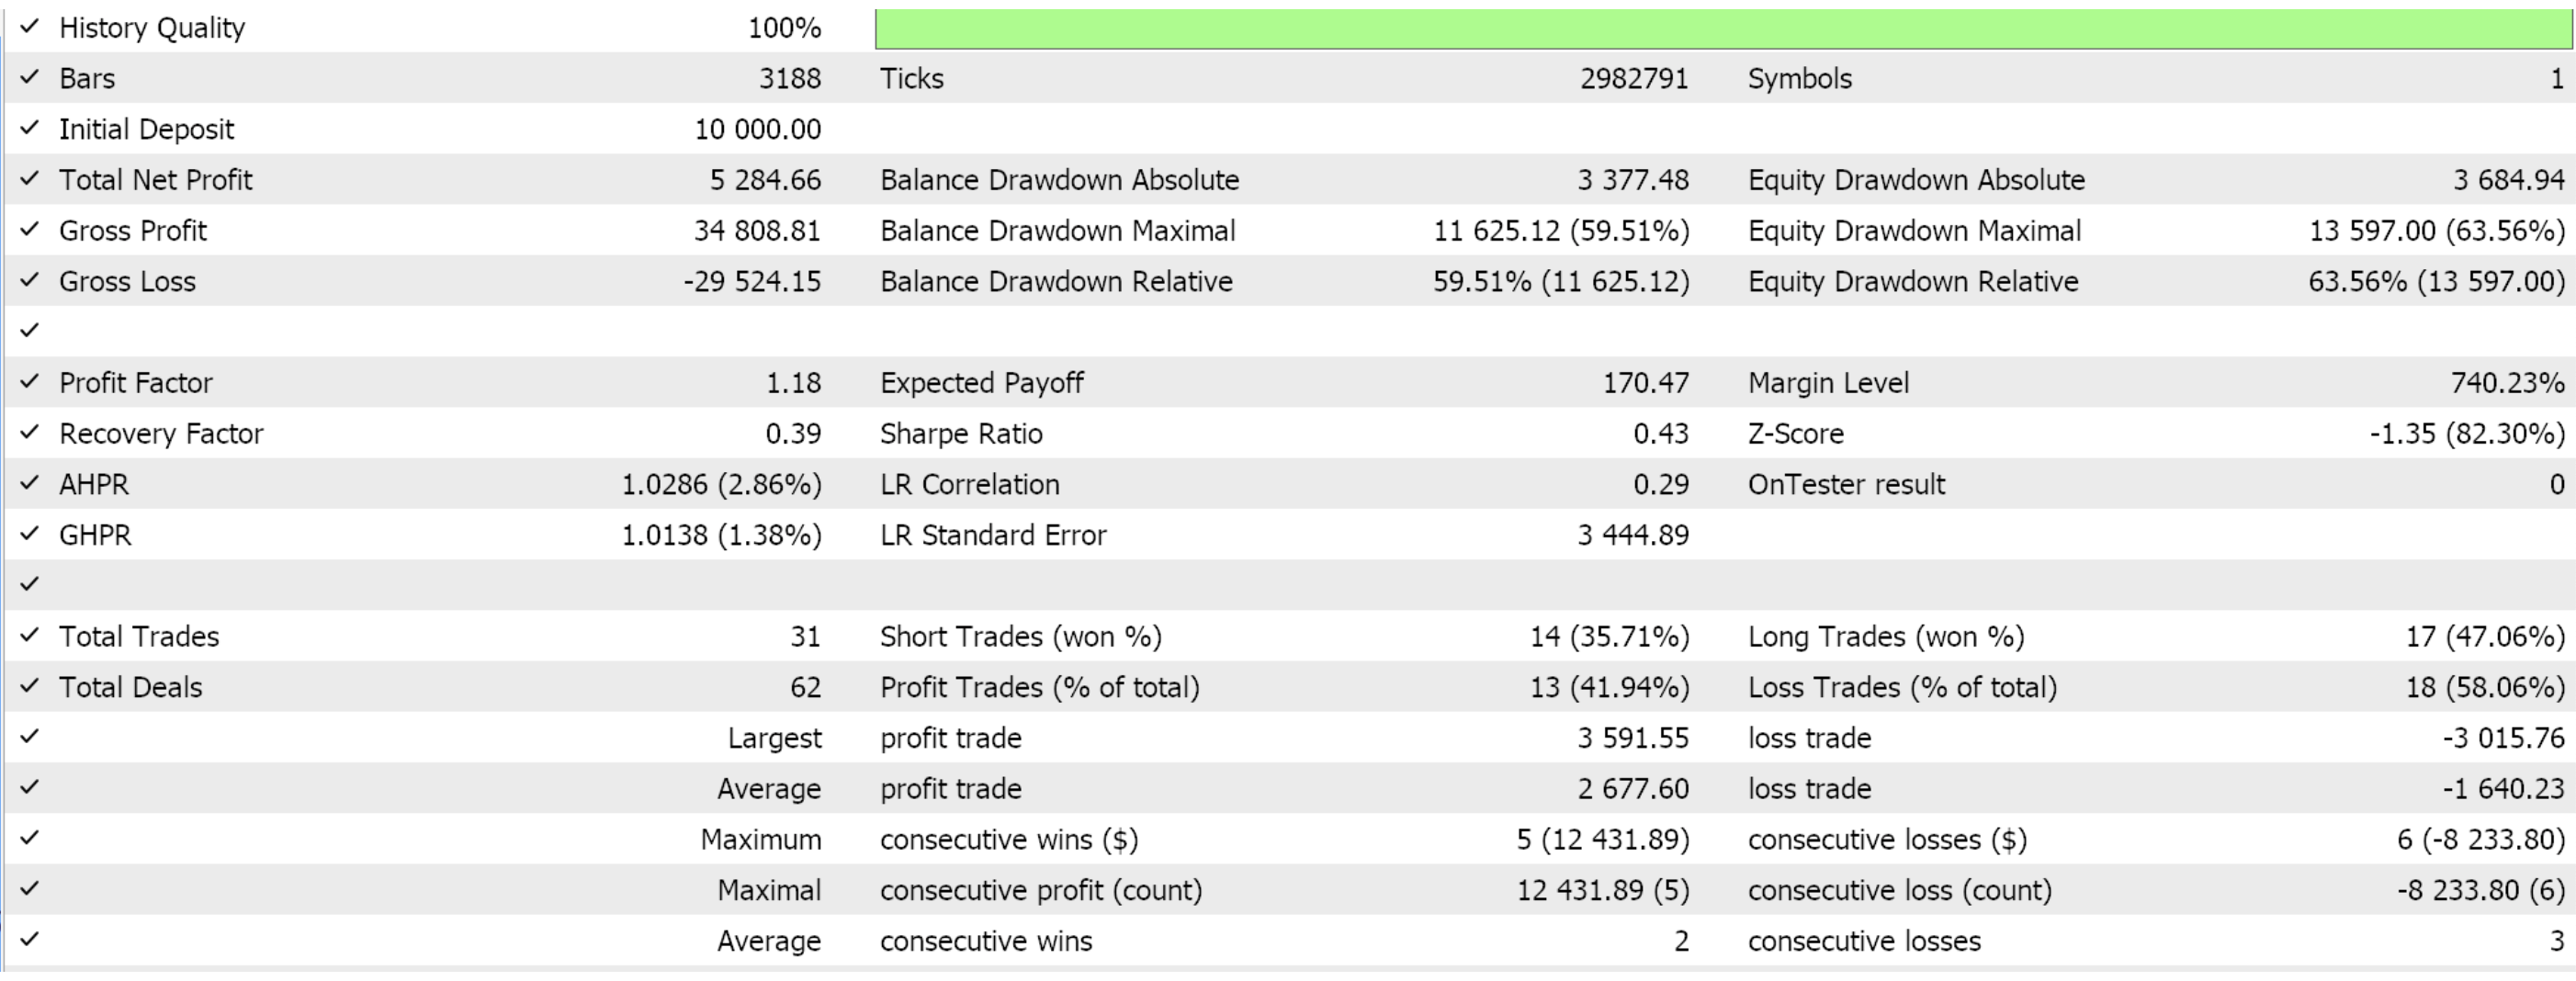
The WPR should also be monitored to ensure it remains within the key range of -50 to -80. Price at a key MA or support level adds credence to this pattern and its limitations as mentioned with the bullish mirror are mid-range signal weakness that can drift for extended periods. Test results for this, our seventh pattern are below:
TRIX Consolidation plus WPR in Zone
The bullish pattern for this features a breakout from a consolidation of the TRIX with WPR in a bullish, support zone; signalling a new uptrend with healthy momentum. This holds up because TRIX moving sideways or consolidating near a zero line and then breaking upwards indicates a new bullish trend. And WPR above -50 serves to confirm bullish momentum, this suggests bullish momentum is likely to sustain. Implementing this, ideally, should require identifying TRIX consolidation in as tight a range as possible, near the zero bound over multiple bars/periods.
This is thus bound to be a very restrictive signal that would hardly produce any signals even over large testing periods. In fact this pattern and a few like it ar why we resorted to the very short indicator period of 3 since longer periods were not as sensitive to price and therefore yielded very few signals and therefore very few trades. For this pattern in fact slope confirmation though desirable like with all the other patterns, strictly speaking is a luxury as there are not that many entry points to begin with. We implement this in MQL5 as follows:
//+------------------------------------------------------------------+
//| Check for Pattern 7.                                             |
//+------------------------------------------------------------------+
bool CSignalTRX_WPR::IsPattern_7(ENUM_POSITION_TYPE T)
{  if(T == POSITION_TYPE_BUY && fabs(Close(X()) - Close(X() + 1)) >= TRX_MAX(X() + 1) - TRX_MIN(X() + 1) && TRX_MAX(X() + 1) > 0.0 && TRX_MIN(X() + 1) < 0.0 && TRX_MAX(X() + 1) < TRX(X()) && WPR(X()) >= -20.0)
   {  return(true);
   }
   else if(T == POSITION_TYPE_SELL && fabs(Close(X()) - Close(X() + 1)) >= TRX_MAX(X() + 1) - TRX_MIN(X() + 1) && TRX_MAX(X() + 1) > 0.0 && TRX_MIN(X() + 1) < 0.0 && TRX_MIN(X() + 1) > TRX(X()) && WPR(X()) <= -80.0)
   {  return(true);
   }
   return(false);
}
The bearish pattern is the TRIX breaking down from consolidation with WPR in a bearish zone signalling new downtrend with some momentum. Reason why this is bearish is similar to the bullish case. Consolidation at the indecisive zero for an extended period followed by a breakdown to the lower side often marks not just a bearish trend, but the genesis of one. WPR’s sub -50 positioning simply goes on to further solidify this bearish thesis.
When applying extensive checks for narrow TRIX consolidation, there is a need to be balance this with having a healthy number of trades. The WPR should be below -50 but not oversold so as to have optimal timing. False breakdowns in choppy markets remain a main risk for this pattern. Our test results for pattern-7 are as follows:

TRIX Reversal at Zero Line with Extreme WPR
Our penultimate pattern has its bullish signal with TRIX reversing upward at the zero line with WPR oversold. This is a strong bullish reversal from a neutral trend. Why these patterns could be bullish is the TRIX reversing upward at the zero line does mark a shift from neutral to bullish momentum. WPR being sub -80 also confirms oversold conditions. This therefore suggests a high probability reversal as buying pressure builds up.
Using this pattern requires proper confirmation of TRIX reversal which may require looking at more than one bar. Also waiting for WPR to clearly rise above -80 on more than one bar can add more credence. Extra support filters can be bullish candlestick patterns or price hovering at key support levels as already argued on the other patterns above. Trending markets are a limitation for this pattern. We implement this in MQL5 as follows:
//+------------------------------------------------------------------+
//| Check for Pattern 8.                                             |
//+------------------------------------------------------------------+
bool CSignalTRX_WPR::IsPattern_8(ENUM_POSITION_TYPE T)
{  if(T == POSITION_TYPE_BUY && TRX(X()) > TRX(X() + 1) && TRX(X() + 1) > 0.0 && TRX(X() + 2) > TRX(X() + 1) && WPR(X()) < -50.0)
   {  return(true);
   }
   else if(T == POSITION_TYPE_SELL && TRX(X() + 2) < TRX(X() + 1) && TRX(X() + 1) < 0.0 && TRX(X()) < TRX(X() + 1) && WPR(X()) > -50.0)
   {  return(true);
   }
   return(false);
}
The bearish pattern has TRIX reversing downward when close to the zero and WPR indicating price is in overbought territory or the resistance level. Reasons for this is a reversing TRIX from the zero marks or affirms a shift in market sentiment towards bearish. The WPR being above -20 also serves to confirm overbought conditions and this works towards establishing a high-probabilty reversal since selling pressure is increasing. Confirmation of the TRIX reversal needs to be clear by using slope or number of bars post the reversal.
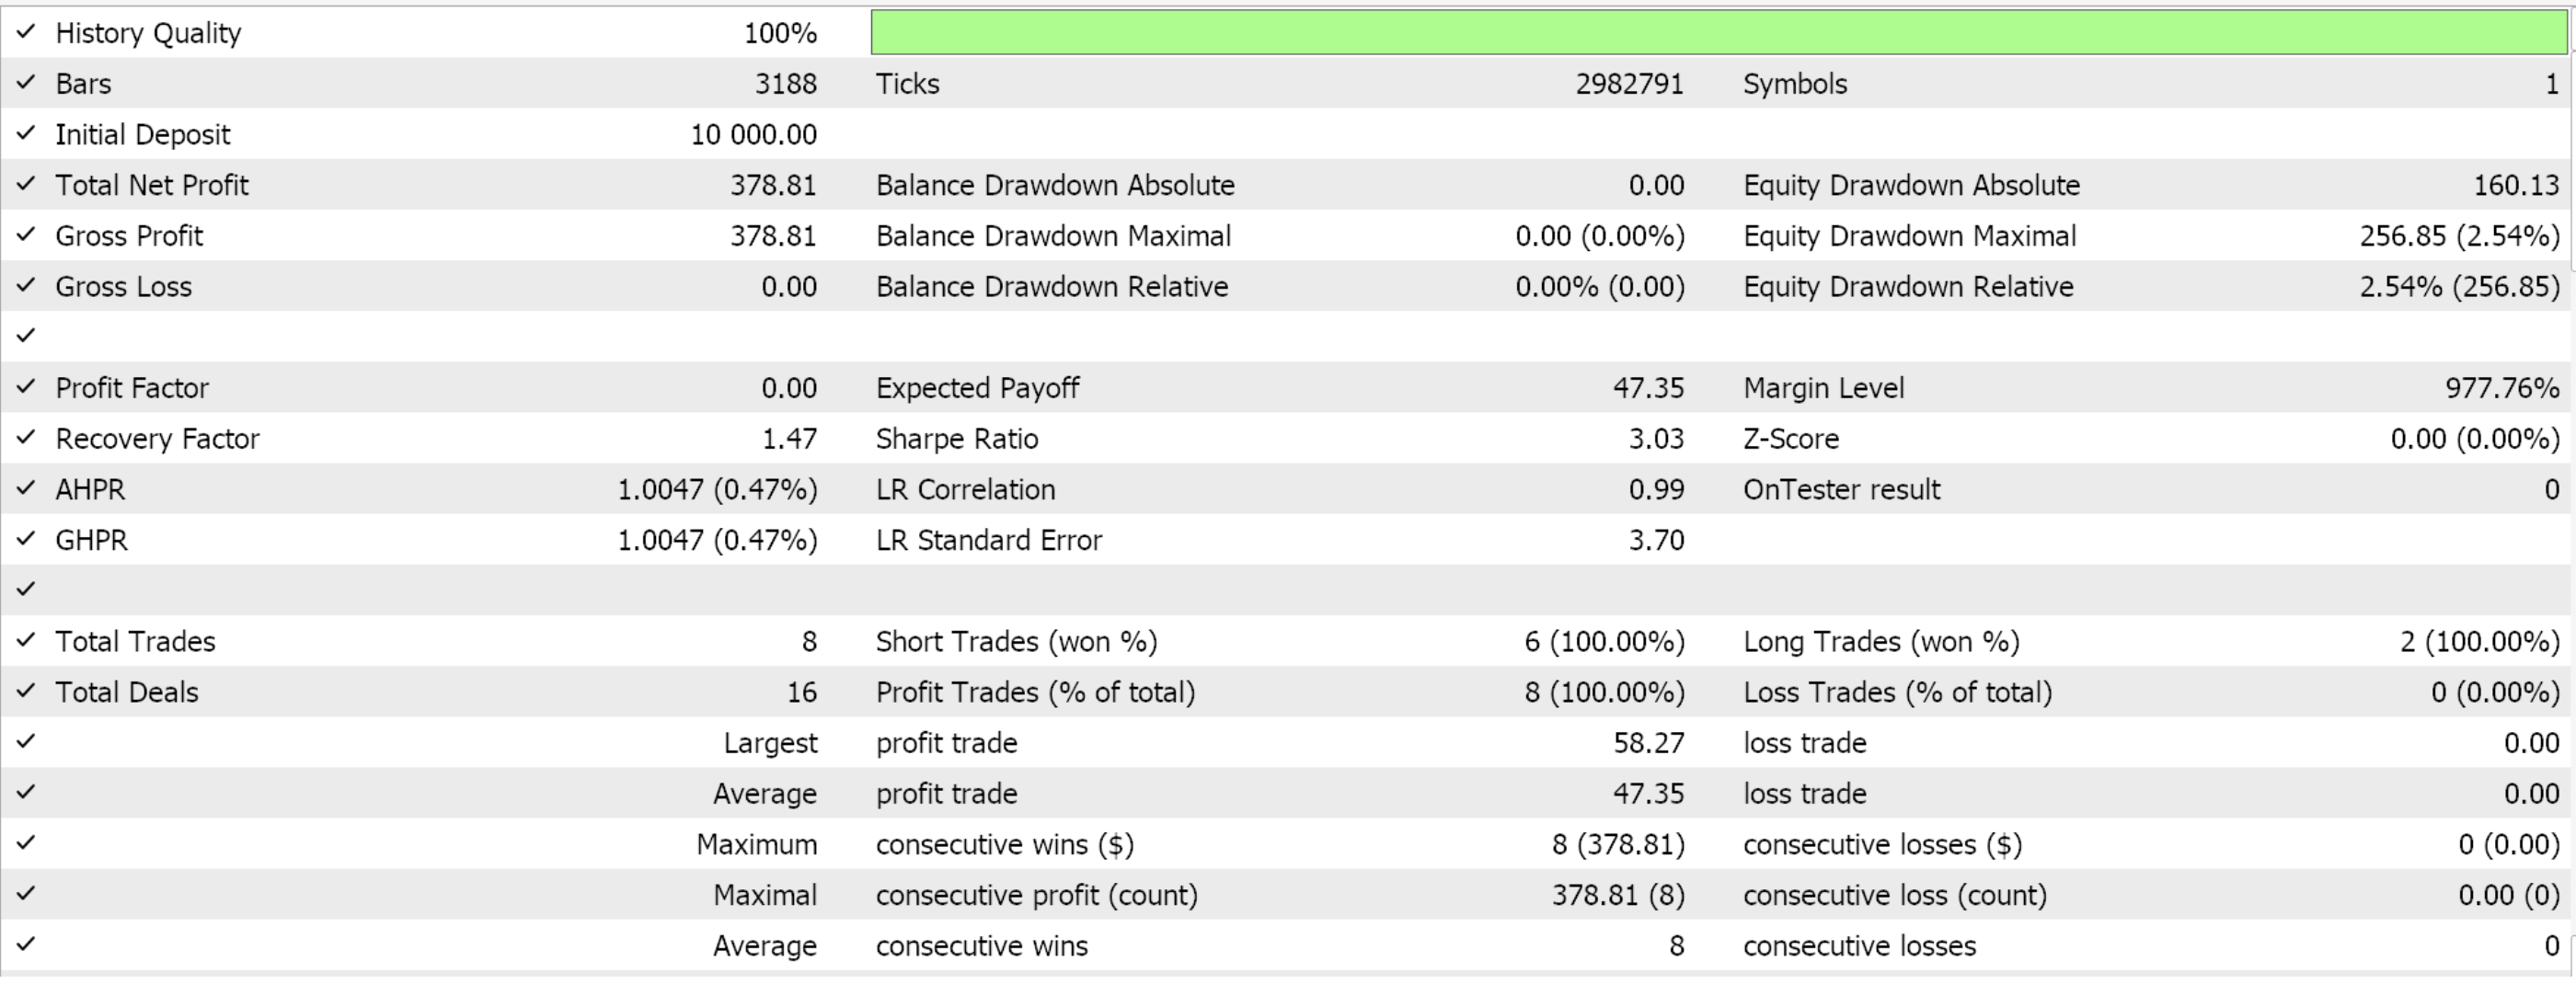
Waiting on WPR to fall below -20 convincingly and supplementing with bearish candlestick patterns or resistance levels can also result in more credible patterns. Limitations for this pattern like with the bullish are in trending markets. Test results for this pattern gave us the following report. As with all patterns tested in this article, the test run was from 2023.01.01. to 2025.01.01 after training/optimizing from 2023.01.01 to 2024.01.01. The symbol used is CHF JPY and the timeframe was 4-hour period.
TRIX Double Bottom/Top and WPR Oversold/Overbought
Our final pattern’s bullish signal has TRIX forming a double bottom while WPR signals a strong bullish reversal. This support level price action is meant to confirm a price bottom is in place. Explanation for this argument is that a double bottom, which is two alternate points at a support level that is often below zero, much like consolidation, indicate a potential reversal from bearish to bullish trends. With the WPR at the -80 support level this affirms oversold condiotns have already taken hold and therefore change is imminent.
Additional considerations for when in use are confirming that the double bottom is close to the zero line or in negative territory. This requirement is boud to make getting signals very difficult as TRIX double bottoms rarely happen over alternate bars. As with the other patterns supporting signals can be price forming a double bottom as well or breaking above a resistance. Weakness for this pattern are volatile choppy markets. This is how we code the MQL5 implementation:
//+------------------------------------------------------------------+
//| Check for Pattern 9.                                             |
//+------------------------------------------------------------------+
bool CSignalTRX_WPR::IsPattern_9(ENUM_POSITION_TYPE T)
{  if(T == POSITION_TYPE_BUY && TRX(X()) >= 0.0 && TRX(X() + 1) <= 0.0 && TRX(X() + 2) >= 0.0 && TRX(X() + 3) <= 0.0 && TRX(X() + 4) >= 0.0 && WPR(X()) <= -50.0)
   {  return(true);
   }
   else if(T == POSITION_TYPE_SELL && TRX(X() + 4) <= 0.0 && TRX(X() + 3) >= 0.0 && TRX(X() + 2) <= 0.0 && TRX(X() + 1) >= 0.0 && TRX(X()) <= 0.0 && WPR(X()) >= -50.0)
   {  return(true);
   }
   return(false);
}
The bearish pattern features a double top TRIX again at the zero bound or just above it in positive territory. This often marks fading bullish momentum. The WPR being above -20 confirms overbought conditions and also supports the downward reversal case. In use notes cover most of the arguments we have already mentioned for the other patterns above. Slope, lagged entries, and additional indicators. The risks here use in whipsaw markets. Test results for this final pattern did not yield any trades as the entry oattern was too restrictive. This was despite using a very short indicator period!
Conclusion
We have reviewed patterns and signals got from bringing together the indicators Triple Exponential Moving average Oscillator and the Williams Percent Range oscillator. For our testing purposes we have used overly short indicator periods in order to illicit a sufficient amount of trades for our small test window of one year. This tells you that this indicator pairing is not as sensitive or busy as other pairs we have considered in the past. Therefore secondary testing on the part of the reader is mandatory when dealing with this indicator pair before one can establish what sticks. From our testing above only patterns 1,4 and 5 are able to forward walk.
| name | description |
|---|---|
| wz-67.mq5 | Wizard Assembled Expert Adviser whose header outlines files used |
| SignalWZ_67.mqh | Custom signal class file used in wizard assembly |
Guidance on how to use these custom signal class file to assemble an Expert Advisor by the MQL5 wizard can be found here for new readers.
Warning: All rights to these materials are reserved by MetaQuotes Ltd. Copying or reprinting of these materials in whole or in part is prohibited.
This article was written by a user of the site and reflects their personal views. MetaQuotes Ltd is not responsible for the accuracy of the information presented, nor for any consequences resulting from the use of the solutions, strategies or recommendations described.
 Mastering Log Records (Part 7): How to Show Logs on Chart
 Developing a Replay System (Part 70): Getting the Time Right (III)
 Build Self Optimizing Expert Advisors in MQL5 (Part 7): Trading With Multiple Periods At Once
 From Basic to Intermediate: Array (II)
- Free trading apps
- Over 8,000 signals for copying
- Economic news for exploring financial markets
You agree to website policy and terms of use