Building and testing Keltner Channel trading systems
Introduction
The concept of volatility in the financial market is very important to understand and to make it work in your favor when you are trading in the market. The main purpose of this article is to help you save time by providing you with many test results for trading systems based on the concept of volatility using the Keltner Channel technical indicator to find out how it can work as part of your complete system to measure volatility or take action under certain conditions concerning this important concept.
The most important thing to understand is that you may find that you need to optimize your system according to your preferences to get better results, so you need to do your work and test many different aspects according to your trading objectives to find the best ultimate setup for your system.
The approach in this article will be to learn how we can create our custom Keltner Channel indicator and trading systems to trade simple trading strategies and then test them on different financial assets and compare them to find out which one can give better results according to our testing and optimization and we will try to provide the best setup as much as possible. We will cover this article through the following topics:
- Volatility definition
- Keltner Channel definition
- Keltner Channel trading strategies
- Keltner Channel trading system
- Conclusion
Volatility definition
In this part, we will understand what volatility is in general and how it is important in the trading and financial market. Volatility is a statistical concept that can be used to measure the dispersion of returns for financial assets and when the volatility increases, the risk also increases. We can say that volatility is a concept that also refers to large swings in the markets in both directions and this swing movement is measured by the swing around the mean price.
There are many reasons that results in the market volatility such as the following:
- Market Sentiment: market volatility can be affected by traders' emotions.
- Earnings: reports of earnings can affect the market volatility based on their results.
- Economic events and indicators: Important economic events and indicators can also lead to volatility in the market such as inflation, GDP, and Employment news.
- Liquidity: there is a relationship between liquidity and volatility in the market, when the liquidity is low the volatility increases.
When it comes to measuring volatility, we can see that there are many ways or methods that can be used in this context, such as beta coefficient and standard deviations. There are also many technical indicators that can be used to measure the volatility in the market such as Bollinger Bands, Average true range, Volatility index (VIX), and the Keltner Channel which is our topic in this article. Measuring volatility can be very helpful to evaluate the fluctuation of the financial asset.
There are also many types of volatility, such as implied volatility and historical volatility.
Keltner Channel definition
In this part, we will learn more about the Keltner Channel indicator in detail, how to use it, and how we can calculate this indicator to understand how we can use it in our favor. The Keltner Channel indicator is a volatility indicator that contains two bands above and below prices and a moving average in between.
The Keltner Channel indicator was first introduced by Chester Keltner in the 1960s in his book How to Make Money in Commodities. It used the simple moving average and the high/low range in its calculation, but it evolved into the form that is commonly used today to use the Average True Range (ATR) in its calculation. The typical setting for the moving average is 20 periods, the upper and lower bands are calculated as twice the ATR above and below the EMA, and these settings can be adjusted according to user preferences and trading objectives.
The Keltner Channel refers to bullish when the price reaches the Upper band and bearish when the price reaches the lower band because it can be used to identify trend direction. Bands also can be used as support and resistance when prices move between them without a clear up or down trend. In summary, The Keltner Channel is that technical indicator that measures the volatility of financial assets by using the exponential moving average and the average true range.
The following is how we can calculate the Keltner Channel indicator:
- Calculate the exponential moving average and it will be the middle line of the indicator.
- Calculate the average true range to use it to calculate bands.
- Calculate the upper band to be equal to EMA and add to it the result of multiplication of 2 and ATR.
- Calculate the lower band to be equal to the EMA and subtract the result of multiplication of 2 and ATR.
So,
Keltner Channel Middle Line = Exponential Moving Average (EMA)
Keltner Channel Upper Band = Exponential Moving Average (EMA) + 2 * Average True Range (ATR)
Keltner Channel Lower Band = Exponential Moving Average (EMA) - 2 * Average True Range (ATR)
Keltner Channel strategies
According to what we understood about how we can use the Keltner Channel indicator by using bands as a support or resistance or considering bullish when approaching the upper band and bearish when approaching the lower band we will use two simple strategies:
- Bands rebound: we will place a buy order when rebounding above the lower band and we will place a sell order when rebounding below the upper band.
- Bands breakout: we will place a buy order when breaking the upper band and a sell order when breaking below the lower band.
Strategy one: Bands rebound
According to what we understand about the Keltner Channel indicator, we can use it by detecting buy and sell signals based on the position of the closing price and the bands of the indicators. We will open a buy order when the previous of the last closing price closes below the previous lower band and at the same time, the last closing price closes above the lower band. The sell order will be opened when the previous of the last closing price closes above the upper band and at the same time, the last closing price closes below the upper band.
Simply,
The previous of the last close < the lower band and the last closing price > the lower band value ==> buy signal
The previous of the last close > the upper band and the last closing price < the upper band value ==> sell signal
Strategy two: Bands breakout
According to this strategy we will place an order while the breakout happens, we will place a buy order when the previous of the last closing price is below the previous of the last upper band and at the same time the last closing price closed above the last upper band and vice versa we will place a sell order when the previous of the last price is above the previous of the last lower band and at the same time the last closing price close below the last lower band.
Simply,
The previous of the last close < the upper band and the last closing price > the upper band value ==> buy signal
The previous of the last close > the lower band and the last closing price < the lower band value ==> sell signal
Keltner Channel trading system
In this part, we will create a trading system to place orders automatically based on the previously mentioned strategy. First, we will create the custom indicator to calculate the Keltner channel indicator to be used later to create our trading system the following is about a method to code the indicator:
Using the #property preprocessor to determine the place of the indicator and we will use indicator_chart_window to show the indicator on the chart
#property indicator_chart_window
Determining the buffers indicator by using the identifier value of indicator_buffers we will set the number of 3 and for determining the number of plots we will set it with 3 also
#property indicator_buffers 3
#property indicator_plots 3
Setting the properties of indicators in terms of type, style, width, color, and label for upper, middle, and lower lines
#property indicator_type1 DRAW_LINE
#property indicator_style1 STYLE_SOLID
#property indicator_width1 2
#property indicator_color1 clrRed
#property indicator_label1 "Keltner Upper Band"


#property indicator_type2 DRAW_LINE
#property indicator_style2 STYLE_SOLID
#property indicator_width2 1
#property indicator_color2 clrBlue
#property indicator_label2 "Keltner Middle Line"


#property indicator_type3 DRAW_LINE
#property indicator_style3 STYLE_SOLID
#property indicator_width3 2
#property indicator_color3 clrGreen
#property indicator_label3 "Keltner Lower Band"
Setting input for the indicator in terms of moving average period, channel multiplier, use of ATR in band calculators, moving average method or mode, and price type.
input int      maPeriod            = 10;           // Moving Average Period
input double   multiInp             = 2.0;          // Channel multiplier
input bool     isAtr                 = false;        // ATR
input ENUM_MA_METHOD     maMode       = MODE_EMA;     // Moving Average Mode
input ENUM_APPLIED_PRICE priceType = PRICE_TYPICAL;// Price Type
Declaring global variables three arrays (upper, middle, and lower), two handles of moving average and ATR, and minBars
double upper[], middle[], lower[];
int maHandle, atrHandle;
static int minBars = maPeriod + 1;
In the OnInit() function we will link the indicator buffer with arrays by using the SetIndexBuffer function and its parameters are:
- index: to determine the index buffer and it will be 0 for the upper, 1 for the middle, and 2 for the lower.
- buffer[]: to determine the array, it will be upper, middle, and lower.
- data_type: to determine what we need to store in the indicator and it can be one of the ENUM_INDEXBUFFER_TYPE, it is INDICATOR_DATA by default and this is what we will use.
   SetIndexBuffer(0,upper,     INDICATOR_DATA);
   SetIndexBuffer(1,middle,  INDICATOR_DATA);
   SetIndexBuffer(2,lower,  INDICATOR_DATA);
Setting the AS_Series flag to arrays by using the ArraySetAsSeries function and its parameters are:
- array[]: to determine the array by its reference we will use upper, middle, and lower arrays.
- flag: to determine the direction of array indexing and it will return true on success or false in case of failure.
   ArraySetAsSeries(upper, true);
   ArraySetAsSeries(middle, true);
   ArraySetAsSeries(lower, true);
Setting the name of the indicator by using the IndicatorSetString function and its parameters are:
- prop_id: to determine the identifier, it can be one of the ENUM_CUSTOMIND_PROPERTY_STRING, we will use the INDICATOR_SHORTNAME to set the indicator name.
- prop_value: to determine the desired indicator name.
IndicatorSetString(INDICATOR_SHORTNAME,"Custom Keltner Channel " + IntegerToString(maPeriod));
Setting digits of the indicator values by using the IndicatorSetInteger function and its parameters are the same as the IndicatorSetString except the data type of the prop_value will be instead of string
IndicatorSetInteger(INDICATOR_DIGITS,_Digits);
Defining the moving average handle by using the iMA function and its parameters are:
- symbol: to specify the symbol name we will use NULL to be applied for the current symbol.
- period: to specify the period and we will use 0 to be applied to the current period.
- ma_period: to specify the moving average period, we will use the user input of maPeriod.
- ma_shift: to specify the horizontal shift if needed.
- ma_method: to specify the method of moving average and we will use the user input of maMode.
- applied_price: to specify the type of price and we will use the user input priceType.
maHandle = iMA(NULL, 0, maPeriod, 0, maMode, priceType);
Defining the ATR according to the input of ATR if true or false to be used in bands calculation or not
   if(isAtr)
     {
      atrHandle = iATR(NULL, 0, maPeriod);
      if(atrHandle == INVALID_HANDLE)
        {
         Print("Handle Error");
         return(INIT_FAILED);
        }
     }
   else
      atrHandle = INVALID_HANDLE;
Declaring the indValue function to specify the indicator buffers, moving average, middle, upper, and lower values
void indValue(const double& h[], const double& l[], int shift)
  {
   double ma[1];
   if(CopyBuffer(maHandle, 0, shift, 1, ma) <= 0)
      return;
   middle[shift] = ma[0];
   double average = AVG(h, l, shift);
   upper[shift]    = middle[shift] + average * multiInp;
   lower[shift] = middle[shift] - average * multiInp;
  }
Declaring the AVG function to calculate positions of boundaries based on the calculated multiplier
double AVG(const double& High[],const double& Low[], int shift)
  {
   double sum = 0.0;
   if(atrHandle == INVALID_HANDLE)
     {
      for(int i = shift; i < shift + maPeriod; i++)
         sum += High[i] - Low[i];
     }
   else
     {
      double t[];
      ArrayResize(t, maPeriod);
      ArrayInitialize(t, 0);
      if(CopyBuffer(atrHandle, 0, shift, maPeriod, t) <= 0)
         return sum;
      for(int i = 0; i < maPeriod; i++)
         sum += t[i];
     }
   return sum / maPeriod;
  }
In the OnCalculate function we will calculate the indicator values the same as the following code
   if(rates_total <= minBars)
      return 0;
   ArraySetAsSeries(close,true);
   ArraySetAsSeries(high, true);
   ArraySetAsSeries(low,  true);
   int limit = rates_total - prev_calculated;
   if(limit == 0)
     {
     }
   else
      if(limit == 1)
        {
         indValue(high, low, 1);
         return(rates_total);
        }
      else
         if(limit > 1)
           {
            ArrayInitialize(middle, EMPTY_VALUE);
            ArrayInitialize(upper,    EMPTY_VALUE);
            ArrayInitialize(lower, EMPTY_VALUE);
            limit = rates_total - minBars;
            for(int i = limit; i >= 1 && !IsStopped(); i--)
               indValue(high, low, i);
            return(rates_total);
           }
   indValue(high, low, 0);
   return(rates_total);
So, we can find the full code in one block of the custom Keltner Channel indicator the same as the following:
//+------------------------------------------------------------------+
//|                                       Custom_Keltner_Channel.mq5 |
//+------------------------------------------------------------------+
#property indicator_chart_window
#property indicator_buffers 3
#property indicator_plots 3
#property indicator_type1 DRAW_LINE
#property indicator_style1 STYLE_SOLID
#property indicator_width1 2
#property indicator_color1 clrRed
#property indicator_label1 "Keltner Upper Band"
#property indicator_type2 DRAW_LINE
#property indicator_style2 STYLE_SOLID
#property indicator_width2 1
#property indicator_color2 clrBlue
#property indicator_label2 "Keltner Middle Line"
#property indicator_type3 DRAW_LINE
#property indicator_style3 STYLE_SOLID
#property indicator_width3 2
#property indicator_color3 clrGreen
#property indicator_label3 "Keltner Lower Band"
input int      maPeriod            = 10;           // Moving Average Period
input double   multiInp             = 2.0;          // Channel multiplier
input bool     isAtr                 = false;        // ATR
input ENUM_MA_METHOD     maMode       = MODE_EMA;     // Moving Average Mode
input ENUM_APPLIED_PRICE priceType = PRICE_TYPICAL;// Price Type
double upper[], middle[], lower[];
int maHandle, atrHandle;
static int minBars = maPeriod + 1;
//+------------------------------------------------------------------+
int OnInit()
  {
   SetIndexBuffer(0,upper, INDICATOR_DATA);
   SetIndexBuffer(1,middle, INDICATOR_DATA);
   SetIndexBuffer(2,lower, INDICATOR_DATA);
   ArraySetAsSeries(upper, true);
   ArraySetAsSeries(middle, true);
   ArraySetAsSeries(lower, true);
   IndicatorSetString(INDICATOR_SHORTNAME,"Custom Keltner Channel " + IntegerToString(maPeriod));
   IndicatorSetInteger(INDICATOR_DIGITS,_Digits);
   maHandle = iMA(NULL, 0, maPeriod, 0, maMode, priceType);
   if(isAtr)
     {
      atrHandle = iATR(NULL, 0, maPeriod);
      if(atrHandle == INVALID_HANDLE)
        {
         Print("Handle Error");
         return(INIT_FAILED);
        }
     }
   else
      atrHandle = INVALID_HANDLE;
   return INIT_SUCCEEDED;
  }
void indValue(const double& h[], const double& l[], int shift)
  {
   double ma[1];
   if(CopyBuffer(maHandle, 0, shift, 1, ma) <= 0)
      return;
   middle[shift] = ma[0];
   double average = AVG(h, l, shift);
   upper[shift]    = middle[shift] + average * multiInp;
   lower[shift] = middle[shift] - average * multiInp;
  }
double AVG(const double& High[],const double& Low[], int shift)
  {
   double sum = 0.0;
   if(atrHandle == INVALID_HANDLE)
     {
      for(int i = shift; i < shift + maPeriod; i++)
         sum += High[i] - Low[i];
     }
   else
     {
      double t[];
      ArrayResize(t, maPeriod);
      ArrayInitialize(t, 0);
      if(CopyBuffer(atrHandle, 0, shift, maPeriod, t) <= 0)
         return sum;
      for(int i = 0; i < maPeriod; i++)
         sum += t[i];
     }
   return sum / maPeriod;
  }
//+------------------------------------------------------------------+
int OnCalculate(const int rates_total,
                const int prev_calculated,
                const datetime &time[],
                const double &open[],
                const double &high[],
                const double &low[],
                const double &close[],
                const long &tick_volume[],
                const long &volume[],
                const int &spread[])
  {
   if(rates_total <= minBars)
      return 0;
   ArraySetAsSeries(close,true);
   ArraySetAsSeries(high, true);
   ArraySetAsSeries(low,  true);
   int limit = rates_total - prev_calculated;
   if(limit == 0)
     {
     }
   else
      if(limit == 1)
        {
         indValue(high, low, 1);
         return(rates_total);
        }
      else
         if(limit > 1)
           {
            ArrayInitialize(middle, EMPTY_VALUE);
            ArrayInitialize(upper,    EMPTY_VALUE);
            ArrayInitialize(lower, EMPTY_VALUE);
            limit = rates_total - minBars;
            for(int i = limit; i >= 1 && !IsStopped(); i--)
               indValue(high, low, i);
            return(rates_total);
           }
   indValue(high, low, 0);
   return(rates_total);
  }
//+------------------------------------------------------------------+
After compiling this code we can find it in the indicator folder after inserting it into the chart we can find it the same as the following example:
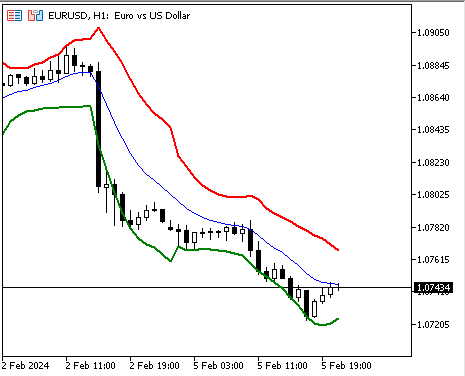
As we can see in the previous chart we have a channel surrounds the price representing the Keltner Channel indicator. Now we need to create our trading system using this indicator based on mentioned strategies and we can do that the same as the following.
Now we need to create trading system for each mentioned strategy to automate placing buy and sell orders based on the concept of them.
Strategy one: Bands rebound trading system:
The first strategy the same as we mentioned is to consider opening trades based on rebounding around bands by creating an EA to automatically place orders. The following are how we can code this trading system:
We will include the trade file by using the preprocessor include
#include <trade/trade.mqh> Declaring inputs for moving average period, channel multiplier, ATR for bands calculation or not, moving average mode, price type, lot size, stop loss pips, and take profit pips
input int      maPeriod            = 10;           // Moving Average Period
input double   multiInp             = 2.0;          // Channel multiplier
input bool     isAtr                 = false;        // ATR
input ENUM_MA_METHOD     maMode       = MODE_EMA;     // Moving Average Mode
input ENUM_APPLIED_PRICE priceType = PRICE_TYPICAL;// Price Type
input double      lotSize=1;
input double slPips = 150;
input double tpPips = 300;
Declaring global variables for Keltner, barTotal, and trade object
int keltner;
int barsTotal;
CTrade trade;
In the OnInit() function we will define the barsTotal variable to be used later in evaluating if there is a new bar or not by using the iBars function and its parameters are:
- symbol: to determine the symbol to apply the code on and we will use _Symbol to be applied on the current symbol.
- timeframe: to determine the period and we will use PERIOD_CURRENT to be applied for the current time frame.
barsTotal=iBars(_Symbol,PERIOD_CURRENT);
Defining the Keltner variable to be used as the indicator handle by using the iCustom function and its parameters are:
- symbol: to determine the symbol name and _Symbl will be used to be applied for the current symbol.
- period: to set the time frame we will use PERIOD_CURRENT.
- name: to specify the indicator name.
- ...: list of indicator inputs.
keltner = iCustom(_Symbol,PERIOD_CURRENT,"Custom_Keltner_Channel",maPeriod,multiInp, isAtr, maMode, priceType);
In the OnDeinit function, we will print a message when removing the EA
Print("EA is removed");
In the OnTick() function, we will declare and define an integer variable of bars to be compared to barsTotal to check if there is a new bar
int bars=iBars(_Symbol,PERIOD_CURRENT);
Comparing barsTotal to bars if it is less than bars
if(barsTotal < bars) If the barsTotal is less than the bars we need to assign the bars value to barsTotal
barsTotal=bars;
Then declare the three arrays for upper, middle, and lower
double upper[], middle[], lower[]; Getting data of the indicator buffers by using the CopyBuffer function and its parameters are:
- indicator_handle: to determine the indicator handle we will use Keltner for upper, middle, and lower.
- buffer_num: to specify the buffer number of the indicator and it will be 0 for upper, 1 for middle, and 2 for lower.
- start_pos: to specify the position to start from counting and we will use 0.
- count: to specify the amount that we need to copy and we will use 3.
- buffer[]: to specify the target array to copy and we will use upper, middle, and lower arrays.
      CopyBuffer(keltner,0,0,3,upper);
      CopyBuffer(keltner,1,0,3,middle);
      CopyBuffer(keltner,2,0,3,lower);
Setting the AS_SERIES flag by using the ArraySetAsSeries function
      ArraySetAsSeries(upper,true);
      ArraySetAsSeries(middle,true);
      ArraySetAsSeries(lower,true);
Declaring and defining prevUpper, middle, and lower values for the previous of the last value of the indicator values
      double prevUpperValue = NormalizeDouble(upper[2], 5);
      double prevMiddleValue = NormalizeDouble(middle[2], 5);
      double prevLowerValue = NormalizeDouble(lower[2], 5);
Declaring and defining upper, middle, and lower values for the the last value of the indicator values
      double upperValue = NormalizeDouble(upper[1], 5);
      double middleValue = NormalizeDouble(middle[1], 5);
      double lowerValue = NormalizeDouble(lower[1], 5);
Declaring and defining the last and the previous of the last of the closing prices by using the iClose function and its parameters are:
- symbol: to specify the symbol name.
- timeframe: to specify the period to be applied.
- shift: to specify if we need a shift backward or not by specifying the index.
      double lastClose=iClose(_Symbol,PERIOD_CURRENT,1);
      double prevLastClose=iClose(_Symbol,PERIOD_CURRENT,2);
Setting conditions of the strategy to place a buy order if the previous of the last closing price is lower than the previous of the last lower value and the last closing price is greater than the last lower value
      if(prevLastClose<prevLowerValue && lastClose>lowerValue)
        {
         double ask = SymbolInfoDouble(_Symbol,SYMBOL_ASK);
         double slVal = lowerValue - slPips*_Point;
         double tpVal = middleValue + tpPips*_Point;
         trade.Buy(lotSize,_Symbol,ask,slVal,tpVal);
        }
Setting conditions of the strategy to place a sell order if the previous of the last closing price is greater than the previous of the last upper value and the last closing price is lower than the last upper value
      if(prevLastClose>prevUpperValue && lastClose<upperValue)
        {
         double bid = SymbolInfoDouble(_Symbol,SYMBOL_BID);
         double slVal = upperValue + slPips*_Point;
         double tpVal = middleValue - tpPips*_Point;
         trade.Sell(lotSize,_Symbol,bid,upperValue,tpVal);
        }
So, the following is the full code in one block for creating a trading system based on Bands rebound strategy
//+------------------------------------------------------------------+
//|                                       Keltner_Trading_System.mq5 |
//+------------------------------------------------------------------+
#include <trade/trade.mqh>
input int      maPeriod            = 10;           // Moving Average Period
input double   multiInp             = 2.0;          // Channel multiplier
input bool     isAtr                 = false;        // ATR
input ENUM_MA_METHOD     maMode       = MODE_EMA;     // Moving Average Mode
input ENUM_APPLIED_PRICE priceType = PRICE_TYPICAL;// Price Type
input double      lotSize=1;
input double slPips = 150;
input double tpPips = 300;
int keltner;
int barsTotal;
CTrade trade;
int OnInit()
  {
   barsTotal=iBars(_Symbol,PERIOD_CURRENT);
   keltner = iCustom(_Symbol,PERIOD_CURRENT,"Custom_Keltner_Channel",maPeriod,multiInp, isAtr, maMode, priceType);
   return(INIT_SUCCEEDED);
  }
//+------------------------------------------------------------------+
void OnDeinit(const int reason)
  {
   Print("EA is removed");
  }
//+------------------------------------------------------------------+
void OnTick()
  {
   int bars=iBars(_Symbol,PERIOD_CURRENT);
   if(barsTotal < bars)
     {
      barsTotal=bars;
      double upper[], middle[], lower[];
      CopyBuffer(keltner,0,0,3,upper);
      CopyBuffer(keltner,1,0,3,middle);
      CopyBuffer(keltner,2,0,3,lower);
      ArraySetAsSeries(upper,true);
      ArraySetAsSeries(middle,true);
      ArraySetAsSeries(lower,true);
      double prevUpperValue = NormalizeDouble(upper[2], 5);
      double prevMiddleValue = NormalizeDouble(middle[2], 5);
      double prevLowerValue = NormalizeDouble(lower[2], 5);
      double upperValue = NormalizeDouble(upper[1], 5);
      double middleValue = NormalizeDouble(middle[1], 5);
      double lowerValue = NormalizeDouble(lower[1], 5);
      double lastClose=iClose(_Symbol,PERIOD_CURRENT,1);
      double prevLastClose=iClose(_Symbol,PERIOD_CURRENT,2);
      if(prevLastClose<prevLowerValue && lastClose>lowerValue)
        {
         double ask = SymbolInfoDouble(_Symbol,SYMBOL_ASK);
         double slVal = lowerValue - slPips*_Point;
         double tpVal = middleValue + tpPips*_Point;
         trade.Buy(lotSize,_Symbol,ask,slVal,tpVal);
        }
      if(prevLastClose>prevUpperValue && lastClose<upperValue)
        {
         double bid = SymbolInfoDouble(_Symbol,SYMBOL_BID);
         double slVal = upperValue + slPips*_Point;
         double tpVal = middleValue - tpPips*_Point;
         trade.Sell(lotSize,_Symbol,bid,upperValue,tpVal);
        }
     }
  }
//+------------------------------------------------------------------+
Strategy two: Bands breakout trading system:
The first strategy the same as we mentioned is to consider opening trades based on breaking above or below bands by creating an EA to automatically place orders. The following are for differences when coding this trading system:
Conditions of placing buy order only when the EA finds first the previous of the last close closed below the previous of the last upper band then the last close closed above the last upper band
      if(prevLastClose<prevUpperValue && lastClose>upperValue)
        {
         double ask = SymbolInfoDouble(_Symbol,SYMBOL_ASK);
         double slVal = upperValue - slPips*_Point;
         double tpVal = upperValue + tpPips*_Point;
         trade.Buy(lotSize,_Symbol,ask,slVal,tpVal);
        }
Conditions of placing sell order only when the EA finds first the previous of the last close closed above the previous of the last lower band then the last close closed below the last lower band
      if(prevLastClose>prevLowerValue && lastClose<lowerValue)
        {
         double bid = SymbolInfoDouble(_Symbol,SYMBOL_BID);
         double slVal = lowerValue + slPips*_Point;
         double tpVal = lowerValue - tpPips*_Point;
         trade.Sell(lotSize,_Symbol,bid,upperValue,tpVal);
        }
So, the following is the full code for creating a trading system based on Bands rebound strategy:
//+------------------------------------------------------------------+
//|                                      Keltner_Trading_System2.mq5 |
//+------------------------------------------------------------------+
#include <trade/trade.mqh>
input int      maPeriod            = 10;           // Moving Average Period
input double   multiInp             = 2.0;          // Channel multiplier
input bool     isAtr                 = false;        // ATR
input ENUM_MA_METHOD     maMode       = MODE_EMA;     // Moving Average Mode
input ENUM_APPLIED_PRICE priceType = PRICE_TYPICAL;// Price Type
input double      lotSize=1;
input double slPips = 150;
input double tpPips = 500;
int keltner;
int barsTotal;
CTrade trade;
int OnInit()
  {
   barsTotal=iBars(_Symbol,PERIOD_CURRENT);
   keltner = iCustom(_Symbol,PERIOD_CURRENT,"Custom_Keltner_Channel",maPeriod,multiInp, isAtr, maMode, priceType);
   return(INIT_SUCCEEDED);
  }
//+------------------------------------------------------------------+
void OnDeinit(const int reason)
  {
   Print("EA is removed");
  }
//+------------------------------------------------------------------+
void OnTick()
  {
   int bars=iBars(_Symbol,PERIOD_CURRENT);
   if(barsTotal < bars)
     {
      barsTotal=bars;
      double upper[], middle[], lower[];
      CopyBuffer(keltner,0,0,3,upper);
      CopyBuffer(keltner,1,0,3,middle);
      CopyBuffer(keltner,2,0,3,lower);
      ArraySetAsSeries(upper,true);
      ArraySetAsSeries(middle,true);
      ArraySetAsSeries(lower,true);
      double prevUpperValue = NormalizeDouble(upper[2], 5);
      double prevMiddleValue = NormalizeDouble(middle[2], 5);
      double prevLowerValue = NormalizeDouble(lower[2], 5);
      double upperValue = NormalizeDouble(upper[1], 5);
      double middleValue = NormalizeDouble(middle[1], 5);
      double lowerValue = NormalizeDouble(lower[1], 5);
      double lastClose=iClose(_Symbol,PERIOD_CURRENT,1);
      double prevLastClose=iClose(_Symbol,PERIOD_CURRENT,2);
      if(prevLastClose<prevUpperValue && lastClose>upperValue)
        {
         double ask = SymbolInfoDouble(_Symbol,SYMBOL_ASK);
         double slVal = upperValue - slPips*_Point;
         double tpVal = upperValue + tpPips*_Point;
         trade.Buy(lotSize,_Symbol,ask,slVal,tpVal);
        }
      if(prevLastClose>prevLowerValue && lastClose<lowerValue)
        {
         double bid = SymbolInfoDouble(_Symbol,SYMBOL_BID);
         double slVal = lowerValue + slPips*_Point;
         double tpVal = lowerValue - tpPips*_Point;
         trade.Sell(lotSize,_Symbol,bid,upperValue,tpVal);
        }
     }
  }
//+------------------------------------------------------------------+
Now, we will test these EAs of two trading strategies on the gold (XAUUSD), (EURUSD), (GBPUSD) using the 1H time frame with the default settings of inputs for the period from 1 Jan 2023 to 31 Dec 2023,
We will focus on the following key measurements to make a comparison between the two:
- Net Profit: It is calculated by subtracting the gross loss from the gross profit. The highest value is the best.
- Balance DD relative: It is the maximum loss that the account experiences during trades. The lowest is the best.
- Profit factor: It is the ratio of gross profit to gross loss. The highest value is the best.
- Expected payoff: It is the average profit or loss of a trade. The highest value is the best.
- Recovery factor: It measures how well the tested strategy will recover after experiencing losses. The highest one is the best.
- Sharpe Ratio: It determines the risk and stability of the tested trading system by comparing the return versus the risk-free return. The highest Sharpe Ratio is the best.
Strategy one: Bands rebound testing:
XAUUSD testing
We can find the results of (XAUUSD) testing the same as the following:

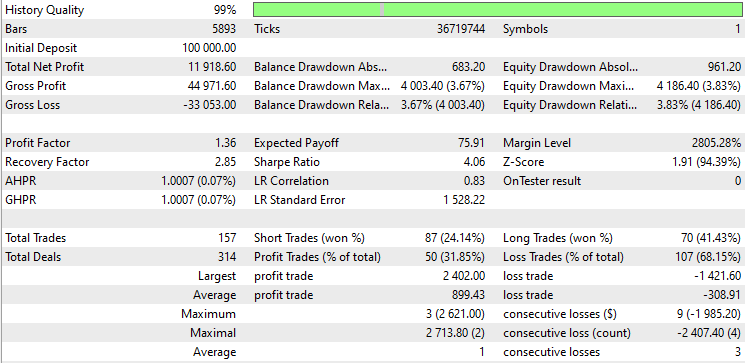
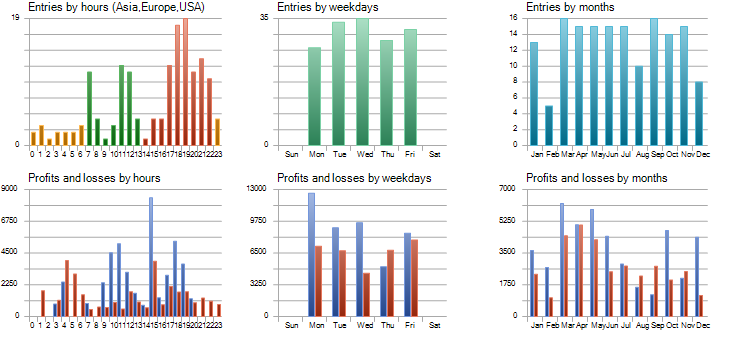
As we can see from the previous results of XAUUSD testing that we have important figures in testing are the same as the following
- Net Profit: 11918.60 USD.
- Balance DD relative: 3.67%.
- Profit factor: 1.36.
- Expected payoff: 75.91.
- Recovery factor:2.85.
- Sharpe Ratio: 4.06.
EURUSD testing
We can find the results of (EURUSD) testing the same as the following:
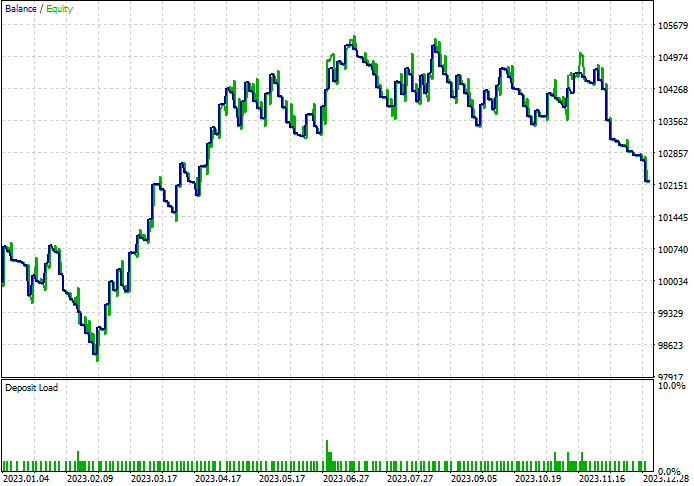
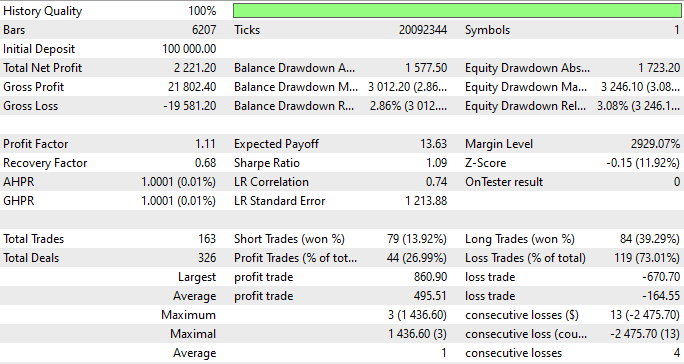
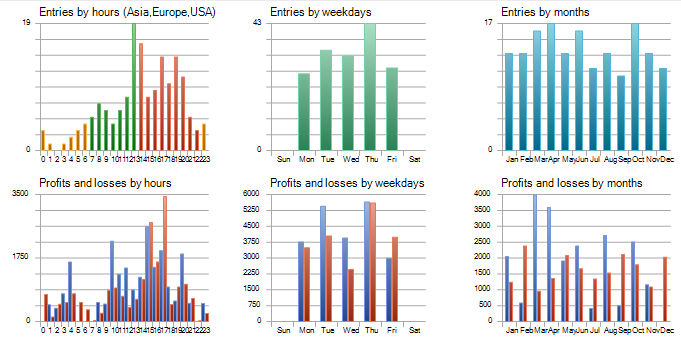
As we can see from the previous results of EURUSD testing that we have important figures in testing are the same as the following
- Net Profit: 2221.20 USD.
- Balance DD relative: 2.86%.
- Profit factor: 1.11.
- Expected payoff: 13.63.
- Recovery factor: 0.68.
- Sharpe Ratio: 1.09.
GBPUSD testing
We can find the results of (GBPUSD) testing the same as the following: 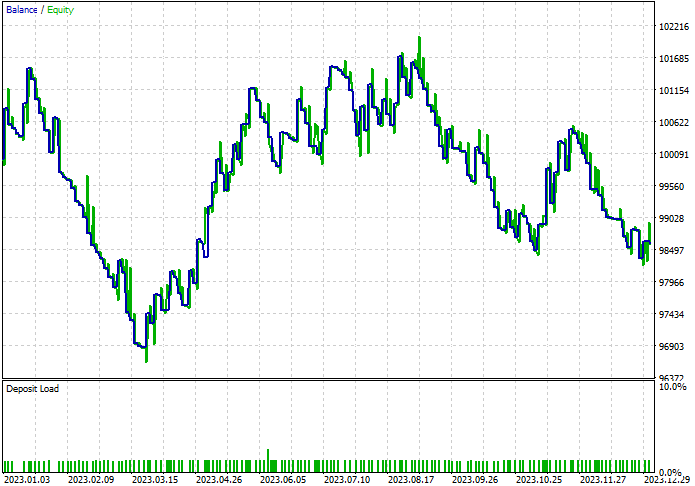
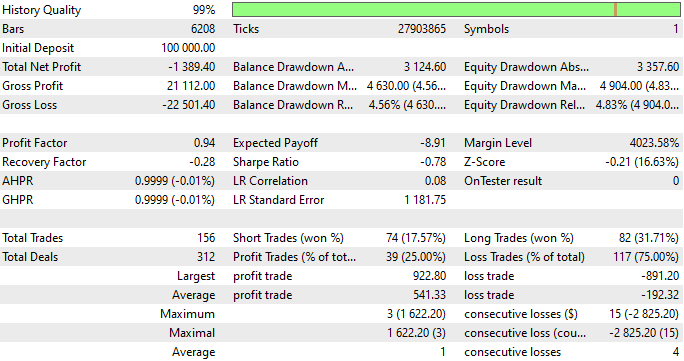
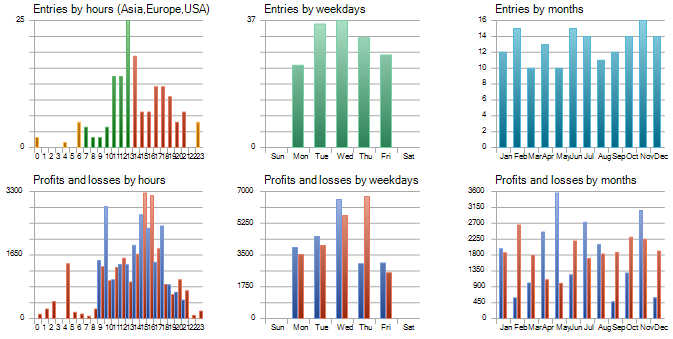
As we can see from the previous results of GBPUSD testing that we have important figures in testing are the same as the following
- Net Profit: -1389.40 USD.
- Balance DD relative: 4.56%.
- Profit factor: 0.94.
- Expected payoff: -8.91.
- Recovery factor: -0.28.
- Sharpe Ratio: -0.78.
Strategy two: Bands breakout testing:
XAUUSD testing
We can find graphs for the results of (XAUUSD) testing the same as the following:
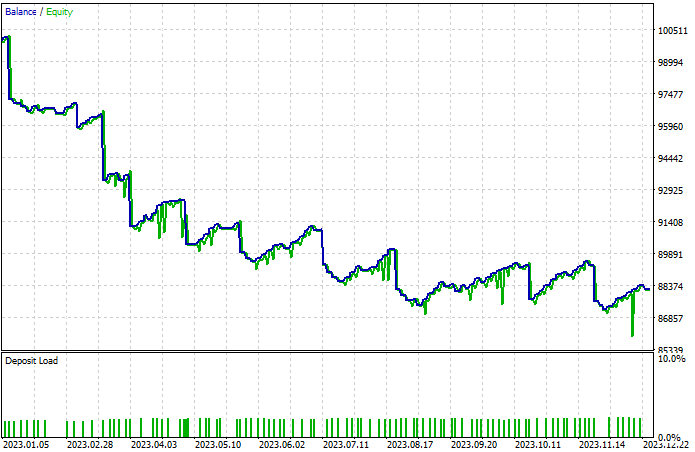
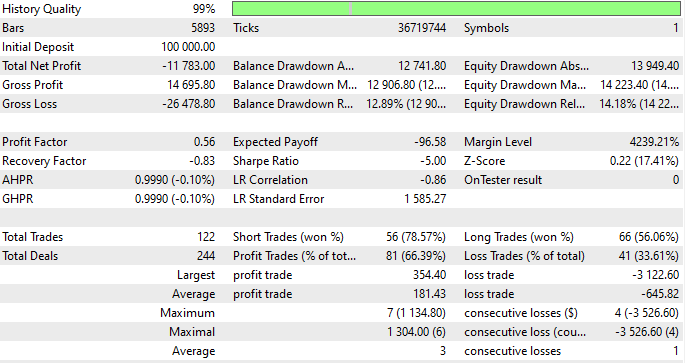
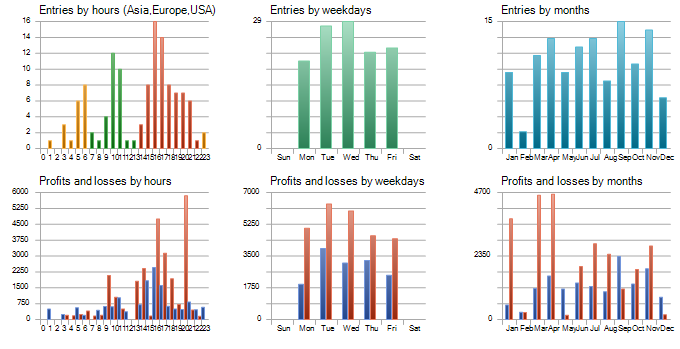
As we can see from the previous results of XAUUSD testing that we have important figures in testing are the same as the following
- Net Profit: -11783 USD.
- Balance DD relative: 12.89%.
- Profit factor: 0.56.
- Expected payoff: -96.58.
- Recovery factor: -0.83.
- Sharpe Ratio: -5.00.
EURUSD testing
We can find graphs for the results of (EURUSD) testing the same as the following:
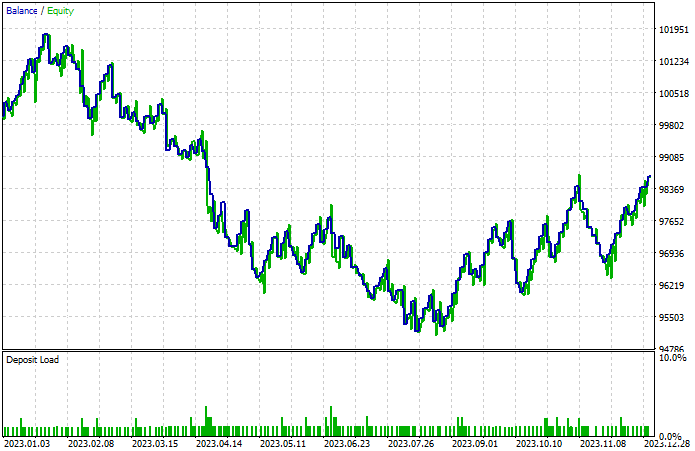
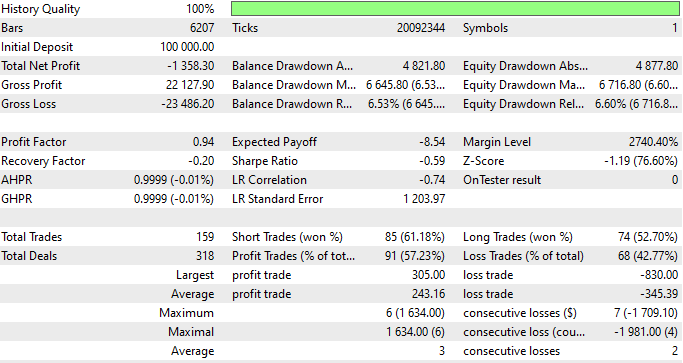
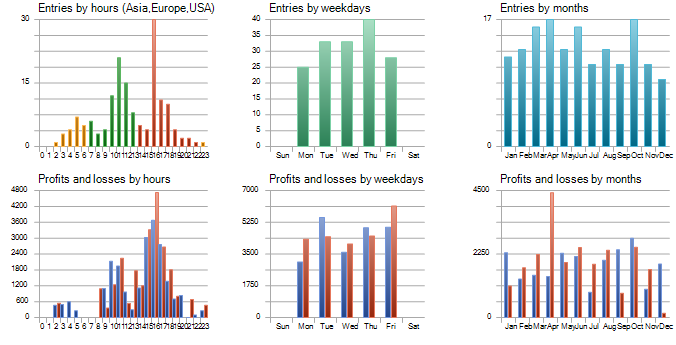
As we can see from the previous results of EURUSD testing that we have important figures in testing are the same as the following
- Net Profit: -1358.30 USD.
- Balance DD relative: 6.53%.
- Profit factor: 0.94.
- Expected payoff: -8.54.
- Recovery factor: -0.20.
- Sharpe Ratio: -0.59.
GBPUSD testing
We can find graphs for the results of (GBPUSD) testing the same as the following:
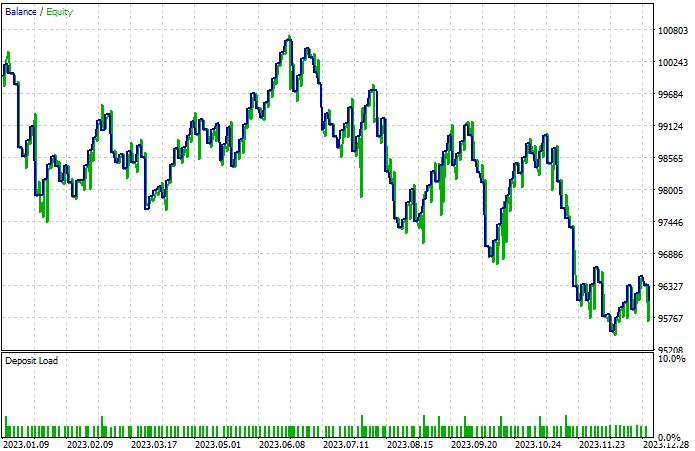
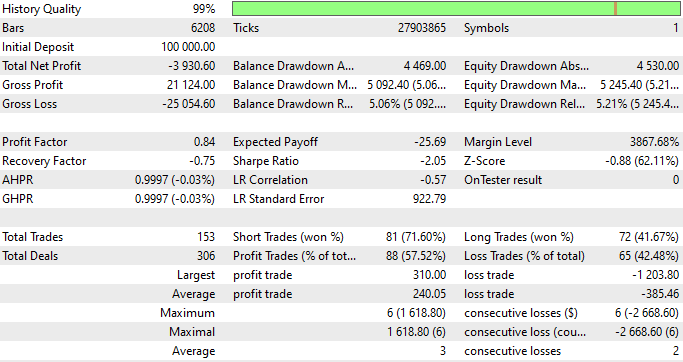
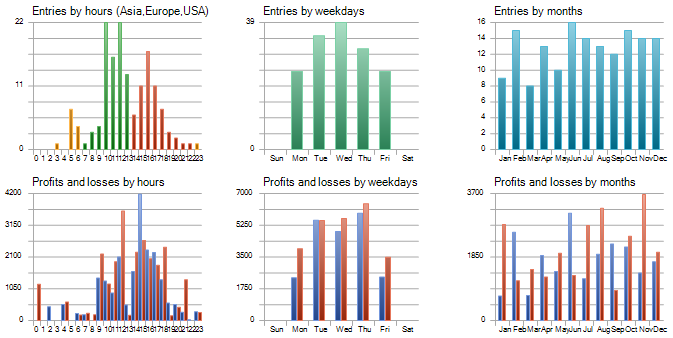
As we can see from the previous results of GBPUSD testing that we have important figures in testing are the same as the following
- Net Profit: -3930.60 USD.
- Balance DD relative: 5.06%.
- Profit factor: 0.84.
- Expected payoff: -25.69.
- Recovery factor: -0.75.
- Sharpe Ratio: -2.05.
According to what we see in previous strategies testing for more than one instrument we can find all results in one table to compare them easily the same as below:

- Net Profit: The best higher figure (11918.60 USD) is shown with the Bands rebound strategy when tested on the XAUUSD asset.
- Balance DD Relative: The best lower figure (2.86 %) is shown with the Bands rebound strategy when tested on the EURUSD asset.
- Profit Factor: The best higher figure (1.36) is shown with the Bands rebound strategy when tested on the XAUUSD asset.
- Expected Payoff: The higher figure (75.91) is shown with the Bands rebound strategy when tested on the XAUUSD asset
- Recovery Factor: The higher figure (2.85) is shown with the Bands rebound strategy when tested on the XAUUSD asset
- Sharpe Ratio: The higher figure (4.06) is shown with the Bands rebound strategy when tested on the XAUUSD asset.
As per what we can see the best strategy is the bands rebound strategy with XAUUSD or optimize strategies and retest them according to your preferences to meet your trading objectives if you want to see better results and settings.
Conclusion
As traders, it is very important to have a reliable trading system and if this trading system includes and measures every important aspect such as volatility and others, this increases its reliability.
In this article, we have tried to provide the results of testing simple strategies based on the Keltner Channel indicator to give you an idea of how you can incorporate or use the trading system based on this important concept, after identifying the indicator in detail, how it can be used based on its main concept and how we can calculate it.
We have mentioned the following strategies:
- Bands rebound: We will place a buy order on a rebound above the lower band and a sell order on a rebound below the upper band.
- Bands breakout: We place a buy order when the upper band is broken and a sell order when the lower band is broken.
We then tested them and based on the results of the results of each strategy, we identified important figures for many financial instruments (XAUUSD, EURUSD, and GBPUSD) to know which one is better accordingly.
It is crucial to understand that these mentioned strategies may need more optimization and more effort to find better results for our trading systems because the main objective of this article as we mentioned earlier is to share what we can do by sharing some trading ideas that can open our minds to build or develop better trading systems.
I hope you found this article useful in your trading and coding learning journey to get better, more reliable, and more effective results, if you found this article useful and you need to read more about building trading systems based on different strategies and different technical indicators, especially the most popular ones, you can read my previous articles by checking my publication page to find many articles in this regard about the most popular technical indicators and I hope you find them useful for you.
Warning: All rights to these materials are reserved by MetaQuotes Ltd. Copying or reprinting of these materials in whole or in part is prohibited.
This article was written by a user of the site and reflects their personal views. MetaQuotes Ltd is not responsible for the accuracy of the information presented, nor for any consequences resulting from the use of the solutions, strategies or recommendations described.
 Implementing the Generalized Hurst Exponent and the Variance Ratio test in MQL5
- Free trading apps
- Over 8,000 signals for copying
- Economic news for exploring financial markets
You agree to website policy and terms of use