
Price Action Analysis Toolkit Development (Part 52): Master Market Structure with Multi-Timeframe Visual Analysis

Contents
- Introduction
- Features Overview
- Settings and Parameters
- Code Architecture
- User Experience and Workflow
- Outcomes
- Conclusion
Introduction
Multi‑timeframe analysis has long been a core method for traders who want a more profound understanding of market direction. A signal that looks strong on a lower timeframe can quickly lose appeal when viewed against the trend of a higher one. Many traders have experienced an M15 setup that fails because H1 or H4 are moving in the opposite direction. Confirming alignment across multiple time horizons often makes the difference between a trade that works and one that fails. In trading circles, the topic has been explored in various ways. Some approaches rely on numeric comparisons and calculated statistics, while others present symbolic indicators or trend readings. My own published works have also touched on multi‑timeframe confirmation, using different logical angles in each case. The Timeframe Visual Analyzer( the expert advisor I am introducing), builds on that collective foundation, taking a fresh route by turning those relationships between timeframes into something visually clear and interactive.
One of the most common frustrations for active traders is the need to constantly switch between charts to grasp the bigger picture. This breaks focus and slows reaction time, a costly delay in fast markets. In the short time spent moving between tabs, the best setup can vanish or an early reversal can go unnoticed. This tool removes that barrier by overlaying two higher‑timeframe candle sets (HTF1 and HTF2) right onto the chart in use. Each candle is drawn to accurate scale, with bodies and wicks marked in distinct bullish and bearish colors, and transparency blending to keep the underlying price action visible. The Timeframe Visual Analyzer is a drawing tool, and it includes a continuous confirmation engine. It checks whether the current timeframe and both selected higher timeframes share the same directional bias, meeting a pip‑movement threshold set by the user. When alignment is detected, it triggers alerts in the chosen form—chart labels, sound notifications, push messages, or emails. An optional opposite‑direction alert can flag possible reversals early, providing a practical warning before sentiment fully shifts.
Ease of interaction was a key part of its design. Three compact on‑chart buttons control visibility for HTF1, HTF2, and alerts without requiring settings changes or reloading. Toggle states are saved through global variables, ensuring the preferred configuration remains active between sessions. Performance safeguards such as adjustable refresh rates and the option to draw only visible bars keep updates smooth and responsive. This tool draws on ideas explored across the trading community and in earlier works but applies a new logic shaped by visual clarity, instant feedback, and seamless chart integration. Whether used by scalpers looking for fast trend confirmation, swing traders aligning with broader moves, or educators demonstrating price flow between larger and smaller candles, it makes multi‑timeframe awareness a natural, effortless part of reading the market.
Features Overview
The Timeframe Visual Analyzer was created to let traders read multiple timeframes in a way that’s quick, straightforward, and doesn’t require constantly jumping between charts. Every part of the tool is shaped with one aim—to present higher‑timeframe information clearly on your working chart while still giving the depth of analysis needed for confident decisions. In the pages that follow, we’ll walk through its main features and how each one plays a role in making trading more intuitive and efficient.
1. Multi‑Timeframe Candle Overlay
The analyzer’s main function is to overlay higher‑timeframe candles onto the current chart, providing a constant visual link between short‑term price action and larger trends. Traders can select two custom timeframes—HTF1 and HTF2—and visualize their bodies and wicks without changing charts. Each candle obeys accurate timestamp boundaries so that higher‑timeframe actions align precisely with lower‑timeframe movement. Bullish candles and bearish candles are rendered with distinguishable colors and transparency defined by the user, creating an intuitive, layered view of market activity. This delivers immediate context; it’s easy to see whether smaller candles are confirming or contradicting the broader trend.
2. Customizable Visual Styling
Every trader reads charts differently. The analyzer allows complete control over color selection, wick width, and transparency levels for each timeframe. Bullish and bearish body colors can be set independently from wick colors, enabling users to build highly personalized chart themes that fit both individual preference and visual accessibility. Transparency (alpha) blending ensures that higher‑timeframe candles do not dominate or obscure the base chart. The result is a balanced overlay that enhances insight without visual clutter.
3. Real‑Time Refresh System
Markets move quickly, and higher‑timeframe overlays need to adjust dynamically. The indicator’s refresh routine is event‑driven using timed updates, meaning new candles are drawn in near real‑time. Users can control the refresh interval in seconds, allowing either continuous rendering for active intraday trading or slower updates for longer‑term analysis. The script also includes an option to draw only visible bars—improving performance by focusing calculations on what the user actually sees, not the entire historical dataset.
4. Interactive Chart Controls
Three compact buttons appear in the corner of the chart once the indicator is loaded. These provide direct control over the visibility of HTF1, HTF2, and alert functionality. With a simple click, a trader can switch display modes without reopening settings or stopping the indicator. Button colors reflect status: green when active, red when off. It’s a small design touch that makes a significant difference in usability, allowing quick adjustments without interrupting workflow.
5. Persistent State Management
Trading setups and chart preferences deserve consistency. The analyzer automatically saves toggle states and visibility choices using internal global variables. When the chart or platform is closed, these settings are restored the next time the indicator is attached. This persistent memory ensures uninterrupted continuity—traders can pick up exactly where they left off, even across multiple sessions or charts.
6. Multi‑Timeframe Direction Confirmation
Beyond visualization, the indicator includes logic for directional confirmation. It compares the bullish or bearish bias of the current timeframe against both selected higher timeframes. If all three share the same direction—meaning current price action harmonizes with HTF1 and HTF2—the analyzer recognizes this as a technical confirmation. The feature acts as a quick filter, helping traders avoid entries that go against higher‑timeframe momentum. Parameters such as minimum pip movement can be defined to prevent signals based on marginal changes.
7. Alert and Notification System
When alignment occurs, the analyzer can notify traders through several methods
- Sound Alerts: Play a predefined sound file (e.g., alert.wav) to signal confirmation.
- Push Notifications: Send messages directly to the mobile MetaTrader terminal.
- Email Alerts: Deliver notifications to configured addresses for remote monitoring.
- On‑Chart Labels: Change dynamically, displaying “MTF CONFIRM: BULL” or “MTF CONFIRM: BEAR” alongside a timestamp.
These alerts make sure no synchronized opportunity passes unnoticed. For risk management and countertrend strategies, there is also an opposite‑direction alert feature—useful when higher timeframes begin reversing against the current bias.
8. Debug Logging and Technical Transparency
For developers and advanced users, a dedicated debug system can be activated. When enabled, the indicator prints time‑stamped informational messages to the terminal log. This helps track refresh events, drawing operations, and alert conditions. It’s a valuable tool for diagnosing custom edits or monitoring internal behavior, especially when merging the analyzer with other scripts or expert advisors.
9. Performance and Optimization Controls
Visual indicators can be demanding when working with numerous bars and high‑resolution charts. Performance has been optimized through selective rendering and controlled object management. The script identifies relevant objects by prefix tags and safely clears outdated ones, ensuring charts remain clean and responsive. Using transparency and object reuse also prevents overlapping artifacts that often slow the terminal. Combined, these optimization choices allow the analyzer to run efficiently even during heavy market updates.
10. Seamless Integration into Existing Workflows
The Timeframe Visual Analyzer does not require special templates or dependencies. It integrates smoothly with standard MetaTrader charting environments. This flexibility means traders can use it alongside other indicators or EAs without conflict. Its modular structure—controlled by clear input groups—makes customization straightforward. From minimalist setups to multi‑indicator dashboards, it fits naturally into differing workflows and chart styles.
The collective result of these features is a tool that transforms multi‑timeframe awareness into something visual, responsive, and practical. Instead of comparing numbers or switching charts, traders can read alignment directly from color, shape, and timing cues on their active chart. Every feature is designed around clarity and simplicity—allowing decisions to come from what the market shows, not just what formulas calculate.
Settings and Parameters
The Timeframe Visual Analyzer was designed with flexibility at its core. All input options are neatly grouped, making it easy for traders to locate and adjust the settings that matter to them. This structure means you can fine‑tune how the tool behaves without needing to sift through unrelated parameters. Each group affects a different aspect of the indicator—from which timeframes are used, to the appearance of the candles to alert behavior and performance control.
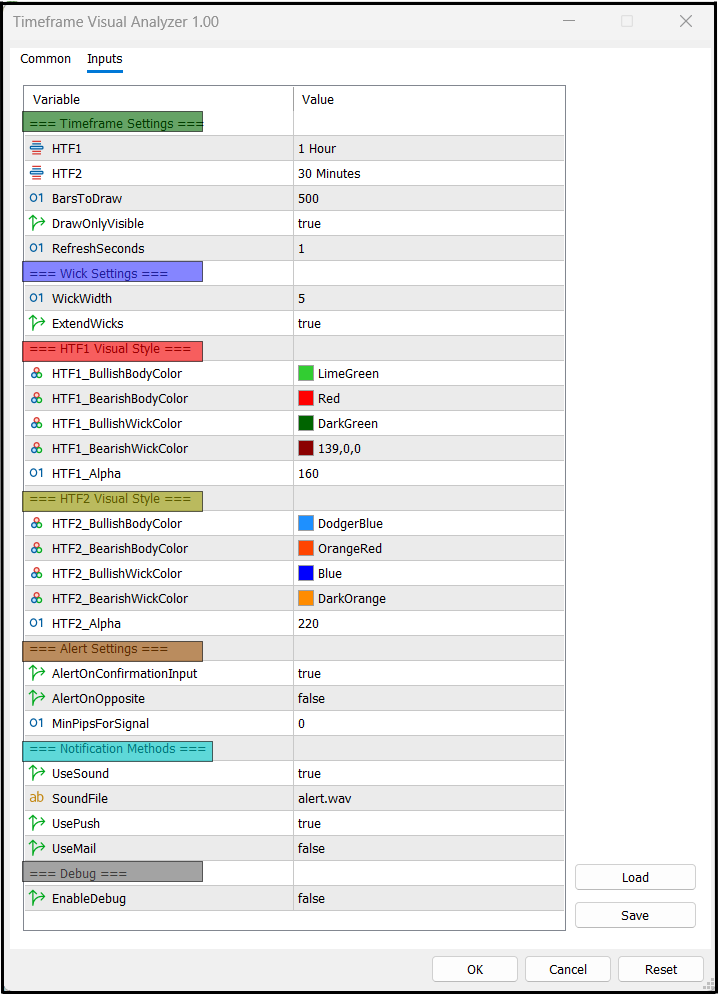
1. Timeframe Settings
This group determines the two higher timeframes (HTF1 and HTF2) drawn on your chart, the number of historical candles displayed, and how often the indicator refreshes. Choosing the right timeframes depends on trading style. Short‑term traders might overlay M30 and H1 to align lower timeframe entries with medium‑term momentum. Longer‑term traders could use H4 and D1 overlays to maintain awareness of the bigger picture.
- BarsToDraw sets how many historical higher‑timeframe candles will be shown. Too many can clutter the chart or slow the terminal; too few may limit historical context.
- DrawOnlyVisible tells the indicator to focus only on candles that are actually visible on screen, plus a margin, which improves performance when scrolling.
- RefreshSeconds controls how quickly the overlay updates. Faster refresh rates (e.g., 1 second) are ideal for active trading, while slower rates reduce processing load when monitoring extended moves.
// === Timeframe Settings ===
input ENUM_TIMEFRAMES HTF1 = PERIOD_H1;      // First higher timeframe
input ENUM_TIMEFRAMES HTF2 = PERIOD_M30;     // Second higher timeframe
input int  BarsToDraw = 500;                 // Candles to render
input bool DrawOnlyVisible = true;           // Only draw visible bars
input int  RefreshSeconds = 1;               // Refresh interval in seconds
2. Wick Settings
Wicks often hold important clues about market sentiment, showing intra‑candle highs and lows beyond the body’s open and close.
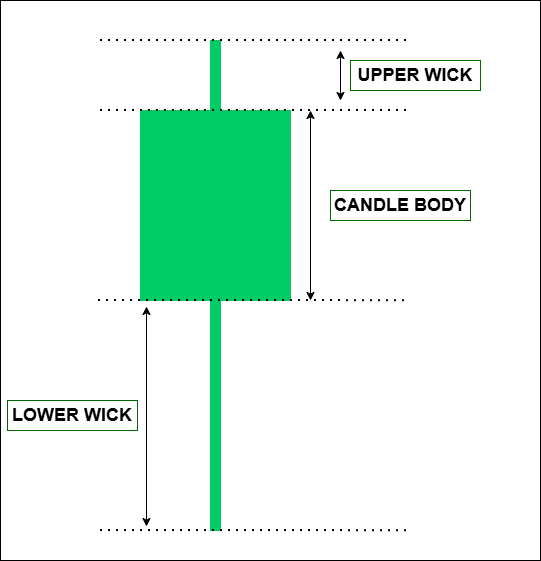
This group allows fine control over wick appearance. WickWidth sets how thick the wick lines should be; thicker wicks stand out more but may dominate visually, so balance is important. ExtendWicks adds a small extension beyond their true values for visibility, useful when candles are small or prices are tightly ranged.
// === Wick Settings ===
input int  WickWidth = 5;      // Wick thickness
input bool ExtendWicks = true; // Extend wick length slightly
3. HTF1 Visual Style
Customizing how HTF1 candles appear ensures the overlay blends with your existing chart setup. You can set bullish and bearish body colors independently, as well as matching or contrasting wick colors. Transparency (HTF1_Alpha) determines how much of the underlying timeframe is visible behind the higher‑timeframe candle; lower values make overlays subtle, higher values make them stand out.
// === HTF1 Visual Style ===
input color HTF1_BullishBodyColor = clrLimeGreen;
input color HTF1_BearishBodyColor = clrRed;
input color HTF1_BullishWickColor = clrDarkGreen;
input color HTF1_BearishWickColor = clrDarkRed;
input uint  HTF1_Alpha = 160; // Transparency 0–255
5. Alert Settings
Alerts are generated based on the alignment of candle directions across your selected timeframes. AlertOnConfirmationInput fires signals when the current timeframe, HTF1, and HTF2 are all moving in the same direction. AlertOnOpposite detects when higher timeframes flip against the previously confirmed trend, signaling a possible reversal. MinPipsForSignal ensures alerts are only triggered by meaningful price movements, filtering out low‑volatility noise.
// === Alert Settings ===
input bool AlertOnConfirmationInput = true; // Confirmed alignment
input bool AlertOnOpposite = false;         // Opposite bias alerts
input int  MinPipsForSignal = 0;            // Minimum pip criteria
6. Notification Methods
When alerts fire, the indicator can notify through various channels. UseSound triggers a local audible file defined by SoundFile. UsePush sends a push notification to your MetaTrader mobile app, and UseMail delivers an email—both require proper configuration in platform settings.
// === Notification Methods ===
input bool   UseSound = true;
input string SoundFile = "alert.wav";
input bool   UsePush = true;
input bool   UseMail = false;
7. Debug
For traders who want transparency into the indicator’s behavior or developers modifying the code, EnableDebug prints detailed runtime events to the terminal log. This is especially useful for diagnosing performance issues or verifying logic when integrating with other tools.
// === Debug ===
input bool EnableDebug = false;
Code Architecture
The Timeframe Visual Analyzer is built with a clear modular structure, allowing each part of the code to handle a specific responsibility. This design ensures the indicator remains maintainable, scalable, and easy to extend for future improvements. Rather than being a single long block of commands, the code is divided into functions and event handlers that work together to deliver real‑time multi‑timeframe overlays and alerts.
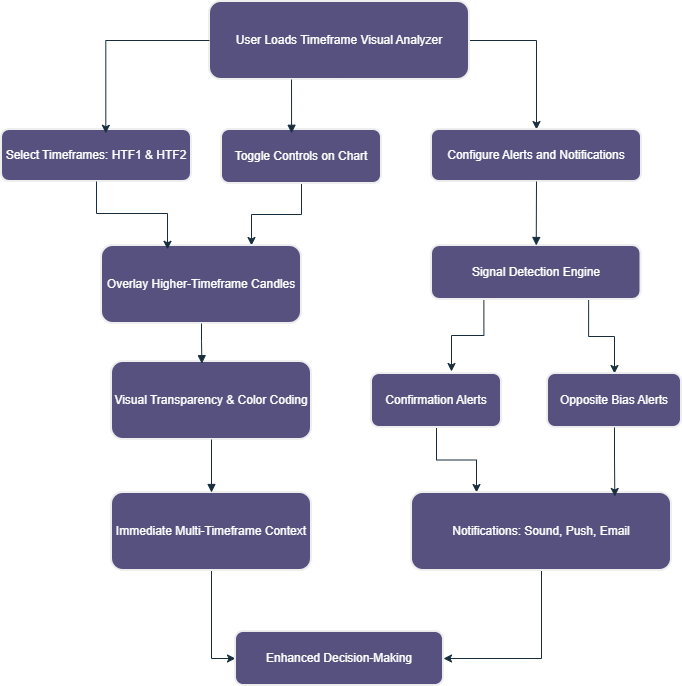
The indicator’s operation is organized into a repeating workflow based on the MetaTrader 5 event model:
- Initialize
- Draw/Update
- Monitor Signals
- Trigger Alerts
- Clean Up.
Understanding this flow helps traders and developers see how the script performs its tasks in real time.
Initialization (OnInit)
When the indicator is first loaded, the OnInit() function sets up the environment:
- Reads and stores all input parameters.
- Creates toggle buttons for HTF1, HTF2, and alerts.
- Loads saved visibility states from global variables to restore previous configurations.
- Calls the main drawing functions for HTF1 and HTF2 to render historical candles.
- Starts a timer to schedule periodic updates.
This approach means the chart is populated instantly with historical overlays and is ready to respond immediately when the market moves.
int OnInit()
{
   // Load saved states
   HTF1Enabled = GlobalVariableGet(gvPrefix+"HTF1Enabled") > 0;
   HTF2Enabled = GlobalVariableGet(gvPrefix+"HTF2Enabled") > 0;
   AlertsEnabled = GlobalVariableGet(gvPrefix+"AlertsEnabled") > 0;

   // Create chart buttons
   CreateButtons();

   // Draw historical candles
   DrawHTF(HTF1);
   DrawHTF(HTF2);

   // Start refresh timer
   EventSetTimer(RefreshSeconds);

   return(INIT_SUCCEEDED);
}
Periodic Updates (OnTimer)
The indicator relies on a timer to improve responsiveness without redrawing unnecessarily. Each time the timer fires:
- The visible portion of the chart is identified (ChartGetInteger for first and last visible bar).
- HTF1 and HTF2 overlays are updated with any new candles.
- Signal checks are performed; if conditions are met, alerts are triggered.
This approach is resource‑efficient compared to constant OnCalculate updates, particularly for overlays that don’t need every tick.
void OnTimer()
{
   if(HTF1Enabled) DrawHTF(HTF1);
   if(HTF2Enabled) DrawHTF(HTF2);
   if(AlertsEnabled) CheckAndAlert();
}
Drawing Logic (DrawHTF & CreateOrUpdateCandle)
Rendering candles is handled by dedicated functions. DrawHTF() cycles through the selected bars, calculating each higher‑timeframe candle’s open, high, low, and close, then passing this data to CreateOrUpdateCandle(), which manages chart objects. To avoid clutter, objects are named with prefixes based on timeframe ID. This prevents overlaps and makes clean‑up (object deletion) easier when candles update.
void DrawHTF(ENUM_TIMEFRAMES timeframe)
{
   // Loop through bars to draw/update candles
   for(int i=0; i<BarsToDraw; i++)
   {
      datetime tTime = iTime(NULL, timeframe, i);
      double o = iOpen(NULL, timeframe, i);
      double h = iHigh(NULL, timeframe, i);
      double l = iLow(NULL, timeframe, i);
      double c = iClose(NULL, timeframe, i);

      CreateOrUpdateCandle(timeframe, tTime, o, h, l, c);
   }
}
Signal Detection (CheckAndAlert)
This function calculates candle direction (bullish or bearish) for:
- Current timeframe candle.
- HTF1 candle.
- HTF2 candle.
If all three agree, and the price moves beyond MinPipsForSignal, confirmation alerts are fired. Opposite bias detection is handled similarly, warning when higher timeframes reverse against current bias.
void CheckAndAlert()
{
   int dirCurrent = CandleDirection(_Period, 0);
   int dirHTF1    = CandleDirection(HTF1, 0);
   int dirHTF2    = CandleDirection(HTF2, 0);

   if(dirCurrent == dirHTF1 && dirCurrent == dirHTF2)
      FireAlerts(true);
   else if(AlertOnOpposite && dirHTF1 == dirHTF2 && dirCurrent != dirHTF1)
      FireAlerts(false);
}
Alert Execution (FireAlerts)
Alerts are central to the analyzer’s workflow. The function updates on‑chart labels with the current signal, plays sounds if enabled, sends push notifications, and emails depending on preferences. This modular handling keeps Alert Logic distinct from signal detection—making it easier to adjust or expand later.
void FireAlerts(bool confirmation)
{
   string msg = confirmation ? "MTF CONFIRM: BULL" : "MTF OPPOSITE: BEAR";
   ObjectSetText("AlertLabel", msg, 10, "Arial", clrWhite);

   if(UseSound) PlaySound(SoundFile);
   if(UsePush)  SendNotification(msg);
   if(UseMail)  SendMail("MTF Alert", msg);
}
Chart Interaction (OnChartEvent)
This handler makes the indicator interactive. It listens for click events on chart objects, toggles button states, stores new settings in global variables, and updates overlays accordingly. This design lets traders control the indicator without opening the settings interface—key for maintaining workflow speed.
Cleanup (OnDeinit)
When the indicator is removed, OnDeinit() clears chart objects, stops timers, and saves current states to global variables. This ensures charts remain clean and the setup is ready to reload without manual reconfiguration.
User Experience and Workflow
While the internal structure defines how the Timeframe Visual Analyzer operates, the true value appears in daily chart interaction. From installation through full‑session trading, the workflow is built to feel natural, blending higher‑timeframe insight with the rhythm of price movement on the active chart.
Loading and Initial Setup
When the indicator is attached to a chart, it immediately creates its control interface—three small buttons for HTF1, HTF2, and Alerts. The chosen timeframes draw automatically across the visible candles. Within a few seconds, color overlays begin forming: green and red for HTF1, blue and orange for HTF2 by default. Transparency lets both layers merge elegantly with the base chart so traders don’t lose detail in current price action. No special template is required. The indicator installs as any other .mq5 file and can be loaded via Insert -Indicators - Custom. Once loaded, the visual layers appear instantly, and the chart retains its responsiveness because the timer‑based refresh method updates only visible bars.
Visual Awareness at a Glance
The appearance of HTF candles changes the way market rhythm is read. Traders no longer need to imagine where the H1 candle sits on an M15 chart—they can see it. The broader candle body paints over several lower‑timeframe bars, revealing immediately whether the current range belongs inside a higher bullish or bearish move. For example, when trading M15 with HTF1 = H1 and HTF2 = M30, a trader sees overlapping H1 and M30 candles spanning the lower bars. A green overlay indicates hourly strength; an orange one hints at intermediate resistance. Decisions are made with both views present simultaneously, creating an unbroken link between micro‑ and macro‑price behavior.
Toggling Visibility and Control
Interaction is simple yet powerful. Clicking the on‑chart buttons enables or disables overlays and alerts in real time.
- HTF1 (green/red): shows or hides the primary higher timeframe candles.
- HTF2 (blue/orange): manages the secondary overlay.
- Alerts: toggles the confirmation system without changing any underlying settings.
Button color changes visually confirm the state, bright when active, dim when off. These toggles happen instantly with no re‑initializing or parameter editing. A trader can switch HTF views depending on market pace: focusing on HTF1 during calm periods or adding HTF2 when momentum increases. Behind the scenes, each change is written to global variables, meaning the chart will reopen later with the same setup intact. This persistence avoids the need to reconfigure after each session—a small detail that adds significant convenience.
Receiving Alerts and Feedback
When the price action across all chosen timeframes aligns in direction and pip movement exceeds the user‑defined threshold, visual and audible alerts appear. A compact label prints on the chart reading “MTF CONFIRM: BULL” or “MTF CONFIRM: BEAR”, timestamped to highlight the signal moment. A brief sound plays (if enabled), and push or email notifications can deliver the same message remotely. For traders monitoring reversals, opposite‑direction alerts are equally useful. As soon as HTF1 and HTF2 change bias against the active chart, a new label appears signaling potential transition—an early cue before any moving average or momentum indicator would show it. This type of immediate feedback prevents missed alignment signals during busy sessions. Many users attach the analyzer alongside strategy indicators so alert sounds act as subtle cues during decision making rather than full trading triggers.
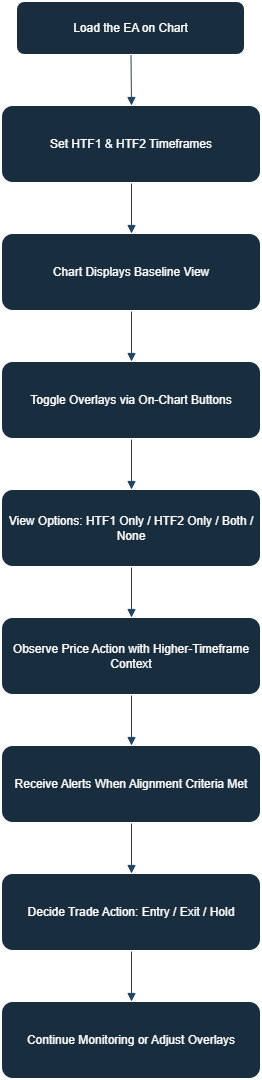
Practical Trading Flow
A typical workflow with the analyzer feels smooth and intuitive.
- Attach the EA to the chart of interest.
- Confirm that HTF1 and HTF2 overlays visualize correctly.
- Watch how current candles evolve inside higher‑timeframe bodies.
- Toggle overlays on or off depending on focus.
- React when alignment alerts trigger—either by preparing entries or adjusting stops.
When viewing, the trader notices movements differently. A bearish candle forming entirely inside a large bullish hourly body signals temporary retracement, not trend reversal. Conversely, when smaller candles pierce beyond an HTF bullish body and coincide with bearish confirmation alerts, the indication of a broader momentum shift becomes clear. This continuous interpretation takes away the mechanical task of switching charts, replacing it with visual recognition—a far faster and more natural trading response.
Performance and Visual Comfort
Even with multiple overlays active, chart updates remain fluid. Because the script only redraws visible candles and cleans up unused objects by prefix, resources stay optimized. Transparency ensures both sets of higher‑timeframe candles preserve readability even over dense price fluctuations. Users can tailor alpha settings to their own visual comfort. Lower values soften colors for long screen time; higher values deliver sharp, data‑rich visuals ideal for momentary checks during live trading.
A Day with the Analyzer
During a typical session, the experience revolves around what is seen rather than calculated. A trader starts the morning on EURUSD M15, overlays H1 and M30 using distinct colors, watches early London volatility unfold, and lets alerts confirm when momentum on all timeframes aligns. Hours later, switching to USDJPY requires no resetting—the stored configuration loads automatically. The chart continues to act as a visual dashboard: a living map of how larger market structure interacts with smaller movements. Instead of dividing attention across windows, the trader reads one chart that tells the full story.
Outcomes
This section demonstrates the practical results produced by the Multi-Timeframe Visual Analyzer when applied to live market conditions. Instead of discussing features in isolation, the examples below show how the tool behaves on the chart, how it reconstructs higher-timeframe structure in real time, and how its visual layers enhance clarity, directional bias, and decision confidence. Each illustration highlights a specific outcome, making it easy to see the value of the tool during actual price movement.
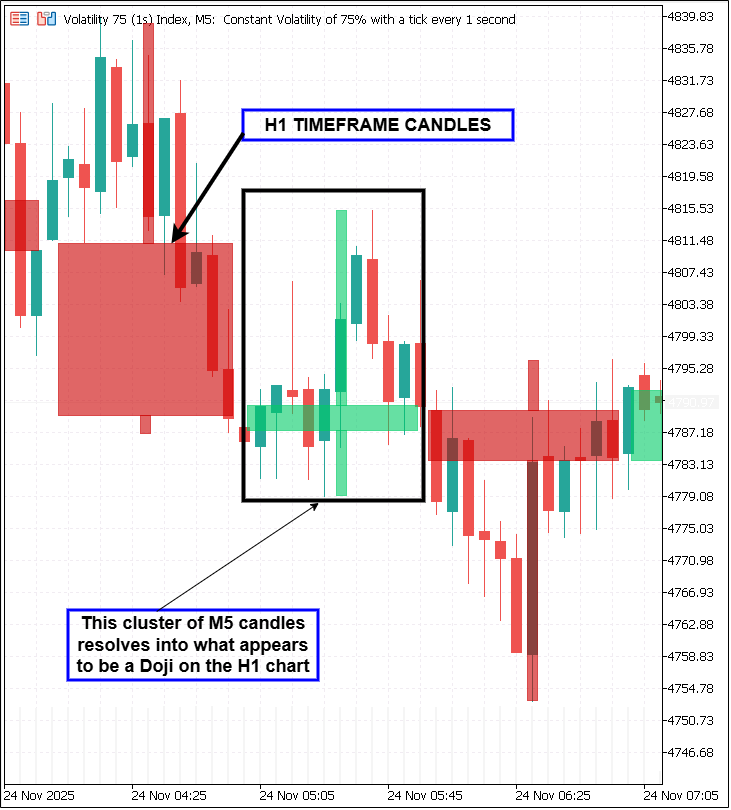
The animation above demonstrates the primary outcome of this tool: real-time visual synchronization of higher-timeframe structure on a lower-timeframe chart. Every second, the EA reconstructs each selected higher-timeframe candle and draws it as a semi-transparent block that updates continuously as price moves. This allows the trader to monitor how the live candle develops relative to both the lower timeframe and the higher-timeframe structure without switching charts. The buttons for HTF1, HTF2, and ALRT respond instantly, removing or restoring layers on the fly. With alerts enabled, the EA automatically checks whether the current candle and both selected higher timeframes are aligned in the same direction, preparing the trader for a potential multi-timeframe confirmation signal. The chart effectively becomes a live, multi-timeframe dashboard.
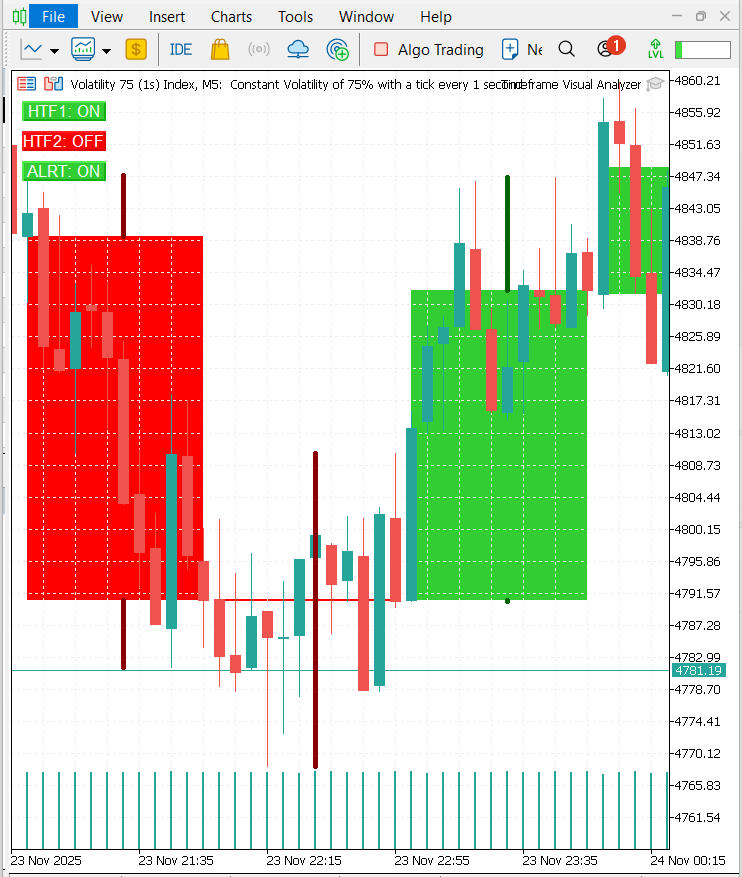
Enabling the HTF1 layer introduces large color-coded rectangles that represent the candles of the first chosen higher timeframe. Each block clearly displays the open and close ranges, while wicks extend beyond the block to show the full high-low structure. Bullish HTF1 blocks stand out in green and bearish blocks in red, providing an immediate visual interpretation of the broader candle while the market continues to print lower-timeframe movement inside it. Momentum shifts, wick traps, expansions, and compressions become easy to see, helping the trader understand the context behind the ongoing price action without needing to perform a manual top-down scan.
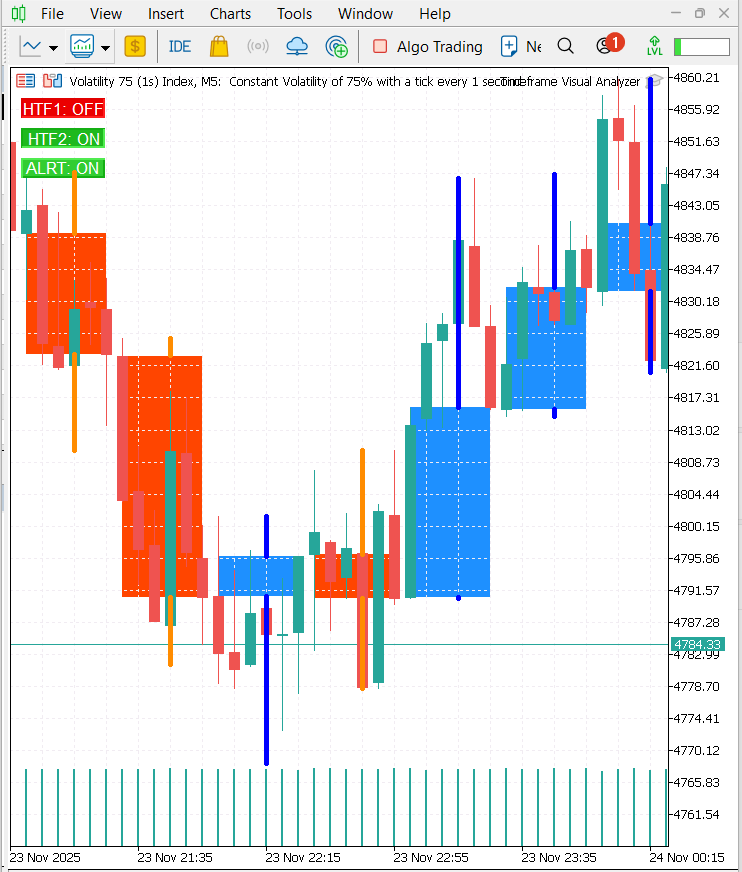
Turning on the HTF2 layer adds a second level of context. These candles use their own color style, giving the chart a deeper structural perspective that sits above both the lower timeframe and HTF1. This dual-layer mapping makes the bigger picture easy to interpret at a glance. HTF1 shows the medium-range bias, while HTF2 reveals the broader market direction. When both layers point in the same direction, confidence increases. When they diverge, the chart visually signals caution. The two layers together provide a more complete understanding of whether the market is trending, compressing, or transitioning. With ALRT mode activated, the EA continuously evaluates alignment between the chart’s own candle, the HTF1 candle, and the HTF2 candle. When all three point in the same direction, the system marks the moment internally as a high-probability confluence zone. This does not execute trades but provides timely awareness of trend-supported opportunities or reversals that meet multi-timeframe criteria. Instead of relying on isolated candle behavior, the tool guides the trader toward decisions backed by broader structural agreement.
The outcome is a significantly clearer and more informative chart. Higher-timeframe structure is always visible, trend direction becomes obvious, compression phases are easy to spot, and decision-making improves through continuous multi-timeframe awareness. The tool removes the need for constant timeframe switching and transforms the chart into a structured, readable, and intuitive environment that supports fast and accurate interpretation of price.
Conclusion
Multi-timeframe awareness is essential but too often slowed by constant chart switching and fragmented analysis. The Timeframe Visual Analyzer fixes that by placing higher-timeframe structure directly onto your active chart, so you read context and price action together without losing focus. Clear overlays, instant toggles, and configurable alerts turn complex multi-timeframe monitoring into a single visual workflow. Switch between no-overlay, single-overlay, and dual-overlay modes and you instantly change perspective—the GIF and chart examples show how that shift happens with a single click. For scalpers it reveals whether a fast move is backed by broader momentum; for swing traders it surfaces higher-timeframe shifts sooner; for educators and analysts it demonstrates timeframe interaction in real time. The tool tightens the feedback loop between structure and action, improving the quality of reads and the timing of decisions.
Under the hood the code is modular—drawing logic, alert detection, chart interaction and persistent state are clearly separated—which keeps the EA responsive and makes future extensions straightforward (additional overlays, refined alerts, external integrations). Ultimately, the Timeframe Visual Analyzer is more than a display: it’s a workflow enhancer—a living map of the market’s larger structures embedded in your chart, enabling faster, more confident decisions. In price action analysis, that kind of efficiency is an edge.
Warning: All rights to these materials are reserved by MetaQuotes Ltd. Copying or reprinting of these materials in whole or in part is prohibited.
This article was written by a user of the site and reflects their personal views. MetaQuotes Ltd is not responsible for the accuracy of the information presented, nor for any consequences resulting from the use of the solutions, strategies or recommendations described.

- Free trading apps
- Over 8,000 signals for copying
- Economic news for exploring financial markets
You agree to website policy and terms of use