
Price Action Analysis Toolkit Development (Part 1): Chart Projector

Introduction
In this article, titled "The Chart Projector," we focus on developing a tool designed to simplify market analysis, particularly for price action traders. The Chart Projector overlays the previous day's chart onto the current one in a ghost mode representation.
First, we will provide a justification for the Chart Projector, explaining the importance of projecting the previous day's chart onto the current chart. Next, we will present an overview of the tool, followed by a discussion of the code implementation. Finally, we will conclude with a summary of our findings.
Our subtopics are as follows:
- Justification of the Chart Projector
- Overview of the Tool
- Code Implementation
- Outcomes
- Conclusion
Justification of the Chart Projector
Redrawing the previous day’s chart onto the current day’s chart offers several advantages for traders. Here’s how this technique helps them:
| Advantages | Description |
|---|---|
| Immediate Context | Overlaying the previous day's data allows traders to quickly visualize price movements and key support/resistance levels, helping them assess current market conditions in relation to historical benchmarks. |
| Enhanced Identification of Key Levels | The overlay highlights critical price levels, such as support and resistance, more clearly than manual lines, aiding traders in predicting future price movements by identifying past buying and selling pressure. |
| Trend Recognition | Observing current price interaction with the previous day's action helps in identifying trends. Trading above the previous high suggests bullish momentum; trading below the low may indicate bearish sentiment. |
| Streamlined Analysis | This method eliminates the need for historical scrolling, allowing traders to focus on real-time analysis, save time, and make quicker decisions in fast-moving markets. |
| Behavioral Insights | By revealing how current price action aligns with prior behavior, the overlay helps traders understand market psychology, such as potential strength in bullish moves when diverging from resistance levels. |
| Risk Management | Clear visuals of past support and resistance aid traders in setting stop-loss orders at informed levels, which helps mitigate risk. |
| Simplified Trade Planning | Visualizing previous day's price movements simplifies entry and exit planning, enabling traders to structure trades around established levels and improve strategy effectiveness. |
| Focus on Price Action | By maintaining the integrity of the original price movements, traders can focus directly on price action dynamics without the distortion that typical indicators might introduce. This clarity can lead to more precise entries and exits |
In the illustration below, we compare the charts from two consecutive days, September 19 and 20, 2024. I have drawn lines to indicate the support and resistance levels. The comparison clearly shows how the market respects these previous levels. However, there's a limitation: the support levels identified may not always be the most significant ones. The inability to isolate only major support and resistance levels can introduce noise into the data, complicating trader's ability to make informed decisions. Without filtering out less significant levels, traders may struggle to identify genuine trends or reversals, which increases the risk of encountering false signals. This can lead to misguided entries and exits, ultimately affecting overall trading performance.
This is where our cast tool comes into play. It can identify and display the most powerful highs and lows, which greatly enhances the accuracy of our analysis. Additionally, the tool allows us to overlay the previous day's chart directly onto the current chart, making it easier to analyze and interpret price movements.
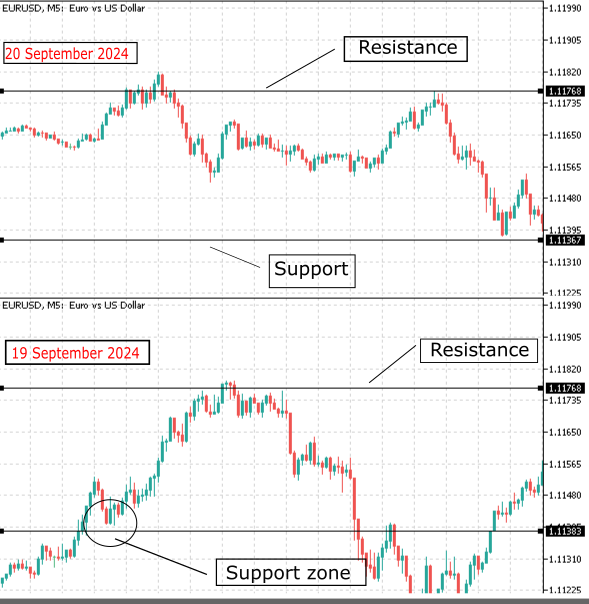
Fig 1. Comparing Price Action
Code Development
In code development using MetaEditor, the process begins by launching MetaEditor. Once the application is open, you navigate to the "New" option to initiate the creation of a new file. After selecting "New," a window appears where you can choose the type of file or project you want to create. In this case, you would select "Script" as the category for your project, since that’s the type of program you're aiming to develop.
Fig 2 below illustrates the window where you can select the option to create a script. This window provides the necessary choices for defining the type of project you're about to work on. By choosing the "Script" option, you're specifying that you want to create a custom automated program in MetaTrader. This step is critical as it sets the foundation for your development environment, ensuring that MetaEditor generates the appropriate template for writing your MQL5 script. The clear, user-friendly layout of this window simplifies the process of getting started with your coding project.

Fig 2. Start New Script
Here I will take you through a guide of how we can create the ghost effect as well as to projecting the previous chart to the current one using MQL5.
1. Properties:
One of the key aspects I want to emphasize is the importance of script properties and copyrights. Adding a copyright notice to your MQL5 script is crucial for safeguarding your work. It establishes your ownership and makes it clear that you are the original creator, helping prevent unauthorized use or claims over your code. In case of any disputes, this notice can serve as proof of ownership. Without a copyright, others might assume your script is freely available to use or distribute. By including a copyright statement, you maintain control over how your code is shared, sold, or modified.
//+------------------------------------------------------------------+
//|                                              Chart Projector.mq5 |
//|                                               Christian Benjamin |
//|                                             https://www.mql5.com |
//+------------------------------------------------------------------+
#property copyright   "Christian Benjamin"
#property link        "http://www.mql5.com"
#property description "Script to overlay yesterday's price action with ghost effect. Projected onto current day's chart and beyond"
#property indicator_chart_window
#property strict
#property script_show_inputs
#property version "1.0"
Additionally, a copyright allows for monetization opportunities. You can sell the script, offer it under specific licensing terms, or define usage conditions. This enhances the professionalism of your work by signaling its value, while also ensuring you receive proper recognition if others use or build upon it.
2. Inputs Section:
We create input variables to allow users to customize the ghost candlestick effect. These inputs define the ghost effect’s color, line style, and width. Users can also adjust whether to display the high and low prices from the previous day, shift the ghost pattern forward or backward, and project it further into the future.
input color GhostColor = clrGray;        // Color for ghost effect (can be transparent)
input int LineStyle = STYLE_DOT;         // Line style for ghost candlesticks
input int LineWidth = 2;                 // Line width for ghost candlesticks
input bool ShowHighLow = true;           // Show high/low lines of yesterday
input int ShiftBars = 0;                 // Number of bars to shift ghost forward/backward
input int ProjectForwardBars = 100;      // Number of bars to project ghost pattern forward
This section is important because it gives flexibility to the user, allowing the ghost candlestick pattern to be tailored according to their preferences.

Fig 3. Script Inputs
The diagram above illustrates how the input parameters are presented in MetaTrader 5, enabling users to conveniently view, modify, and personalize them directly when opening a chart. These parameters allow traders to tailor key aspects of the tool, such as line styles, colors, and candlestick projection settings, ensuring the chart fits their specific trading preferences and strategies. This flexibility helps enhance user experience, offering greater control over how past and present price action is visualized.
3. OnStart Function:
The OnStart() function serves as the entry point of the script. When the script runs, this function calls the main function DrawGhostCandles().
void OnStart()
{
    DrawGhostCandles(); // Call the function to draw ghost candles
}
This approach keeps the structure clean, making sure that the script immediately proceeds to the core function when it starts. By calling a dedicated function, we ensure that the task of drawing ghost candlesticks is handled separately and more efficiently.
4. DrawGhostCandles Function:
This function contains the logic to overlay the ghost candlestick pattern from yesterday onto today’s chart. We first retrieve the current timeframe, then calculate the start and end of both yesterday and today. We also determine the number of bars for yesterday and today by using the iBarShift() function.
void DrawGhostCandles()
{
    ENUM_TIMEFRAMES timeFrame = Period(); // Get the current timeframe

    datetime yesterdayStart = iTime(_Symbol, PERIOD_D1, 1); // Start of yesterday
    datetime todayStart = iTime(_Symbol, PERIOD_D1, 0); // Start of today
    datetime todayEnd = todayStart + PeriodSeconds(PERIOD_D1); // Expected end of today (24 hours)

    int startBarYesterday = iBarShift(_Symbol, timeFrame, yesterdayStart); // Yesterday's first bar
    int endBarYesterday = iBarShift(_Symbol, timeFrame, todayStart) - 1; // Yesterday's last bar

    if (startBarYesterday == -1 || endBarYesterday == -1)
    {
        Print("No data for yesterday.");
        return;
    }

    int barsToday = Bars(_Symbol, timeFrame, todayStart, todayEnd); // Total number of bars today

    for (int i = 0; i < barsToday; i++) // Loop through yesterday's bars
    {
        int yesterdayIndex = startBarYesterday - i % (endBarYesterday - startBarYesterday + 1);

        datetime timeYesterday = iTime(_Symbol, timeFrame, yesterdayIndex);
        double openYesterday = iOpen(_Symbol, timeFrame, yesterdayIndex);
        double highYesterday = iHigh(_Symbol, timeFrame, yesterdayIndex);
        double lowYesterday = iLow(_Symbol, timeFrame, yesterdayIndex);
        double closeYesterday = iClose(_Symbol, timeFrame, yesterdayIndex);

        datetime projectedTime = todayStart + i * PeriodSeconds() + ShiftBars * PeriodSeconds();

        if (projectedTime >= todayEnd) break; // Stop projection if today's end is reached

        DrawGhostBar(projectedTime, openYesterday, highYesterday, lowYesterday, closeYesterday); // Draw ghost bar
    }

    if (ShowHighLow)
    {
        double yesterdayHigh = iHigh(_Symbol, PERIOD_D1, 1); // Yesterday's high
        double yesterdayLow = iLow(_Symbol, PERIOD_D1, 1);   // Yesterday's low

        DrawHorizontalLine("YesterdayHigh", yesterdayHigh);  // Draw high
        DrawHorizontalLine("YesterdayLow", yesterdayLow);    // Draw low
    }
}
The function loops through each bar of yesterday, retrieves its open, high, low, and close prices, and projects these onto today’s chart. The loop ensures that each candlestick from yesterday is mirrored as a "ghost" on today’s chart. This helps visualize how the previous day’s price action compares to today’s price movements.
5. DrawGhostBar Function:
This function handles the drawing of each individual ghost candlestick on the chart. A line is created to represent the high-low range, and a rectangle is drawn to represent the open-close range of each candlestick.
void DrawGhostBar(datetime time, double open, double high, double low, double close)
{
    string lineName = "GhostLine" + IntegerToString(time);  // Line name for high-low
    ObjectCreate(0, lineName, OBJ_TREND, 0, time, low, time, high); // Create the line
    ObjectSetInteger(0, lineName, OBJPROP_COLOR, GhostColor); // Set color
    ObjectSetInteger(0, lineName, OBJPROP_STYLE, LineStyle);  // Set style
    ObjectSetInteger(0, lineName, OBJPROP_WIDTH, LineWidth);  // Set width

    string ocName = "GhostOC" + IntegerToString(time);  // Rectangle name for open-close
    ObjectCreate(0, ocName, OBJ_RECTANGLE, 0, time, open, time + PeriodSeconds(), close); // Create rectangle
    ObjectSetInteger(0, ocName, OBJPROP_COLOR, GhostColor); // Set color
    ObjectSetInteger(0, ocName, OBJPROP_STYLE, LineStyle);  // Set style
    ObjectSetInteger(0, ocName, OBJPROP_WIDTH, LineWidth);  // Set width
}
By separating this functionality into its own function, we simplify the process of drawing each ghost candlestick. This modular approach makes it easier to manage, update, and customize the way these candlesticks appear.
6. DrawHorizontalLine Function:
This function draws horizontal lines on the chart, marking the high and low prices from the previous day. These lines act as visual indicators for key price levels that traders often pay attention to.
void DrawHorizontalLine(string name, double price)
{
    if (!ObjectCreate(0, name, OBJ_HLINE, 0, TimeCurrent(), price))
    {
        Print("Failed to create horizontal line."); // Error handling
    }
    ObjectSetInteger(0, name, OBJPROP_COLOR, GhostColor); // Set color
    ObjectSetInteger(0, name, OBJPROP_STYLE, LineStyle);  // Set style
    ObjectSetInteger(0, name, OBJPROP_WIDTH, LineWidth);  // Set width
}
Including this functionality enhances the script by adding important reference points, helping traders easily spot support and resistance levels from the previous day. The function ensures that these lines are drawn with the same customization options as the ghost candlesticks.
Outcomes
The outcome of the Chart Projector code is a visual representation of the previous day's price action overlaid on the current day's chart, providing traders with valuable insights into market behavior. This is achieved through the generation of ghost candlesticks for the previous day, which are projected onto the current chart, allowing traders to observe how the market has moved relative to the prior day's performance. By visualizing the previous day's high, low, open, and close, traders can gain a better understanding of market sentiment and price trends.
Additionally, the script optionally draws horizontal lines for the high and low of the previous day, serving as potential support and resistance levels for the current day. Traders can utilize these levels to make informed decisions about entry and exit points based on the market's behavior in relation to these historical benchmarks. The script also offers various customizable inputs, such as color, line style, line width, and the ability to shift the ghost overlay forward or backward, enabling traders to tailor the visualization to their specific strategies and preferences. This enhances user experience and allows for personalized analysis tools.
With the ghost candlestick overlay, traders can quickly assess whether current price action mirrors, diverges from, or reacts to previous price movements, informing their trading strategies. The ghost effect simplifies market analysis by eliminating clutter from excessive indicators, focusing solely on the previous day's action and providing clearer insights into price dynamics. This clarity aids in identifying potential trends and reversals, leading to more strategic trading decisions. See Fig 4 below.

Fig 4. Chart Projection Result
Looking at Fig 4 above, there's a clear presentation of the outcomes according to the code test on the MetaTrade 5. The system looks to be wonderful as, the current day chart looks to be obeying the support and resistance levels. It is evident that the price broke below the previous day's low, as indicated by the horizontal lines, before retracing and continuing its bearish trend.

Fig 5. Chart Projection Result
Figure 5 illustrates the results from our chart projector, highlighting how the current market dynamics are respecting the previous day's highs and lows.
Conclusion
In conclusion, the development and implementation of the Chart Projector for price action analysis represents a significant advancement for traders looking to enhance their market interpretation skills. By overlaying the previous day's price action onto the current chart, we provide a powerful visual tool that facilitates the understanding of market dynamics without the clutter of traditional indicators. This approach allows traders to quickly identify key support and resistance levels, significantly aiding in decision-making processes. The insights gained from this method reflect not only the behavior of price movements but also the collective sentiment of market participants, offering a more in-depth perspective on potential future trends.
I encourage everyone to use this for educational purposes only. Please do not experiment with real money!
I propose to name our toolkit the 'Lynnchris Tools Chest,' and I will log each tool we develop, as well as update the log whenever we publish a new version. Please see the table below.| Date | Tool Name | Description | Version | Updates | Notes |
|---|---|---|---|---|---|
| 01/10/24 | Chart Projector | Script to overlay the previous day's price action with ghost effect. | 1.0 | Initial Release | The first tool in Lynnchris Tools Chest |
Warning: All rights to these materials are reserved by MetaQuotes Ltd. Copying or reprinting of these materials in whole or in part is prohibited.
This article was written by a user of the site and reflects their personal views. MetaQuotes Ltd is not responsible for the accuracy of the information presented, nor for any consequences resulting from the use of the solutions, strategies or recommendations described.

- Free trading apps
- Over 8,000 signals for copying
- Economic news for exploring financial markets
You agree to website policy and terms of use
Congratulation on one of the biggest event in your life. Nicely done indicator, however we can achieve this by creating a SMA of Period 1, shifted by the number of periods of the time frame in a day. for 1H tF, shift by 24, for m15, shift by 1440/15=96. Looking forward to your foray into chart studies.
Congratulation on one of the biggest event in your life. Nicely done indicator, however we can achieve this by creating a SMA of Period 1, shifted by the number of periods of the time frame in a day. for 1H tF, shift by 24, for m15, shift by 1440/15=96. Looking forward to your foray into chaert studies.
Thank you so much