Price Action Analysis Toolkit Development (Part 19): ZigZag Analyzer

Introduction
Trend lines form the backbone of technical analysis and modern price action. They act as the skeleton of price patterns that traders in forex, cryptocurrencies, commodities, stocks, and derivatives rely on. When drawn correctly, trend lines efficiently reveal market trends and help traders spot potential opportunities.
Whether you are a day trader or a short-term trader, trend lines play a key role in many trading systems and strategies. In our Price Action Analysis Toolkit development series, we introduce a tool called the ZigZag Analyzer. This tool focuses on drawing trend lines using the ZigZag indicator to identify swing points that form the basis for constructing trend lines. MQL5 is a powerful language for automating trading systems, and it allows us to build advanced tools like the ZigZag Analyzer that adapt to market conditions and support real-time decision-making.
We will begin by exploring trendlines, then examine the Zigzag indicator, outline the system algorithm, present the MQL5 code, review the outcomes, and conclude with our final insights. Let's see the table of contents below:
Trendlines
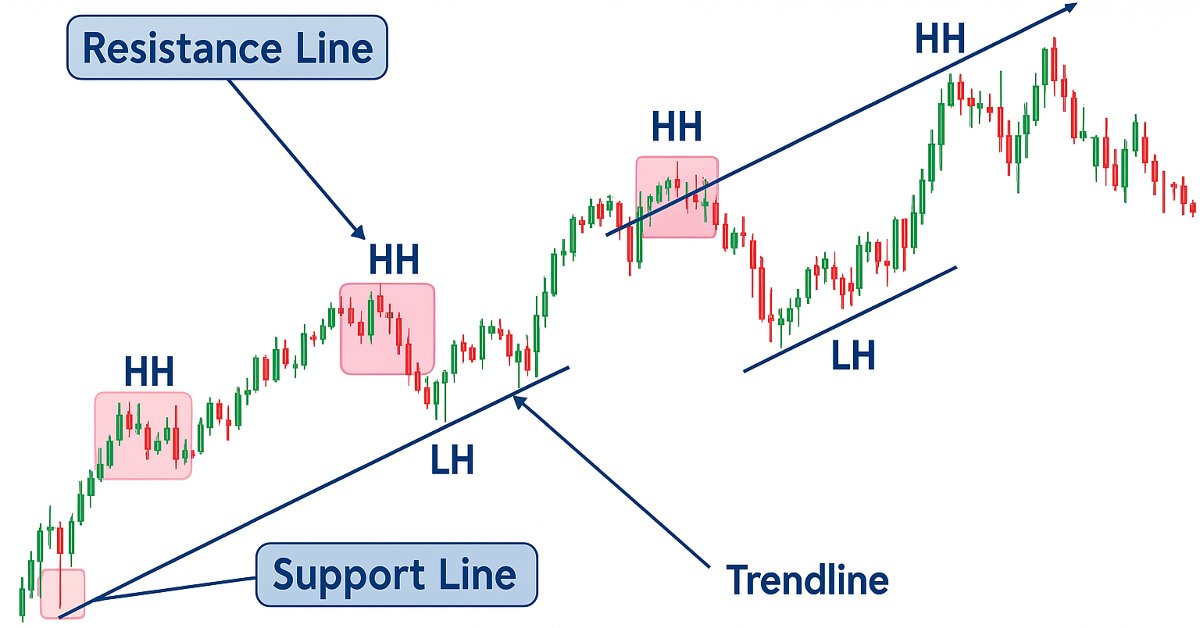
A trend line is a sloping line that connects significant price points, typically higher lows or lower highs, and projects into the future as a support or resistance level. It indicates the likely direction and momentum of price movements. To draw a trendline, begin by identifying the overall market direction. An uptrend is characterized by a sequence of higher highs and higher lows, whereas a downtrend is marked by lower highs and lower lows. For illustrative purposes, consider a chart showing a downward pattern, where you would connect the descending swing highs to establish the trendline. During price consolidation, the formation of multiple trend lines can reveal patterns that strengthen trading signals. Below is a pictorial representation.

Fig 1. Trendlines
The chart illustrates two key concepts: support and resistance. A support level is an area where downward price movement often stalls because buyers become active enough to absorb selling pressure. When trendlines are applied, support is typically shown by upward-sloping lines that connect important low points. In contrast, a resistance level is an area where upward price movement frequently pauses due to intensified selling pressure. With trendlines, resistance is represented by downward-sloping lines that link significant high points. Traders frequently draw trend lines across multiple time horizons to identify whether a market is moving upward or downward over short, medium, or long durations.Trend lines are a valuable tool in technical analysis because they help market participants gauge the overall direction of an asset’s price. By connecting significant highs or lows over a chosen timeframe, these lines visually represent whether the market is moving upward, downward, or sideways. This insight is especially useful for traders and short-term investors who rely on price trends to guide their decisions.
ZigZag Indicator
While the exact origin of the Zig Zag indicator is not definitively documented, some sources attribute its discovery to Bill Wolfe, an S&P 500 trader known for developing Wolfe Waves, a method somewhat similar to Elliott Waves but with distinct charting techniques. Wolfe Waves consist of five waves that illustrate supply and demand moving toward an equilibrium price, refer to. The Zig Zag indicator highlights significant price reversals that exceed a specified threshold, typically expressed as a percentage. When the price swings beyond this threshold, the indicator plots a new point and draws a straight line from the previous point, effectively filtering out smaller fluctuations. By doing so, it makes underlying trends easier to spot across various time frames.
Traders can adjust the percentage threshold (e.g., 4% or 5%) to capture more or fewer price swings, depending on the volatility of the asset or their personal trading style. This flexibility helps refine how the Zig Zag indicator identifies potential turning points. In wave-based analysis, such as Elliot wave theory, the Zig Zag can help clarify the structure of each wave. Ultimately, experimenting with different settings is often necessary to find the optimal balance between filtering out noise and detecting meaningful price movements.

Fig 2. Zig Zag Indicator
Figure 2 above shows a chart with the Zig Zag indicator. It demonstrates how trendlines can be constructed from its swings. The Zig Zag indicator simplifies trend analysis by filtering out minor price fluctuations and highlighting key turning points. It marks significant highs and lows, which serve as anchor points for drawing trendlines. In an uptrend, connecting these swing lows creates a support line, while in a downtrend, linking swing highs forms a resistance line. This method emphasizes the overall direction of the market by eliminating noise. Adjusting the indicator's sensitivity can further refine the accuracy of these trendlines for improved trading insights.
System Algorithm
1. Global Declarations and Input Parameters
In this initial section, we set up key inputs and global variables that let you customize the analyzer without digging into the code. We define parameters like the chart timeframe and specific properties for the ZigZag indicator such as depth, deviation, and backstep. These settings determine how the analyzer picks out swing points. We also declare arrays to store the ZigZag data and to record the time and price of key pivots.
We value this setup for its simplicity and modular design. For instance, by changing the timeframe parameter, you can easily switch between short-term and long-term trends. The ZigZag properties let you adjust the sensitivity of the indicator, so you can adapt the analysis to different market conditions or assets. We use global variables and arrays as a central hub for all dynamic data. This approach improves performance and makes the code easier to maintain. When new data arrives, it is efficiently stored and ready for analysis, making customization and debugging much simpler.
Overall, by centralizing these critical inputs and declarations, we create a flexible and clear tool that empowers you to tailor the analyzer to your needs while keeping the underlying processes robust and reliable.
// Input parameters
input ENUM_TIMEFRAMES InpTimeFrame    = PERIOD_CURRENT; // Timeframe to analyze
input int             ZZ_Depth         = 12;  // ZigZag depth
input int             ZZ_Deviation     = 5;   // ZigZag deviation
input int             ZZ_Backstep      = 3;   // ZigZag backstep
input int             LookBackBars     = 200; // Bars to search for pivots
input int             ExtendFutureBars = 100; // Bars to extend trendlines into the future

// Global indicator handle for ZigZag
int zzHandle;

// Arrays for ZigZag data and pivot storage
double   zzBuffer[];
datetime pivotTimes[];
double   pivotPrices[];
bool     pivotIsPeak[];

// Variable to detect new bars
datetime lastBarTime = 0;
- InpTimeFrame: The timeframe for analysis.
- ZZ_Depth, ZZ_Deviation, ZZ_Backstep: Parameters that influence the sensitivity and behavior of the ZigZag indicator.
Arrays like zzBuffer store the ZigZag indicator’s output. Additional arrays (pivotTimes, pivotPrices, pivotIsPeak) are reserved for holding details about each detected pivot. A variable (lastBarTime) helps to determine whether a new bar has started, ensuring that the analysis is only updated when necessary.
2. Initialization Function (OnInit)
In the Initialization Function, we execute the code once when the indicator is loaded. Our main goal here is to create and configure the ZigZag indicator using the user inputs. We call the iCustom function to try to instantiate the ZigZag indicator and store its handle. If the indicator fails to initialize and returns an invalid handle, we log an error and halt further processing.
We use this function to ensure that everything is set up correctly before any analysis takes place. It acts as a gatekeeper, preventing the rest of the code from running if there is an issue with the indicator setup. This early check saves time and avoids unnecessary errors later in the execution. By centralizing the initialization here, we make it easier to manage and debug the system if something goes wrong. The function also makes sure that all user-defined settings are applied right from the start, setting a solid foundation for the analysis that follows.
int OnInit()
  {
   zzHandle = iCustom(_Symbol, InpTimeFrame, "ZigZag", ZZ_Depth, ZZ_Deviation, ZZ_Backstep);
   if(zzHandle == INVALID_HANDLE)
     {
      Print("Error creating ZigZag handle");
      return(INIT_FAILED);
     }
   return(INIT_SUCCEEDED);
  }
- Indicator Creation: Uses iCustom to load the ZigZag indicator with specific parameters.
- Error Handling: Checks if the returned handle is valid. Logs an error message and aborts if initialization fails.
3. Deinitialization Function (OnDeinit)
When the indicator is removed or the platform is closed, it’s essential to clean up any objects and free allocated resources. The OnDeinit function takes care of this by deleting any graphical objects (like trendlines or horizontal lines) that were drawn on the chart and releasing the ZigZag indicator handle. This ensures that no unwanted elements remain on the chart and that the system’s resources are properly managed.
Resource Cleanup: Deletes all created chart objects to avoid clutter.Handle Release: Frees the ZigZag indicator handle using IndicatorRelease.
void OnDeinit(const int reason)
  {
   ObjectDelete(0, "Downtrend_HighLine");
   ObjectDelete(0, "Uptrend_LowLine");
   ObjectDelete(0, "Major_Resistance");
   ObjectDelete(0, "Major_Support");
   ObjectDelete(0, "Minor_Resistance");
   ObjectDelete(0, "Minor_Support");
   IndicatorRelease(zzHandle);
  }
4. Main Execution Function (OnTick)
This is the heart of the algorithm that runs with every new tick. The function first checks if a new bar has formed by comparing the current bar’s timestamp with the last stored time. If no new bar is detected, the function exits early to save processing power. Once a new bar is confirmed, it removes old chart objects, retrieves the most recent ZigZag data using CopyBuffer, and then calls two helper functions: one for drawing trendlines and another for drawing support and resistance levels.
void OnTick()
  {
   datetime currentBarTime = iTime(_Symbol, InpTimeFrame, 0);
   if(currentBarTime == lastBarTime)
      return;
   lastBarTime = currentBarTime;

   // Remove previous objects
   ObjectDelete(0, "Downtrend_HighLine");
   ObjectDelete(0, "Uptrend_LowLine");
   ObjectDelete(0, "Major_Resistance");
   ObjectDelete(0, "Major_Support");
   ObjectDelete(0, "Minor_Resistance");
   ObjectDelete(0, "Minor_Support");

   if(CopyBuffer(zzHandle, 0, 0, LookBackBars, zzBuffer) <= 0)
     {
      Print("Failed to copy ZigZag data");
      return;
     }
   ArraySetAsSeries(zzBuffer, true);

   DrawZigZagTrendlines();
   DrawSupportResistance();
  }
- New Bar Check: Uses the iTime function to detect a change in the bar.
- Buffer Update: Refreshes the zzBuffer with the latest ZigZag data.
- Chart Updates: Clears previous graphical objects to prepare for new ones. Calls functions to draw trendlines and support/resistance lines.
5. Drawing ZigZag-Based Trendlines (DrawZigZagTrendlines)
This function is responsible for identifying the significant swing points from the ZigZag data and using them to calculate trendlines. It goes through the buffer to collect highs and lows based on whether the current ZigZag value matches the high or low of the bar. Once the swing points are gathered, the code uses linear regression to determine the trendline for each set of points. The regression calculation employs the following formulas:
1. Slope (m)
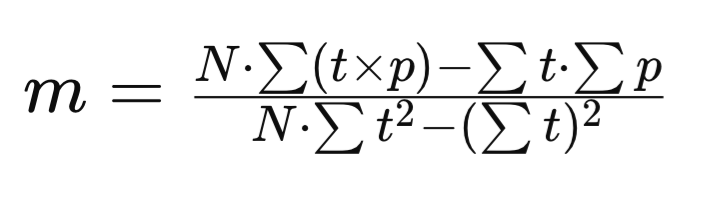
Fig 3. Regression Formula
2. Intercept (b)
")
Fig 4. Intercept
- (t) represents the time values (or the independent variable).
- (p) represents the price values (or the dependent variable).
- (N) is the number of data points used in the regression.
Swing Point Extraction: Loops through the zzBuffer to gather up to 10 highs and lows.
Exclusion of Latest Swing: Discards the most recent swing to reduce noise.
Regression Analysis: Calculates slope (m) and intercept (b) using the formulas above.
void DrawZigZagTrendlines()
  {
   double highPrices[10], lowPrices[10];
   datetime highTimes[10], lowTimes[10];
   int highCount = 0, lowCount = 0;

   // Extract swing points from the ZigZag buffer
   for(int i = 0; i < LookBackBars - 1; i++)
     {
      if(zzBuffer[i] != 0)
        {
         if(iHigh(_Symbol, InpTimeFrame, i) == zzBuffer[i] && highCount < 10)
           {
            highPrices[highCount] = zzBuffer[i];
            highTimes[highCount] = iTime(_Symbol, InpTimeFrame, i);
            highCount++;
           }
         else if(iLow(_Symbol, InpTimeFrame, i) == zzBuffer[i] && lowCount < 10)
              {
               lowPrices[lowCount] = zzBuffer[i];
               lowTimes[lowCount] = iTime(_Symbol, InpTimeFrame, i);
               lowCount++;
              }
        }
     }

   // Exclude the most recent swing if possible
   int usedHighCount = (highCount >= 4) ? highCount - 1 : highCount;
   int usedLowCount  = (lowCount  >= 4) ? lowCount - 1  : lowCount;

   double mHigh = 0, bHigh = 0, mLow = 0, bLow = 0;
   bool validHigh = false, validLow = false;

   // Regression for highs
   if(usedHighCount >= 3)
     {
      double sumT = 0, sumP = 0, sumTP = 0, sumT2 = 0;
      for(int i = 0; i < usedHighCount; i++)
        {
         double t = (double)highTimes[i];
         double p = highPrices[i];
         sumT += t;
         sumP += p;
         sumTP += t * p;
         sumT2 += t * t;
        }
      int N = usedHighCount;
      double denominator = N * sumT2 - sumT * sumT;
      if(denominator != 0)
        {
         mHigh = (N * sumTP - sumT * sumP) / denominator;
         bHigh = (sumP - mHigh * sumT) / N;
        }
      else
         bHigh = sumP / N;
      validHigh = true;
     }

   // Regression for lows
   if(usedLowCount >= 3)
     {
      double sumT = 0, sumP = 0, sumTP = 0, sumT2 = 0;
      for(int i = 0; i < usedLowCount; i++)
        {
         double t = (double)lowTimes[i];
         double p = lowPrices[i];
         sumT += t;
         sumP += p;
         sumTP += t * p;
         sumT2 += t * t;
        }
      int N = usedLowCount;
      double denominator = N * sumT2 - sumT * sumT;
      if(denominator != 0)
        {
         mLow = (N * sumTP - sumT * sumP) / denominator;
         bLow = (sumP - mLow * sumT) / N;
        }
      else
         bLow = sumP / N;
      validLow = true;
     }

   // Define time limits for trendlines
   datetime pastTime   = iTime(_Symbol, InpTimeFrame, LookBackBars - 1);
   datetime futureTime = lastBarTime + ExtendFutureBars * PeriodSeconds();

   // Draw trendlines if both regressions are valid
   if(validHigh && validLow)
     {
      // When slopes have the same sign, use average slope for parallel lines
      if(mHigh * mLow > 0)
        {
         double mParallel = (mHigh + mLow) / 2.0;
         double bHighParallel = highPrices[0] - mParallel * (double)highTimes[0];
         double bLowParallel  = lowPrices[0] - mParallel * (double)lowTimes[0];

         datetime highStartTime = pastTime;
         double highStartPrice  = mParallel * (double)highStartTime + bHighParallel;
         double highEndPrice    = mParallel * (double)futureTime + bHighParallel;
         if(!ObjectCreate(0, "Downtrend_HighLine", OBJ_TREND, 0, highStartTime, highStartPrice, futureTime, highEndPrice))
            Print("Failed to create High Trendline");
         else
           {
            ObjectSetInteger(0, "Downtrend_HighLine", OBJPROP_COLOR, clrRed);
            ObjectSetInteger(0, "Downtrend_HighLine", OBJPROP_RAY_LEFT, true);
            ObjectSetInteger(0, "Downtrend_HighLine", OBJPROP_RAY_RIGHT, true);
           }

         datetime lowStartTime = pastTime;
         double lowStartPrice  = mParallel * (double)lowStartTime + bLowParallel;
         double lowEndPrice    = mParallel * (double)futureTime + bLowParallel;
         if(!ObjectCreate(0, "Uptrend_LowLine", OBJ_TREND, 0, lowStartTime, lowStartPrice, futureTime, lowEndPrice))
            Print("Failed to create Low Trendline");
         else
           {
            ObjectSetInteger(0, "Uptrend_LowLine", OBJPROP_COLOR, clrGreen);
            ObjectSetInteger(0, "Uptrend_LowLine", OBJPROP_RAY_LEFT, true);
            ObjectSetInteger(0, "Uptrend_LowLine", OBJPROP_RAY_RIGHT, true);
           }
        }
      else // Draw separate trendlines if slopes differ
        {
         datetime highStartTime = pastTime;
         double highStartPrice  = mHigh * (double)highStartTime + bHigh;
         double highEndPrice    = mHigh * (double)futureTime + bHigh;
         if(!ObjectCreate(0, "Downtrend_HighLine", OBJ_TREND, 0, highStartTime, highStartPrice, futureTime, highEndPrice))
            Print("Failed to create High Trendline");
         else
           {
            ObjectSetInteger(0, "Downtrend_HighLine", OBJPROP_COLOR, clrRed);
            ObjectSetInteger(0, "Downtrend_HighLine", OBJPROP_RAY_LEFT, true);
            ObjectSetInteger(0, "Downtrend_HighLine", OBJPROP_RAY_RIGHT, true);
           }

         datetime lowStartTime = pastTime;
         double lowStartPrice  = mLow * (double)lowStartTime + bLow;
         double lowEndPrice    = mLow * (double)futureTime + bLow;
         if(!ObjectCreate(0, "Uptrend_LowLine", OBJ_TREND, 0, lowStartTime, lowStartPrice, futureTime, lowEndPrice))
            Print("Failed to create Low Trendline");
         else
           {
            ObjectSetInteger(0, "Uptrend_LowLine", OBJPROP_COLOR, clrGreen);
            ObjectSetInteger(0, "Uptrend_LowLine", OBJPROP_RAY_LEFT, true);
            ObjectSetInteger(0, "Uptrend_LowLine", OBJPROP_RAY_RIGHT, true);
           }
        }
     }
   else
     {
      // Draw only available regression if only one set of points is valid
      if(validHigh)
        {
         datetime highStartTime = pastTime;
         double highStartPrice  = mHigh * (double)highStartTime + bHigh;
         double highEndPrice    = mHigh * (double)futureTime + bHigh;
         if(!ObjectCreate(0, "Downtrend_HighLine", OBJ_TREND, 0, highStartTime, highStartPrice, futureTime, highEndPrice))
            Print("Failed to create High Trendline");
         else
           {
            ObjectSetInteger(0, "Downtrend_HighLine", OBJPROP_COLOR, clrRed);
            ObjectSetInteger(0, "Downtrend_HighLine", OBJPROP_RAY_LEFT, true);
            ObjectSetInteger(0, "Downtrend_HighLine", OBJPROP_RAY_RIGHT, true);
           }
        }
      if(validLow)
        {
         datetime lowStartTime = pastTime;
         double lowStartPrice  = mLow * (double)lowStartTime + bLow;
         double lowEndPrice    = mLow * (double)futureTime + bLow;
         if(!ObjectCreate(0, "Uptrend_LowLine", OBJ_TREND, 0, lowStartTime, lowStartPrice, futureTime, lowEndPrice))
            Print("Failed to create Low Trendline");
         else
           {
            ObjectSetInteger(0, "Uptrend_LowLine", OBJPROP_COLOR, clrGreen);
            ObjectSetInteger(0, "Uptrend_LowLine", OBJPROP_RAY_LEFT, true);
            ObjectSetInteger(0, "Uptrend_LowLine", OBJPROP_RAY_RIGHT, true);
           }
        }
     }
  }
Trendline Drawing (If both trends are valid)
- Same Sign Slopes: Use an averaged slope for parallel lines.
- Different Signs: Draw individual trendlines. Uses ObjectCreate and ObjectSetInteger to place and style the lines.
6. Drawing Support and Resistance Levels (DrawSupportResistance)
The support and resistance part of the code is designed to dynamically identify key horizontal price levels based on the confirmed swing points provided by the ZigZag indicator. Beyond simply designating the highest confirmed high as the major resistance and the lowest confirmed low as the major support, the algorithm delves deeper by filtering out significant highs and lows to determine both major and minor levels. This process is crucial because support and resistance are fundamental concepts in technical analysis; support represents a level where the price tends to stop falling due to increased demand, while resistance indicates a level where the price typically struggles to move higher due to supply pressure.
In this implementation, the code examines all confirmed swing points, meticulously sorting and comparing them to isolate the most extreme values. This ensures that the levels drawn on the chart are not merely transient fluctuations but represent meaningful zones that have historically influenced price reversals. By identifying the second-highest and second-lowest values as minor resistance and support, the algorithm provides additional layers of insight. These minor levels can serve as early signals or secondary targets, offering traders a nuanced view of potential price reactions before reaching the more critical major levels.
This approach is incredibly useful in a constantly changing market. As new price data rolls in, the ZigZag indicator picks up fresh swing points, automatically updating the support and resistance levels to reflect the latest market structure. This real-time adjustment is crucial for traders, helping them stay aligned with shifting price barriers that could influence their entry or exit decisions. These levels are visually mapped onto the chart as horizontal lines in distinct colors, making them easy to spot at a glance. This added clarity allows traders to quickly identify key areas where price might react, helping them place stop-loss orders or set profit targets with more confidence. Ultimately, this section of the code doesn’t just calculate support and resistance, it transforms raw market data into clear, actionable insights, making it an essential tool for any trader using technical instruments.
void DrawSupportResistance()
  {
   double confirmedHighs[10], confirmedLows[10];
   int confHighCount = 0, confLowCount = 0;

   for(int i = 0; i < LookBackBars - 1; i++)
     {
      if(zzBuffer[i] != 0)
        {
         if(iHigh(_Symbol, InpTimeFrame, i) == zzBuffer[i] && confHighCount < 10)
           {
            confirmedHighs[confHighCount] = zzBuffer[i];
            confHighCount++;
           }
         else if(iLow(_Symbol, InpTimeFrame, i) == zzBuffer[i] && confLowCount < 10)
              {
               confirmedLows[confLowCount] = zzBuffer[i];
               confLowCount++;
              }
        }
     }

   int usedHighCount = (confHighCount >= 4) ? confHighCount - 1 : confHighCount;
   int usedLowCount  = (confLowCount  >= 4) ? confLowCount - 1  : confLowCount;

   double majorResistance = -1e9, majorSupport = 1e9;
   double minorResistance = -1e9, minorSupport = 1e9;
   double tempHigh = -1e9, tempLow = -1e9;
   for(int i = 0; i < usedHighCount; i++)
     {
      if(confirmedHighs[i] > majorResistance)
        {
         tempHigh = majorResistance;
         majorResistance = confirmedHighs[i];
        }
      else if(confirmedHighs[i] > tempHigh)
           {
            tempHigh = confirmedHighs[i];
           }
     }
   if(tempHigh > -1e9)
      minorResistance = tempHigh;
   for(int i = 0; i < usedLowCount; i++)
     {
      if(confirmedLows[i] < majorSupport)
        {
         tempLow = majorSupport;
         majorSupport = confirmedLows[i];
        }
      else if(confirmedLows[i] < tempLow)
           {
            tempLow = confirmedLows[i];
           }
     }
   if(tempLow < 1e9)
      minorSupport = tempLow;

   if(usedHighCount > 0)
     {
      if(!ObjectCreate(0, "Major_Resistance", OBJ_HLINE, 0, 0, majorResistance))
         Print("Failed to create Major Resistance");
      else
         ObjectSetInteger(0, "Major_Resistance", OBJPROP_COLOR, clrMagenta);

      if(minorResistance > -1e9 && minorResistance < majorResistance)
        {
         if(!ObjectCreate(0, "Minor_Resistance", OBJ_HLINE, 0, 0, minorResistance))
            Print("Failed to create Minor Resistance");
         else
            ObjectSetInteger(0, "Minor_Resistance", OBJPROP_COLOR, clrFuchsia);
        }
     }
   if(usedLowCount > 0)
     {
      if(!ObjectCreate(0, "Major_Support", OBJ_HLINE, 0, 0, majorSupport))
         Print("Failed to create Major Support");
      else
         ObjectSetInteger(0, "Major_Support", OBJPROP_COLOR, clrAqua);

      if(minorSupport < 1e9 && minorSupport > majorSupport)
        {
         if(!ObjectCreate(0, "Minor_Support", OBJ_HLINE, 0, 0, minorSupport))
            Print("Failed to create Minor Support");
         else
            ObjectSetInteger(0, "Minor_Support", OBJPROP_COLOR, clrBlue);
        }
     }
  }
Data collection iterates through the buffer to extract confirmed highs and lows. Level determination uses comparisons to isolate the extreme values. Major resistance/support are set as the most extreme values, while the next most extreme values become minor levels. Graphical representation creates horizontal lines (OBJ_HLINE) for each identified level. Colors are applied to each line for easy differentiation.
MQL5 Code
//+------------------------------------------------------------------+
//|                                               ZigZag Analyzer.mq5|
//|                                   Copyright 2025, MetaQuotes Ltd.|
//|                           https://www.mql5.com/en/users/lynnchris|
//+------------------------------------------------------------------+
#property copyright "Copyright 2025, MetaQuotes Ltd."
#property link      "https://www.mql5.com/en/users/lynnchris"
#property version   "1.0"
#property strict

// Input parameters
input ENUM_TIMEFRAMES InpTimeFrame    = PERIOD_CURRENT; // Timeframe to analyze
input int             ZZ_Depth         = 12;  // ZigZag depth
input int             ZZ_Deviation     = 5;   // ZigZag deviation
input int             ZZ_Backstep      = 3;   // ZigZag backstep
input int             LookBackBars     = 200; // Bars to search for pivots
input int             ExtendFutureBars = 100; // Bars to extend trendlines into the future

// Global indicator handle for ZigZag
int zzHandle;

// Arrays for ZigZag data and pivot storage
double   zzBuffer[];
datetime pivotTimes[];
double   pivotPrices[];
bool     pivotIsPeak[];

// Variable to detect new bars
datetime lastBarTime = 0;

//+------------------------------------------------------------------+
//| Initialization function                                          |
//+------------------------------------------------------------------+
int OnInit()
  {
   zzHandle = iCustom(_Symbol, InpTimeFrame, "ZigZag", ZZ_Depth, ZZ_Deviation, ZZ_Backstep);
   if(zzHandle == INVALID_HANDLE)
     {
      Print("Error creating ZigZag handle");
      return(INIT_FAILED);
     }
   return(INIT_SUCCEEDED);
  }

//+------------------------------------------------------------------+
//| Deinitialization function                                        |
//+------------------------------------------------------------------+
void OnDeinit(const int reason)
  {
   ObjectDelete(0, "Downtrend_HighLine");
   ObjectDelete(0, "Uptrend_LowLine");
   ObjectDelete(0, "Major_Resistance");
   ObjectDelete(0, "Major_Support");
   ObjectDelete(0, "Minor_Resistance");
   ObjectDelete(0, "Minor_Support");
   IndicatorRelease(zzHandle);
  }

//+------------------------------------------------------------------+
//| Tick function                                                    |
//+------------------------------------------------------------------+
void OnTick()
  {
   datetime currentBarTime = iTime(_Symbol, InpTimeFrame, 0);
   if(currentBarTime == lastBarTime)
      return;
   lastBarTime = currentBarTime;

// Remove previous objects
   ObjectDelete(0, "Downtrend_HighLine");
   ObjectDelete(0, "Uptrend_LowLine");
   ObjectDelete(0, "Major_Resistance");
   ObjectDelete(0, "Major_Support");
   ObjectDelete(0, "Minor_Resistance");
   ObjectDelete(0, "Minor_Support");

   if(CopyBuffer(zzHandle, 0, 0, LookBackBars, zzBuffer) <= 0)
     {
      Print("Failed to copy ZigZag data");
      return;
     }
   ArraySetAsSeries(zzBuffer, true);

   DrawZigZagTrendlines();
   DrawSupportResistance();
  }

//+------------------------------------------------------------------+
//| Draw ZigZag-based Trendlines                                     |
//+------------------------------------------------------------------+
void DrawZigZagTrendlines()
  {
   double highPrices[10], lowPrices[10];
   datetime highTimes[10], lowTimes[10];
   int highCount = 0, lowCount = 0;

// Extract swing points from the ZigZag buffer
   for(int i = 0; i < LookBackBars - 1; i++)
     {
      if(zzBuffer[i] != 0)
        {
         if(iHigh(_Symbol, InpTimeFrame, i) == zzBuffer[i] && highCount < 10)
           {
            highPrices[highCount] = zzBuffer[i];
            highTimes[highCount] = iTime(_Symbol, InpTimeFrame, i);
            highCount++;
           }
         else
            if(iLow(_Symbol, InpTimeFrame, i) == zzBuffer[i] && lowCount < 10)
              {
               lowPrices[lowCount] = zzBuffer[i];
               lowTimes[lowCount] = iTime(_Symbol, InpTimeFrame, i);
               lowCount++;
              }
        }
     }

// Exclude the most recent swing if possible
   int usedHighCount = (highCount >= 4) ? highCount - 1 : highCount;
   int usedLowCount  = (lowCount  >= 4) ? lowCount - 1  : lowCount;

   double mHigh = 0, bHigh = 0, mLow = 0, bLow = 0;
   bool validHigh = false, validLow = false;

// Regression for highs
   if(usedHighCount >= 3)
     {
      double sumT = 0, sumP = 0, sumTP = 0, sumT2 = 0;
      for(int i = 0; i < usedHighCount; i++)
        {
         double t = (double)highTimes[i];
         double p = highPrices[i];
         sumT += t;
         sumP += p;
         sumTP += t * p;
         sumT2 += t * t;
        }
      int N = usedHighCount;
      double denominator = N * sumT2 - sumT * sumT;
      if(denominator != 0)
        {
         mHigh = (N * sumTP - sumT * sumP) / denominator;
         bHigh = (sumP - mHigh * sumT) / N;
        }
      else
         bHigh = sumP / N;
      validHigh = true;
     }

// Regression for lows
   if(usedLowCount >= 3)
     {
      double sumT = 0, sumP = 0, sumTP = 0, sumT2 = 0;
      for(int i = 0; i < usedLowCount; i++)
        {
         double t = (double)lowTimes[i];
         double p = lowPrices[i];
         sumT += t;
         sumP += p;
         sumTP += t * p;
         sumT2 += t * t;
        }
      int N = usedLowCount;
      double denominator = N * sumT2 - sumT * sumT;
      if(denominator != 0)
        {
         mLow = (N * sumTP - sumT * sumP) / denominator;
         bLow = (sumP - mLow * sumT) / N;
        }
      else
         bLow = sumP / N;
      validLow = true;
     }

// Define time limits for trendlines
   datetime pastTime   = iTime(_Symbol, InpTimeFrame, LookBackBars - 1);
   datetime futureTime = lastBarTime + ExtendFutureBars * PeriodSeconds();

// Draw trendlines if both regressions are valid
   if(validHigh && validLow)
     {
      // When slopes have the same sign, use average slope
      if(mHigh * mLow > 0)
        {
         double mParallel = (mHigh + mLow) / 2.0;
         double bHighParallel = highPrices[0] - mParallel * (double)highTimes[0];
         double bLowParallel  = lowPrices[0] - mParallel * (double)lowTimes[0];

         datetime highStartTime = pastTime;
         double highStartPrice  = mParallel * (double)highStartTime + bHighParallel;
         double highEndPrice    = mParallel * (double)futureTime + bHighParallel;
         if(!ObjectCreate(0, "Downtrend_HighLine", OBJ_TREND, 0, highStartTime, highStartPrice, futureTime, highEndPrice))
            Print("Failed to create High Trendline");
         else
           {
            ObjectSetInteger(0, "Downtrend_HighLine", OBJPROP_COLOR, clrRed);
            ObjectSetInteger(0, "Downtrend_HighLine", OBJPROP_RAY_LEFT, true);
            ObjectSetInteger(0, "Downtrend_HighLine", OBJPROP_RAY_RIGHT, true);
           }

         datetime lowStartTime = pastTime;
         double lowStartPrice  = mParallel * (double)lowStartTime + bLowParallel;
         double lowEndPrice    = mParallel * (double)futureTime + bLowParallel;
         if(!ObjectCreate(0, "Uptrend_LowLine", OBJ_TREND, 0, lowStartTime, lowStartPrice, futureTime, lowEndPrice))
            Print("Failed to create Low Trendline");
         else
           {
            ObjectSetInteger(0, "Uptrend_LowLine", OBJPROP_COLOR, clrGreen);
            ObjectSetInteger(0, "Uptrend_LowLine", OBJPROP_RAY_LEFT, true);
            ObjectSetInteger(0, "Uptrend_LowLine", OBJPROP_RAY_RIGHT, true);
           }
        }
      else
        {
         datetime highStartTime = pastTime;
         double highStartPrice  = mHigh * (double)highStartTime + bHigh;
         double highEndPrice    = mHigh * (double)futureTime + bHigh;
         if(!ObjectCreate(0, "Downtrend_HighLine", OBJ_TREND, 0, highStartTime, highStartPrice, futureTime, highEndPrice))
            Print("Failed to create High Trendline");
         else
           {
            ObjectSetInteger(0, "Downtrend_HighLine", OBJPROP_COLOR, clrRed);
            ObjectSetInteger(0, "Downtrend_HighLine", OBJPROP_RAY_LEFT, true);
            ObjectSetInteger(0, "Downtrend_HighLine", OBJPROP_RAY_RIGHT, true);
           }

         datetime lowStartTime = pastTime;
         double lowStartPrice  = mLow * (double)lowStartTime + bLow;
         double lowEndPrice    = mLow * (double)futureTime + bLow;
         if(!ObjectCreate(0, "Uptrend_LowLine", OBJ_TREND, 0, lowStartTime, lowStartPrice, futureTime, lowEndPrice))
            Print("Failed to create Low Trendline");
         else
           {
            ObjectSetInteger(0, "Uptrend_LowLine", OBJPROP_COLOR, clrGreen);
            ObjectSetInteger(0, "Uptrend_LowLine", OBJPROP_RAY_LEFT, true);
            ObjectSetInteger(0, "Uptrend_LowLine", OBJPROP_RAY_RIGHT, true);
           }
        }
     }
   else
     {
      if(validHigh)
        {
         datetime highStartTime = pastTime;
         double highStartPrice  = mHigh * (double)highStartTime + bHigh;
         double highEndPrice    = mHigh * (double)futureTime + bHigh;
         if(!ObjectCreate(0, "Downtrend_HighLine", OBJ_TREND, 0, highStartTime, highStartPrice, futureTime, highEndPrice))
            Print("Failed to create High Trendline");
         else
           {
            ObjectSetInteger(0, "Downtrend_HighLine", OBJPROP_COLOR, clrRed);
            ObjectSetInteger(0, "Downtrend_HighLine", OBJPROP_RAY_LEFT, true);
            ObjectSetInteger(0, "Downtrend_HighLine", OBJPROP_RAY_RIGHT, true);
           }
        }
      if(validLow)
        {
         datetime lowStartTime = pastTime;
         double lowStartPrice  = mLow * (double)lowStartTime + bLow;
         double lowEndPrice    = mLow * (double)futureTime + bLow;
         if(!ObjectCreate(0, "Uptrend_LowLine", OBJ_TREND, 0, lowStartTime, lowStartPrice, futureTime, lowEndPrice))
            Print("Failed to create Low Trendline");
         else
           {
            ObjectSetInteger(0, "Uptrend_LowLine", OBJPROP_COLOR, clrGreen);
            ObjectSetInteger(0, "Uptrend_LowLine", OBJPROP_RAY_LEFT, true);
            ObjectSetInteger(0, "Uptrend_LowLine", OBJPROP_RAY_RIGHT, true);
           }
        }
     }
  }

//+------------------------------------------------------------------+
//| Draw Support and Resistance Levels                               |
//+------------------------------------------------------------------+
void DrawSupportResistance()
  {
   double confirmedHighs[10], confirmedLows[10];
   int confHighCount = 0, confLowCount = 0;

   for(int i = 0; i < LookBackBars - 1; i++)
     {
      if(zzBuffer[i] != 0)
        {
         if(iHigh(_Symbol, InpTimeFrame, i) == zzBuffer[i] && confHighCount < 10)
           {
            confirmedHighs[confHighCount] = zzBuffer[i];
            confHighCount++;
           }
         else
            if(iLow(_Symbol, InpTimeFrame, i) == zzBuffer[i] && confLowCount < 10)
              {
               confirmedLows[confLowCount] = zzBuffer[i];
               confLowCount++;
              }
        }
     }

   int usedHighCount = (confHighCount >= 4) ? confHighCount - 1 : confHighCount;
   int usedLowCount  = (confLowCount  >= 4) ? confLowCount - 1  : confLowCount;

   double majorResistance = -1e9, majorSupport = 1e9;
   double minorResistance = -1e9, minorSupport = 1e9;
   double tempHigh = -1e9, tempLow = -1e9;
   for(int i = 0; i < usedHighCount; i++)
     {
      if(confirmedHighs[i] > majorResistance)
        {
         tempHigh = majorResistance;
         majorResistance = confirmedHighs[i];
        }
      else
         if(confirmedHighs[i] > tempHigh)
           {
            tempHigh = confirmedHighs[i];
           }
     }
   if(tempHigh > -1e9)
      minorResistance = tempHigh;
   for(int i = 0; i < usedLowCount; i++)
     {
      if(confirmedLows[i] < majorSupport)
        {
         tempLow = majorSupport;
         majorSupport = confirmedLows[i];
        }
      else
         if(confirmedLows[i] < tempLow)
           {
            tempLow = confirmedLows[i];
           }
     }
   if(tempLow < 1e9)
      minorSupport = tempLow;

   if(usedHighCount > 0)
     {
      if(!ObjectCreate(0, "Major_Resistance", OBJ_HLINE, 0, 0, majorResistance))
         Print("Failed to create Major Resistance");
      else
         ObjectSetInteger(0, "Major_Resistance", OBJPROP_COLOR, clrMagenta);

      if(minorResistance > -1e9 && minorResistance < majorResistance)
        {
         if(!ObjectCreate(0, "Minor_Resistance", OBJ_HLINE, 0, 0, minorResistance))
            Print("Failed to create Minor Resistance");
         else
            ObjectSetInteger(0, "Minor_Resistance", OBJPROP_COLOR, clrFuchsia);
        }
     }
   if(usedLowCount > 0)
     {
      if(!ObjectCreate(0, "Major_Support", OBJ_HLINE, 0, 0, majorSupport))
         Print("Failed to create Major Support");
      else
         ObjectSetInteger(0, "Major_Support", OBJPROP_COLOR, clrAqua);

      if(minorSupport < 1e9 && minorSupport > majorSupport)
        {
         if(!ObjectCreate(0, "Minor_Support", OBJ_HLINE, 0, 0, minorSupport))
            Print("Failed to create Minor Support");
         else
            ObjectSetInteger(0, "Minor_Support", OBJPROP_COLOR, clrBlue);
        }
     }
  }
//+------------------------------------------------------------------+
//+------------------------------------------------------------------+
Outcomes
Before analyzing the outcomes, let's first add the ZigZag indicator to the chart. To gain a clearer understanding of the process, please refer to the GIF diagram below. This visual aid will help illustrate each step involved. By following the diagram, you'll see how the indicator is integrated and configured. Once that's clear, we can move on to the analysis of the results.

Fig 5. Initializing ZigZag Indicator
This series of diagrams illustrates the outcomes, with each diagram accompanied by detailed explanations. First, the diagram below shows the result obtained after running the Zig Zag Analyzer tool on the Step Index. As observed, the trendlines are accurately drawn when the EA is applied to the chart. Both the lowline and the topline slope downwards, indicating a downtrend. Additionally, the diagrams clearly display both major and minor support and resistance levels.

Fig 6. Outcome on Step Index
This screenshot provides additional insights into the analysis. In the image, you can see key swing points such as lower highs and lower lows used for constructing trendlines. Major and minor support and resistance levels are clearly marked. Notably, the intersections between the trendlines and major levels highlight strong reversal points. The highest lower high meets major resistance and the lowest lower low meets major support, where a reversal occurs.

Fig 7. Step Index
This USDCHF chart shows drawn trendlines. They are present in the market, but not overly dominant. The market respects the support and resistance levels, which validates the system's effectiveness. I have highlighted the points where the trendlines touch the market swings.
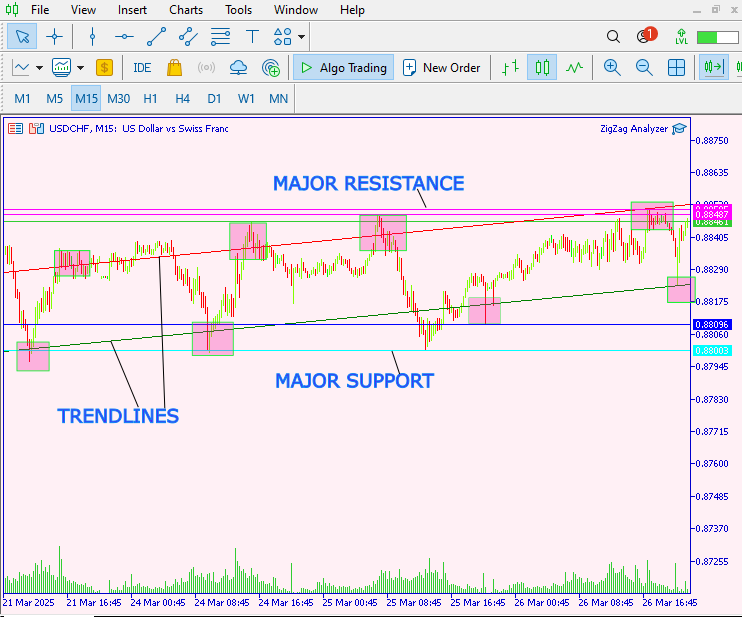
Fig 8. USDCHF
Lastly, we can view its performance on the Volatility 25 index. Trendlines are drawn clearly connecting the swing points. The lines highlight the market's movement with precision. This clarity reinforces the system's reliability in various market conditions. The results support the effectiveness of our approach.
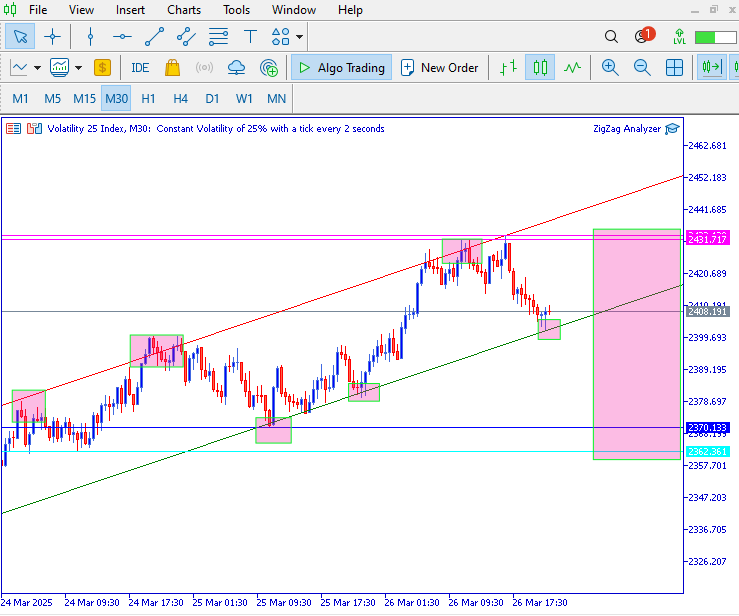
Fig 9. Volatility 25 Index
Conclusion
The Zig Zag Analyzer tool is a powerful way to automate price action analysis using MQL5. Our tests indicate that trendlines are drawn effectively in trending markets. I believe this approach can lead to the development of additional tools that detect patterns such as flag and triangle formations. When run, the Zig Zag Analyzer serves as a starting point for beginners in forex trading to observe trends and spot potential support or resistance zones. It is also valuable for experienced traders because trendlines are central to price action analysis. This tool is excellent for learning and can be customized to suit different trading strategies while incorporating other methods for confirmation.
| Date | Tool Name | Description | Version | Updates | Notes |
|---|---|---|---|---|---|
| 01/10/24 | Chart Projector | Script to overlay the previous day's price action with a ghost effect. | 1.0 | Initial Release | Tool number 1 |
| 18/11/24 | Analytical Comment | It provides previous day's information in a tabular format, as well as anticipates the future direction of the market. | 1.0 | Initial Release | Tool number 2 |
| 27/11/24 | Analytics Master | Regular Update of market metrics after every two hours | 1.01 | Second Release | Tool number 3 |
| 02/12/24 | Analytics Forecaster | Regular Update of market metrics after every two hours with telegram integration | 1.1 | Third Edition | Tool number 4 |
| 09/12/24 | Volatility Navigator | The EA analyzes market conditions using the Bollinger Bands, RSI and ATR indicators | 1.0 | Initial Release | Tool Number 5 |
| 19/12/24 | Mean Reversion Signal Reaper | Analyzes market using mean reversion strategy and provides signal | 1.0 | Initial Release | Tool number 6 |
| 9/01/25 | Signal Pulse | Multiple timeframe analyzer | 1.0 | Initial Release | Tool number 7 |
| 17/01/25 | Metrics Board | Panel with button for analysis | 1.0 | Initial Release | Tool number 8 |
| 21/01/25 | External Flow | Analytics through external libraries | 1.0 | Initial Release | Tool number 9 |
| 27/01/25 | VWAP | Volume Weighted Average Price | 1.3 | Initial Release | Tool number 10 |
| 02/02/25 | Heikin Ashi | Trend Smoothening and reversal signal identification | 1.0 | Initial Release | Tool number 11 |
| 04/02/25 | FibVWAP | Signal generation through python analysis | 1.0 | Initial Release | Tool number 12 |
| 14/02/25 | RSI DIVERGENCE | Price action versus RSI divergences | 1.0 | Initial Release | Tool number 13 |
| 17/02/25 | Parabolic Stop and Reverse (PSAR) | Automating PSAR strategy | 1.0 | Initial Release | Tool number 14 |
| 20/02/25 | Quarters Drawer Script | Drawing quarters levels on chart | 1.0 | Initial Release | Tool number 15 |
| 27/02/25 | Intrusion Detector | Detect and alert when price reaches quarters levels | 1.0 | Initial Release | Tool number 16 |
| 27/02/25 | TrendLoom Tool | Multi timeframe analytics panel | 1.0 | Initial Release | Tool number 17 |
| 11/03/25 | Quarters Board | Panel with buttons to activate or disable quarters levels | 1.0 | Initial Release | Tool number 18 |
| 26/03/25 | ZigZag Analyzer | Drawing trendlines using ZigZag Indicator | 1.0 | Initial Release | Tool number 19 |
Warning: All rights to these materials are reserved by MetaQuotes Ltd. Copying or reprinting of these materials in whole or in part is prohibited.
This article was written by a user of the site and reflects their personal views. MetaQuotes Ltd is not responsible for the accuracy of the information presented, nor for any consequences resulting from the use of the solutions, strategies or recommendations described.

- Free trading apps
- Over 8,000 signals for copying
- Economic news for exploring financial markets
You agree to website policy and terms of use
I find this indicator very interesting. It would help me a lot in my technical analysis, since I spend the most time on it to find the right trend, support, and resistance. I downloaded the code, and it compiled correctly, but when I added it to the chart, no information is reflected. Am I doing something wrong? I've attached a video again. Regards.
>Hi Cristina, greetings.
I find this indicator very interesting. It would help me a lot in my technical analysis, since I spend the most time on it to find the right trend, support, and resistance. I downloaded the code, and it compiled correctly, but when I added it to the chart, no information is reflected. Am I doing something wrong? I've attached a video again. Regards.
Hie diego herrera
>Hi Cristina, greetings.
I find this indicator very interesting. It would help me a lot in my technical analysis, since I spend the most time on it to find the right trend, support, and resistance. I downloaded the code, and it compiled correctly, but when I added it to the chart, no information is reflected. Am I doing something wrong? I've attached a video again. Regards.
try this