
Price Action Analysis Toolkit Development (Part 51): Revolutionary Chart Search Technology for Candlestick Pattern Discovery

Introduction
Candlestick patterns remain one of the most enduring and visually intuitive tools in technical analysis. They capture the ongoing struggle between buyers and sellers, leaving behind a clear record of market sentiment and momentum. Traders and developers alike continue to revisit this subject because candlesticks are, in many ways, the true footprints of price action. They reflect where the market has been and, quite often, hint at where it might go next. Every candlestick formation tells a story about what has occurred at a particular price level and time. These formations have been studied, named, and classified for decades, each carrying its own forecasting implications. A well‑known example is the bullish engulfing pattern, which is often seen as an early sign of renewed buying strength.
The continued interest in candlestick analysis within MQL5 development stems from hands‑on experience in the market. The more one observes live price behavior, the more challenges emerge—and with them, opportunities to create smarter solutions. MQL5 proves to be an exceptionally rich environment for that creativity; its flexibility allows technical ideas to evolve into complete, working tools capable of analyzing charts automatically and visually.
This article introduces CandlePatternSearch.mq5, an Expert Advisor designed to extend the traditional study of candlestick formations through automation and interactivity. The system scans and detects a wide range of common patterns and allows users to search for specific ones directly on the chart. Detected formations are visually marked, making it easier to explore how each pattern has influenced price across different instruments and timeframes. Over time, this capability helps traders recognize recurring market behaviors and build confidence in anticipating probable outcomes when certain patterns appear.

In the following sections, we will explore the Features Overview, Technical Architecture, Testing and Outcomes, and finally the Conclusion. The table of contents below outlines the structure of the article, followed by a detailed discussion of each section.
Features Overview
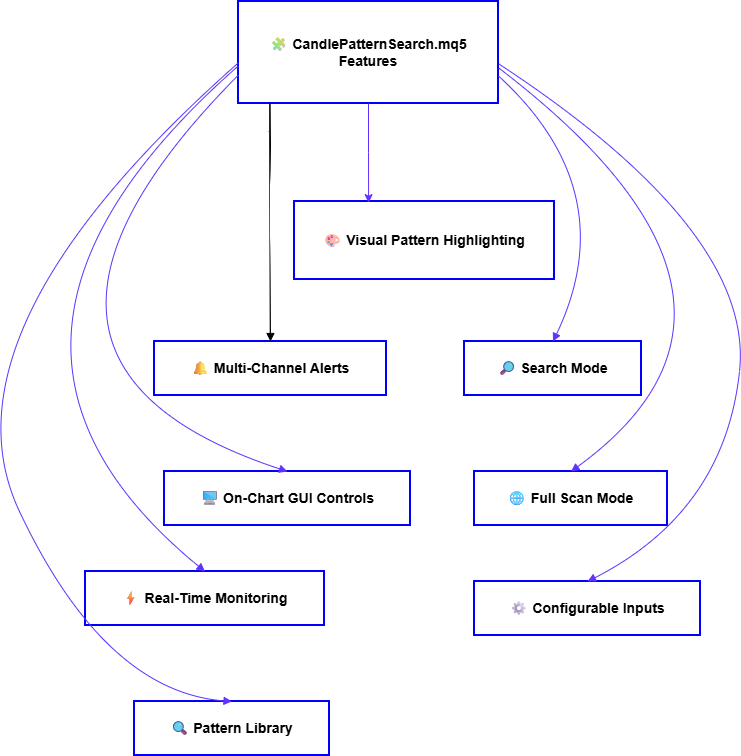
The CandlePatternSearch.mq5 has been designed as a complete framework for detecting, displaying, and monitoring classical candlestick patterns directly on MetaTrader 5 charts. It combines detailed pattern recognition algorithms with a responsive graphical control panel, giving traders the ability to interact with charts in a way that supports fast visual analysis and informed decision‑making.
The following key features define the tool’s capabilities:
1. Extensive Pattern Library
The EA supports a wide range of popular single, double, and triple‑candle formations, including Doji, Hammer, Bullish/Bearish Engulfing patterns, Morning Star, Evening Star, Three White Soldiers, Three Black Crows, and more. This allows analysts to cover multiple price‑action scenarios without needing separate indicators for each.
2. Interactive On‑Chart Control Panel
A built‑in GUI offers direct access to essential functions without navigating MetaTrader 5 menus. Traders can search for a specific pattern by name, scan all supported patterns within a chosen lookback period, clear markings, or toggle real‑time monitoring—all through dedicated buttons and input fields.
3. Pattern Search Capability
Instead of manually scrolling through the chart looking for formations, the tool can locate and highlight only the patterns that match your search criteria. This targeted approach is ideal for strategy testing or reviewing the historical performance of a specific candlestick setup.
4. Comprehensive Scanning Function
A full scan mode analyzes all bars within the specified lookback period, marking every match from the EA’s pattern library. This is especially useful for broader statistical studies or for building a general overview of market conditions.
5. Real‑Time Monitoring Mode
When enabled, this mode continuously observes each new bar as it forms, checking for new patterns within the most recent candles. The monitoring system uses cooldown logic per pattern type to avoid repetitive alerts for identical setups.
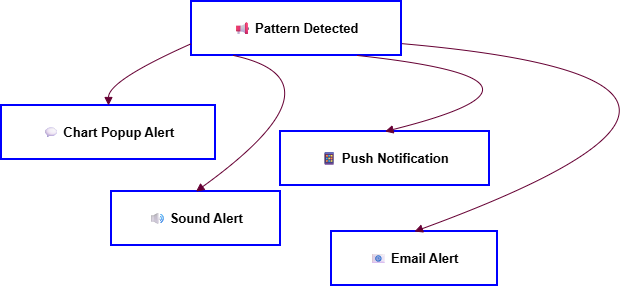
6. Multi‑Channel Alert System
Detected patterns can trigger chart pop‑ups, sound notifications, push messages to the MetaTrader 5 mobile app, and even emails—fully configurable to match your trading workflow.
7. Visual Pattern Highlighting
Each detection is marked on the chart with a colored rectangle covering the entire formation, allowing for quick identification and visual backtesting without disrupting standard chart elements.
8. Customizable Parameters
All operational aspects—from lookback periods and alert behavior to highlighting color and maximum patterns displayed—can be adjusted to suit personal trading preferences or optimize chart clarity.
By bringing together these capabilities, CandlePatternSearch.mq5 offers more than a static indicator. It is an actively responsive tool designed to work in real market conditions, operate over any timeframe or currency pair, and adapt to both discretionary and systematic trading approaches.
Technical Architecture
This Expert Advisor is structured around several key components that work together to deliver fast scanning, pattern detection, alerting, and real‑time monitoring. Each segment of its design serves a specific purpose—from managing user input settings to analyzing candle data, rendering graphical controls, and executing notifications.
The architecture can broadly be divided into the following functional areas:
- Input Parameters and Configuration
- Supported Patterns and Detection Logic
- Real‑Time Monitoring
- Alert Mechanism
- Graphical User Interface (GUI)
- Pattern Highlighting on the Chart
- Searching versus Scanning All Patterns
Each of these will be discussed in detail below.
1. Input Parameters
One of the EA’s strengths lies in its adaptability. All core behaviors, from scanning scope to visual style and alerting rules, are controlled via easily adjustable input parameters. These inputs allow traders to fine‑tune the tool for performance, signal frequency, and clarity.
| Parameter | Type | Default Value | Description |
|---|---|---|---|
| LookbackPeriod | int | 1000 | Determines how many historical bars to analyze during initial scanning routines. Larger values cover more data but may slightly increase computation time. |
| PatternColor | color | clrDodgerBlue | Defines the highlight color used when marking detected candlestick formations on the chart. |
| MaxDisplayPatterns | int | 100 | Limits how many highlighted patterns can appear simultaneously to maintain chart clarity and performance. |
| EnableAlerts | bool | true | Global switch for all alert channels. When disabled, no notifications or sounds will trigger. |
| SoundAlerts | bool | true | Enables or disables an audio tone whenever a new pattern is detected. |
| PushNotifications | bool | false | Sends detection messages to the MetaTrader 5 mobile application for remote monitoring. Requires push configuration inside terminal settings. |
| EmailAlerts | bool | false | Sends detection details to a configured email address using the terminal’s mail settings. |
| AlertCooldown | int | 60 | Time in seconds before the same pattern can trigger another alert, preventing repetition during active markets. |
Through the combination of these settings, the EA can be adjusted for both light and intensive tasks. For example, a trader performing back‑testing might increase the lookback range while disabling live alerts, whereas a day trader could set a shorter scan period and enable push notifications to catch real‑time opportunities. Internally, all parameters are handled using standard input declarations, ensuring that modifications appear directly in the MetaTrader 5 Inputs tab. This design allows immediate tuning without editing or recompiling the source code, a convenience feature especially helpful when transferring settings between charts or symbols.
//+------------------------------------------------------------------+
//| Input Parameters                                                 |
//+------------------------------------------------------------------+
input int      LookbackPeriod      = 1000;         // Number of bars to scan
input color    PatternColor        = clrDodgerBlue;// Highlight colour for detected patterns
input int      MaxDisplayPatterns  = 100;          // Limit to avoid chart clutter

// Alert settings
input bool     EnableAlerts        = true;         // Master switch for all alerts
input bool     SoundAlerts         = true;         // Play sound for new detection
input bool     PushNotifications   = false;        // Send push message to MT5 mobile
input bool     EmailAlerts         = false;        // Send detection details via email
input int      AlertCooldown       = 60;           // Seconds before same pattern alerts again
Next, we’ll go into Supported Patterns & Detection Logic, which explains the internal algorithms used to identify candlestick formations from the historical price data.
2. Supported Patterns & Detection Logic
In this section lies the tool's ability to correctly identify classical candlestick formations. The EA’s detection system is designed around a structured library of patterns, each mapped to a dedicated function that analyzes a defined number of bars.
The patterns are grouped by the number of candles they require:
Single‑Candle Patterns
These are identified using the properties of a single bar, such as body size, shadow length, and relative position within its range.
- Doji: Characterized by an open and close price being very close together, suggesting indecision in the market.
- Hammer and Inverted Hammer: Small bodies near the high or low of the candle with long wicks indicating potential reversals.
- Hanging Man: Similar body shape to the Hammer but appearing after an uptrend, possibly signaling bearish pressure.
- Shooting Star: Small body near the low with a long upper wick, indicating rejection at higher prices.
- Spinning Top: Moderate shadows and a small body, often reflecting market balance.
- Marubozu: A candle with little or no shadows, showing strong directional momentum.
Two‑Candle Patterns
These rely on the interaction between consecutive bars, such as the engulfing of one bar’s body by another.
- Bullish Engulfing / Bearish Engulfing: A candle whose body engulfs the previous one, hinting at directional change.
- Piercing Line / Dark Cloud Cover: The second candle’s position partially reverses the prior candle’s move, often signaling trend shifts.
- Bullish Harami / Bearish Harami: The first candle’s body contains the second, suggesting a possible loss of momentum.
- Tweezer Top / Tweezer Bottom: Matching highs or lows on consecutive bars, indicating strong support or resistance rejection.
These formations use three consecutive bars and often represent sustained sentiment changes.
- Morning Star / Evening Star: A strong candle followed by a small indecisive one, then a strong candle in the opposite direction.
- Three White Soldiers: Three consecutive bullish candles, typically marking strong upward momentum.
- Three Black Crows – Three consecutive bearish candles, often signaling strong downward pressure.
Algorithmic Detection Approach
The EA uses the following common steps to determine whether a pattern is present at a specific index in the historical data (rates array):
1. Retrieve Data: Using CopyRates, a segment of historical prices (open, high, low, close, volume) is loaded into an MqlRates array.
2. Check Candle Count Conditions: Each detection function first verifies that enough bars are available for analysis (e.g., a triple‑candle pattern won’t run if fewer than three candles exist after the selected index).
3. Apply Ratio/Relative Position Checks:
Calculations include
- Body size vs. total candle range
- Upper/lower shadow lengths
- Candle position in relation to previous bars
- Opening and closing price relationship
4. Pattern Match Confirmation: If all logical conditions match the stored definition (e.g., for a Doji, body size < defined small threshold), the function returns a pattern name string.
5. Mark and Proceed: Once detected, the EA calls the pattern marking function to visually highlight the formation on the chart and record it in the results display.
This approach ensures each pattern’s rules are isolated in its own function, making the library easy to expand. Adding a new pattern simply requires writing a recognition function and updating the scanning arrays—no major code restructuring needed.
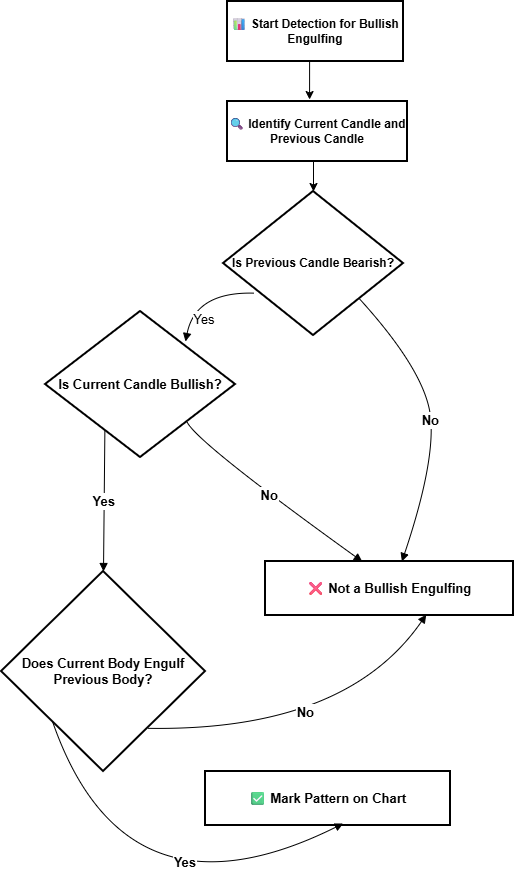
//+------------------------------------------------------------------+
//| Detect Bullish Engulfing pattern                                 |
//+------------------------------------------------------------------+
bool isBullishEngulfing(int index, const MqlRates &rates[])
{
   // Make sure we have at least 2 bars from 'index'
   if(index+1 >= ArraySize(rates))
      return false;

   double prevOpen  = rates[index+1].open;
   double prevClose = rates[index+1].close;
   double currOpen  = rates[index].open;
   double currClose = rates[index].close;

   // Check if current candle bullish and fully engulfs previous body
   if(currClose > currOpen &&       // Current bullish
      prevClose < prevOpen &&       // Previous bearish
      currOpen < prevClose &&       // Current's open below previous close
      currClose > prevOpen)         // Current's close above previous open
   {
      return true;
   }
   return false;
}

//+------------------------------------------------------------------+
//| Detect Doji pattern                                              |
//+------------------------------------------------------------------+
bool isDoji(int index, const MqlRates &rates[])
{
   if(index >= ArraySize(rates))
      return false;

   double open  = rates[index].open;
   double close = rates[index].close;
   double high  = rates[index].high;
   double low   = rates[index].low;

   double body  = MathAbs(close - open);
   double range = high - low;

   // Define the ratio threshold for Doji
   double dojiRatio = 0.1; // 10% of total range

   if(body <= (range * dojiRatio))
      return true;

   return false;
}
3. Real–Time Monitoring Logic
One of the standout features of CandlePatternSearch.mq5 is its ability to operate in real‑time mode. Instead of only scanning historical data, the EA actively monitors each newly formed candle on the chart, checking for any of the supported patterns immediately as the market evolves. This function is particularly valuable for traders who want to react instantly to fresh market signals rather than rely solely on back‑analyzed data. By tying into the MetaTrader 5 OnTick event, the system evaluates conditions every time the price updates, while also keeping track of alert cooldowns to avoid excessive repetition.
Process Outline
- Trigger Point: Each market tick activates the monitoring routine through the OnTick event handler.
- Bar Completion Check: The EA verifies whether the last bar (index 0) has closed or if a new bar has started. This prevents false detections from mid‑forming candles.
- Pattern Scan: The most recent candles—generally the last 3–5 bars—are evaluated against every detection function in the library.
- Cooldown Enforcement: If the same pattern was detected recently, a cooldown timer prevents re‑alerting within the defined AlertCooldown period.
- Mark and Alert: Valid patterns are visually marked on the chart, and the configured notification modes (sound, pop‑up, push, email) are triggered.
Advantages
- Immediate feedback: Traders know about new setups as they appear.
- Reduced scanning load: Only the latest candles are analyzed when live, minimizing CPU use compared to scanning hundreds of historical bars.
- Adaptive response: Alerts can be toggled without restarting the EA, providing control during volatile periods.
// Store last alert times for each pattern
datetime lastAlertTime[50]; // assuming 50 possible patterns indexed

//+------------------------------------------------------------------+
//| Tick handler for real-time monitoring                            |
//+------------------------------------------------------------------+
void OnTick()
{
   static datetime lastBarTime = 0;

   // Get latest bar time
   datetime currentBarTime = iTime(_Symbol, _Period, 0);

   // Check if a new bar has formed
   if(currentBarTime != lastBarTime)
   {
      lastBarTime = currentBarTime;

      // Copy recent candle data (last 5 bars)
      MqlRates rates[];
      if(CopyRates(_Symbol, _Period, 0, 5, rates) < 5)
         return;

      // Scan patterns for last completed candle (index 1)
      for(int p = 0; p < totalPatterns; p++)
      {
         bool detected = patterns[p].function(1, rates);

         // Check cooldown before alerting
         if(detected && (TimeCurrent() - lastAlertTime[p] > AlertCooldown))
         {
            markPatternOnChart(p, 1, rates);
            sendAlerts(p, rates[1]);

            lastAlertTime[p] = TimeCurrent();
         }
      }
   }
}
We track the lastBarTime so the scan only runs when a new candle completes. The EA copies the most recent 5 bars and then runs each detection function on the last completed bar (index 1).The lastAlertTime[] keeps track of when each pattern was last detected to avoid alert spam during volatile market moves.
4. Alert Mechanism
The alert system is designed to notify traders as soon as a chosen candlestick pattern is confirmed, either during historical scanning or in real‑time mode. Its flexibility lies in supporting multiple communication channels that can work independently or together, depending on the trader’s preferences.
Supported Alert Types
- Chart Pop‑Up Notification: A simple, in‑terminal message displayed via Alert()—ideal for quick awareness when actively watching charts.
- Sound Alert: Plays an audio file when a pattern is detected, useful for traders who step away from the screen but remain near the workstation.
- Push Notification: Sends a message to the MetaTrader 5 mobile app, allowing remote monitoring of setups in real time. This requires push configuration in the MetaTrader 5 terminal settings.
- Email Alert: Sends a formatted email containing symbol, timeframe, pattern name, and detection time. This is useful for traders running MetaTrader 5 on a VPS or away from the platform for extended periods.
Internal Workflow
When a detection occurs, the alert request comes from the markPatternOnChart or detection function call. The EA checks the global EnableAlerts flag. For each enabled channel, the corresponding function runs—for example:
- Alert() for chart pop‑ups
- PlaySound() for audio
- SendNotification() for push
- SendMail() for email
Cooldown times per pattern are enforced to avoid repeated alerts.
//+------------------------------------------------------------------+
//| Send Alerts for a detected pattern                               |
//+------------------------------------------------------------------+
void sendAlerts(int patternIndex, MqlRates candle)
{
   // Retrieve pattern name
   string name = patterns[patternIndex].name;

   // Build common message
   string msg = StringFormat("Pattern Detected: %s on %s M%d\nOpen: %.5f | Close: %.5f | Time: %s",
                              name, _Symbol, _Period,
                              candle.open, candle.close,
                              TimeToString(candle.time, TIME_DATE|TIME_MINUTES));

   // Chart pop-up
   if(EnableAlerts)
      Alert(msg);

   // Sound alert
   if(SoundAlerts)
      PlaySound("alert.wav"); // Make sure file exists in Sounds folder

   // Push notification
   if(PushNotifications)
      SendNotification(msg);

   // Email alert
   if(EmailAlerts)
      SendMail("CandlePattern Alert", msg);
}
All alert messages share the same core text (msg) for consistency across channels. The function checks each channel’s boolean parameter before execution. Adding new channels (e.g. logging to file, sending to external API) would simply require another conditional block. The next logical step in Technical Architecture is Graphical User Interface (GUI)—which will describe the on‑chart interactive control panel and include another handy snippet showing how button clicks are processed.
5. Graphical User Interface (GUI) Implementation
One of the features that makes CandlePatternSearch.mq5 highly practical is its built‑in on‑chart control panel. Instead of requiring traders to adjust inputs through the MetaTrader 5 Properties window each time, the EA provides an interactive interface where actions such as starting a search, scanning all patterns, clearing highlights, or toggling real‑time monitoring can be executed instantly with a single click. The GUI uses MetaTrader 5 chart objects, primarily OBJ_BUTTON, OBJ_LABEL, and simple shapes for layout, allowing it to remain lightweight without additional libraries. Each button is linked to an event handler that interprets clicks (OnChartEvent) and runs the correct function inside the EA.
Key GUI Elements
- Search Field: An editable input where the user can type the name of a pattern to locate it specifically.
- Search Button: Initiates a history scan for the typed pattern, and highlights all found occurrences.
- Scan All Button: Triggers full multi‑pattern scanning over the lookback period.
- Clear Button: Removes all highlights from the chart to clear the workspace.
- Monitor Toggle: Activates or deactivates real‑time monitoring mode.
- Status Display: A small label showing current mode, detected counts, or last found pattern.
Advantages
- Direct control without restarting EA: Changes occur instantly.
- Fast workflow: Reduces friction compared to navigating input tabs.
- Visual feedback: Users see immediate confirmation through chart elements.
Creating GUI Buttons
//+------------------------------------------------------------------+
//| Create basic GUI buttons on initialization                       |
//+------------------------------------------------------------------+
void createGUI()
{
   // Search Button
   ObjectCreate(0, "btnSearch", OBJ_BUTTON, 0, 0, 0);
   ObjectSetInteger(0, "btnSearch", OBJPROP_XDISTANCE, 20);
   ObjectSetInteger(0, "btnSearch", OBJPROP_YDISTANCE, 20);
   ObjectSetInteger(0, "btnSearch", OBJPROP_XSIZE, 80);
   ObjectSetInteger(0, "btnSearch", OBJPROP_YSIZE, 20);
   ObjectSetString(0, "btnSearch", OBJPROP_TEXT, "Search");

   // Scan All Button
   ObjectCreate(0, "btnScanAll", OBJ_BUTTON, 0, 0, 0);
   ObjectSetInteger(0, "btnScanAll", OBJPROP_XDISTANCE, 110);
   ObjectSetInteger(0, "btnScanAll", OBJPROP_YDISTANCE, 20);
   ObjectSetInteger(0, "btnScanAll", OBJPROP_XSIZE, 80);
   ObjectSetInteger(0, "btnScanAll", OBJPROP_YSIZE, 20);
   ObjectSetString(0, "btnScanAll", OBJPROP_TEXT, "Scan All");

   // Clear Button
   ObjectCreate(0, "btnClear", OBJ_BUTTON, 0, 0, 0);
   ObjectSetInteger(0, "btnClear", OBJPROP_XDISTANCE, 200);
   ObjectSetInteger(0, "btnClear", OBJPROP_YDISTANCE, 20);
   ObjectSetInteger(0, "btnClear", OBJPROP_XSIZE, 80);
   ObjectSetInteger(0, "btnClear", OBJPROP_YSIZE, 20);
   ObjectSetString(0, "btnClear", OBJPROP_TEXT, "Clear");
}
Handling Button Clicks
//+------------------------------------------------------------------+
//| Handle chart events such as button clicks                        |
//+------------------------------------------------------------------+
void OnChartEvent(const int id,
                  const long &lparam,
                  const double &dparam,
                  const string &sparam)
{
   // Check if the event is an object click
   if(id == CHARTEVENT_OBJECT_CLICK)
   {
      if(sparam == "btnSearch")
      {
         searchPattern(patternNameInput); // custom function
      }
      else if(sparam == "btnScanAll")
      {
         scanAllPatterns();
      }
      else if(sparam == "btnClear")
      {
         clearHighlights();
      }
   }
}
- The createGUI() builds the buttons with their size, position, and caption.
- The OnChartEvent() listens for clicks—the sparam contains the object name.
Each button name maps to a specific EA function (search, scan, clear). The next subsection we need to cover is Pattern Highlighting on Chart, which will explain how detections are visually marked (rectangles, labels, color coding) and why that’s important for analysis.
6. Pattern Highlighting on Chart
Visual representation is one of the most important aspects of CandlePatternSearch.mq5. Once a candlestick pattern is detected—whether through a targeted search, a full scan, or real‑time monitoring—the EA marks the formation directly on the chart for immediate recognition.
Highlighting Method
The tool uses rectangular chart objects (OBJ_RECTANGLE) to cover the bars that make up a pattern. Each rectangle is drawn across the candle’s high and low prices, and spans horizontally from the pattern’s first to last candle. This way, even multi‑candle formations are clear and isolated visually.
To differentiate between pattern types:
- Each type has a unique color (customizable via PatternColor input or per pattern).
- Transparency is set to avoid hiding underlying chart candles.
- Optional text labels can be placed above or below the rectangle to name the formation.
Benefits of Visual Highlighting
The visual highlighting feature offers multiple advantages. It provides instant recognition, allowing traders to identify candlestick formations directly on the chart without reading logs or relying solely on alerts. It also supports historical study, enabling users to scroll back through past data and observe how price reacted after similar setups appeared. Finally, it serves as a tool for structured learning—for traders still mastering candlestick analysis, seeing patterns displayed in real market conditions reinforces recognition skills and builds analytical confidence.
//+------------------------------------------------------------------+
//| Mark detected pattern on chart                                   |
//+------------------------------------------------------------------+
void markPatternOnChart(int patternIndex, int startIndex, const MqlRates &rates[])
{
   string name = patterns[patternIndex].name;
   string objName = StringFormat("%s_%d", name, startIndex);

   // Determine high and low for the pattern
   double highPrice = rates[startIndex].high;
   double lowPrice  = rates[startIndex].low;

   int candleCount = patterns[patternIndex].barsRequired;
   for(int i = 0; i < candleCount; i++)
   {
      if(rates[startIndex+i].high > highPrice) highPrice = rates[startIndex+i].high;
      if(rates[startIndex+i].low < lowPrice)  lowPrice  = rates[startIndex+i].low;
   }

   datetime startTime = rates[startIndex + candleCount - 1].time;
   datetime endTime   = rates[startIndex].time;

   // Create rectangle object
   ObjectCreate(0, objName, OBJ_RECTANGLE, 0, endTime, highPrice, startTime, lowPrice);
   ObjectSetInteger(0, objName, OBJPROP_COLOR, PatternColor);
   ObjectSetInteger(0, objName, OBJPROP_STYLE, STYLE_SOLID);
   ObjectSetInteger(0, objName, OBJPROP_WIDTH, 1);
   ObjectSetInteger(0, objName, OBJPROP_FILL, true);
   ObjectSetInteger(0, objName, OBJPROP_ZORDER, 0);
}
The markPatternOnChart() draws a rectangle that spans across the candles forming the detected pattern. It calculates the highest high and lowest low within the pattern range to make the rectangle’s vertical limits accurate. The _barsRequired property ensures multi‑candle formations are fully covered.
7. Searching vs Scanning All Patterns
The CandlePatternSearch.mq5 provides two distinct detection modes that work from the same underlying recognition logic but serve different purposes.
Pattern Search Mode
In pattern search mode, the user specifies the exact candlestick formation to locate—either by typing its name into the on‑chart search field or by passing it as an argument to the search function. The Expert Advisor then processes the historical data within the set LookbackPeriod, marking only the occurrences that match the requested pattern. This targeted approach is well‑suited for testing the historical performance of a single setup, studying entry and exit behaviors in relation to that formation, and developing strategies focused around a specific signal.
Full Scan Mode
In full scan mode, the EA takes a broader approach, ignoring any name filter and evaluating every pattern in its internal library against the chart data. It highlights all matches found within the lookback range, regardless of type. This mode is particularly useful for creating a statistical overview of market sentiment, examining the frequency and interaction of multiple setups, or quickly spotting trading opportunities without bias toward one signal.
From a performance perspective, pattern search generally executes faster because it runs only one detection function per candle index. Full scanning requires all detection functions to be executed for every bar analyzed, which can be heavier with a large pattern library, but the EA’s optimized structure keeps it efficient even over extended history ranges.
// Search for a specific pattern
void searchPattern(string patternName)
{
   MqlRates rates[];
   if(CopyRates(_Symbol, _Period, 0, LookbackPeriod, rates) <= 0)
      return;

   for(int i = LookbackPeriod-1; i >= 0; i--)
   {
      if(matchPatternByName(patternName, i, rates))
         markPatternOnChart(getPatternIndex(patternName), i, rates);
   }
}

// Scan all patterns in the library
void scanAllPatterns()
{
   MqlRates rates[];
   if(CopyRates(_Symbol, _Period, 0, LookbackPeriod, rates) <= 0)
      return;

   for(int i = LookbackPeriod-1; i >= 0; i--)
   {
      for(int p = 0; p < totalPatterns; p++)
      {
         if(patterns[p].function(i, rates))
            markPatternOnChart(p, i, rates);
      }
   }
}
- searchPattern() loops through historical bars, calling only the match function for the specified pattern.
- scanAllPatterns() loops through all patterns for each historical candle index.
- Both functions call markPatternOnChart() to visually highlight matches found.
Testing and Outcomes
To assess the accuracy and practical usability of CandlePatternSearch.mq5, multiple tests were conducted using synthetic high‑volatility instruments and standard Forex pairs. The screenshots presented here show the EA running on the Volatility 75 (1s) Index in the M5 timeframe, using tick‑by‑tick data for high‑frequency observation.
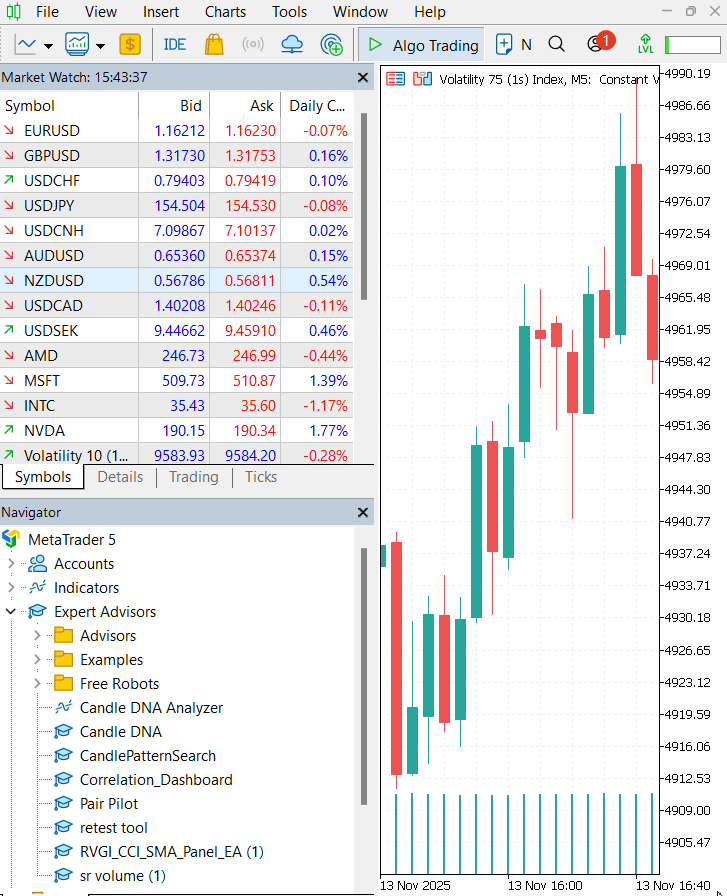
During testing for a Bullish Engulfing setup, the EA scanned 1,000 historical bars within the selected LookbackPeriod and successfully identified 52 occurrences matching the defined pattern logic. Each detection was highlighted directly on the chart using rectangular blue overlays, with every box spanning the two‑candle range of the engulfing formation. This immediate visual marking allowed quick recognition of the setup without needing to navigate log data.

The on‑chart GUI control panel proved highly efficient for testing workflows. By typing the name of the pattern into the search field and clicking Search, the scan completed in under a second, even with a busy tick flow from the Volatility Index feed. The tool returned not only the marked patterns but also updated the status panel with total detections and the timestamp of the last scan—ensuring repeat tests could be timed and validated.
In repeated trials across different instruments (e.g., EURUSD, USDJPY, NZDUSD), the EA maintained accuracy, with no false positives beyond the defined candle ratio thresholds. The Full Scan Mode was able to evaluate the entire candlestick library, returning mixed detection types in a single operation; however, in extremely high‑volatility conditions such as the Volatility 75 Index, pattern frequency increased significantly, requiring moderation via the MaxDisplayPatterns input to avoid visual clutter.

Key outcome observations:
- Accuracy: Detection logic matched textbook definitions when cross‑checked visually and manually.
- Speed: Scans completed almost instantly on standard Forex data, and within acceptable time on heavy synthetic indices.
- Usability: The GUI allowed rapid switching between targeted search and full scan without stopping or recompiling the EA.
- Learning Utility: For newer traders, visual marking reinforced candlestick pattern recognition over live and historical data.
These results confirm CandlePatternSearch.mq5 is reliable both for targeted pattern studies and broad‑spectrum market observation, with its speed and clarity making it useful in real‑time as well as post‑analysis contexts.
Conclusion
The development and testing of CandlePatternSearch.mq5 demonstrate that a well‑structured, modular approach to candlestick pattern recognition can deliver both accuracy and operational efficiency in the MetaTrader 5 environment. By combining a wide pattern library, a responsive on‑chart control panel, real‑time monitoring, and multi‑channel alert capabilities, the tool bridges the gap between theoretical pattern definitions and their practical application in live markets.
Testing across both synthetic indices and traditional Forex pairs confirmed that detection results were consistent with textbook criteria, while the visual highlighting system provided immediate recognition and valuable historical context. The ability to switch seamlessly between targeted search and full‑scan modes, without interrupting the Expert Advisor’s operation, further enhanced usability during both exploratory analysis and active trading sessions. For discretionary traders, the EA offers an intuitive way to reinforce pattern recognition skills and integrate them into decision‑making processes. For systematic traders and developers, the modular detection logic and configurable inputs provide a strong foundation for extending the tool into automated or semi‑automated strategies.
In short, CandlePatternSearch.mq5 is more than a pattern‑marking utility—it is a flexible analytical framework, capable of supporting disciplined trading practice, deeper statistical research, and real‑time market awareness. Its design makes it an asset for any trader seeking clarity in the often complex language of candlestick formations.
Read my other articles.
Warning: All rights to these materials are reserved by MetaQuotes Ltd. Copying or reprinting of these materials in whole or in part is prohibited.
This article was written by a user of the site and reflects their personal views. MetaQuotes Ltd is not responsible for the accuracy of the information presented, nor for any consequences resulting from the use of the solutions, strategies or recommendations described.

- Free trading apps
- Over 8,000 signals for copying
- Economic news for exploring financial markets
You agree to website policy and terms of use