
Testing different Moving Average types to see how insightful they are
Introduction
In my previous article, we considered the most popular types of Moving Averages (simple, weighted, exponential): Learn how to design different Moving Average systems. We will continue this topic in this article and we will use the simple type to compare its results with other types of moving averages. A lot of traders use the moving average in the different types according to their preferences. So, in this article, we will consider different types of them in detail, will test their performances and will compared the results to define which of the types performs better.
For the purpose of this article, we will create a simple application in order to performing backtesting of the averages in the built-in MetaTrader 5 Strategy Tester. To understand what we need to focus on when studying testing results, please check out my previous article Understand and Use MQL5 Strategy Tester Effectively; it provides a lot of useful information.
To consider different types of moving averages and to see how they perform, we will go through the following topics:
- Simple Moving Average (SMA) System Testing
- Adaptive Moving Average (iAMA)
- Double Exponential Moving Average (iDEMA)
- Triple Exponential Moving Average (iTEMA)
- Fractal Adaptive Moving Average (iFrAMA)
- Comparing Results with Simple Moving Average (SMA) Results
- Conclusion
Please note that although I will try to optimize the settings of every moving average to get the best results, you need to do more check and test by yourself as the object here is education only. So, you should test, optimize, and find better settings that can give you better results. It may happen so that any one or all of these types are not suitable for your trading style. But I hope that you will find insights that can be helpful to improve your trading. In general, whatever ideal you meet, it important to measure the performance of any trading strategy before using it in a real account.
Simple Moving Average (SMA) System Testing
In this part, I will share the results of the simple system which is based only on a simple one-moving average strategy. It finds the crossover between the price and the simple moving average line which will generate buying and selling signals. We will create a system that will be able to execute these signals automatically.
We will use the following signals to perform trading operations:
Buy signal:
The closing price is above the simple moving average value
And, The previous closing price was below the previous simple moving average value
Sell signal:
The closing price is below the simple moving average value
And, The previous closing price was above the previous simple moving average value
If you want to read about the simple moving average and other popular moving average types, I recommend reading my previous article Learn how to design different Moving Average systems as I mentioned which will help you understand well about them and this will help to understand this article very well.
The following are steps to create this type of trading system that can be able to execute buying and selling orders automatically based on these mentioned signals.
In the global scope, we will include the Trade include file to the software which enables using executing orders based on our signals by using the preprocessor #include. If you want to read more about the preprocessor you can read the article Everything you need to learn about the MQL5 program structure for more details.
#include <Trade\Trade.mqh> Create three user inputs for the double variable of lotSize, ENUM_TIMEFRAMES variable of timeFrame, and integer variable of MAPeriod to be changed as per user desire with initiating default values for them:
input double lotSize = 1;
input ENUM_TIMEFRAMES timeFrame = PERIOD_H1;
input int MAPeriod= 50;
Create two integer variables of simpleMA and barsTotal without assignment as we will define them later in the OnInit() part
int simpleMA;
int barsTotal;
Create trade as an object from CTrade class for easy access to the trade functions
CTrade trade;
In the OnInit() part, we will define the simpleMA by using the iMA function to return the handle of the moving average indicator, and its parameters are:
- symbol: to specify the symbol name, we will use _Symbol for the current symbol
- period: to specify the time frame we will use the user input with a default value of 1 hour but the user can adjust it
- ma_period: to specify the simple moving average period, we will use the user input with a default value of 50 but the user can adjust it also
- ma_shift: to specify the horizontal shift, we will use 0
- applied_price: to specify the price type, we will use the closing price for simple moving average calculation.
simpleMA = iMA(_Symbol, timeFrame, MAPeriod, 0, MODE_SMA, PRICE_CLOSE);
And barsTotal by using the iBars function to return the number of bars, its parameters are:
- symbol: to specify the symbol, we will use (_Symbol) to be applied for the current symbol
- timeframe: to specify the time frame, we will use the created user input time frame with the default value of 1 hour and the user can adjust it
barsTotal=iBars(_Symbol,timeFrame);
In the OnTick() part, we will create two arrays one for prices by using MqlRates to store information on prices, volumes, and spread and the other one for the simple moving average:
   MqlRates priceArray[];
   double mySMAArray[];
Setting the AS_SERIES flag to these two created arrays by using the ArraySetAsSeries function, its parameters are:
- array[]: to specify the array by reference
- flag: to specify the array indexing direction
   ArraySetAsSeries(priceArray,true);
   ArraySetAsSeries(mySMAArray,true);
Defining Ask and Bid prices after creating two double variables of them
   double Ask = NormalizeDouble(SymbolInfoDouble(_Symbol,SYMBOL_ASK),_Digits);
   double Bid = NormalizeDouble(SymbolInfoDouble(_Symbol,SYMBOL_BID),_Digits);
Getting historical data of MqlRates by using the CopyRates function, its parameters are:
- symbol_name: to determine the symbol name
- timeframe: to determine the time frame
- start_pos: to specify the starting position
- count: to specify the count of data to copy
- rates_array[]: to specify the target array to copy
int Data=CopyRates(_Symbol,_Period,0,3,priceArray);
Getting data of the indicator buffer by using the CopyBuffer function, its parameters are:
- indicator_handle: to specify the indicator handle which is simpleMA here
- buffer_num: to specify the buffer number of the indicator which is 0
- start_pos: to determine the starting position which is 0 that is the current candle
- count: to specify the amount that we need to copy which is 3
- buffer[]: to specify the target array that we need to copy which is mySMAArray
CopyBuffer(simpleMA,0,0,3,mySMAArray);
Defining the last closing price and the simple moving average value of the same candle after creating two double variables of these two values
   double lastClose=(priceArray[1].close);
   double SMAVal = NormalizeDouble(mySMAArray[1],_Digits);
Defining the previous closing price and the simple moving average value of this same candle after creating other two double variables of these two values
   double prevClose=(priceArray[2].close);
   double prevSMAVal = NormalizeDouble(mySMAArray[2],_Digits);
Creating an integer bars variable to be compared with barsTotal created variable
int bars=iBars(_Symbol,timeFrame);
Checking if there is a new bar created by checking the barsTotal if it is not equal to bars
if(barsTotal != bars) If the barsTotal is not equal to bars, we need to update the barsTotal with the bars value
barsTotal=bars;
If barsTotal is not equal to bars, we need also to check our conditions of the strategy if the previous of the last close is below the value of the simple moving average of the same candle and at the same time the last closing price is above the simple moving average value of the same candle. We need the program to close the current opened position and open a buy position
      if(prevClose<prevSMAVal && lastClose>SMAVal)
        {
         trade.PositionClose(_Symbol);
         trade.Buy(lotSize,_Symbol,Ask,0,0,NULL);
        }
If the previous of the last close is above the value of the simple moving average of the same candle and at the same time the last closing price is below the simple moving average value of the same candle. We need the program to close the current opened position and open a sell position
      if(prevClose>prevSMAVal && lastClose<SMAVal)
        {
         trade.PositionClose(_Symbol);
         trade.Sell(lotSize,_Symbol,Bid,0,0,NULL);
        }
Then we will compile the code and we will find it compiled without any errors or warnings.
The following is for full code in one block of code:
//+------------------------------------------------------------------+
//|                                                   SMA_System.mq5 |
//+------------------------------------------------------------------+
#include <Trade\Trade.mqh>
input double lotSize = 1;
input ENUM_TIMEFRAMES timeFrame = PERIOD_H1;
input int MAPeriod= 50;
int simpleMA;
int barsTotal;
CTrade trade;
//+------------------------------------------------------------------+
//| Expert initialization function                                   |
//+------------------------------------------------------------------+
int OnInit()
  {
   simpleMA = iMA(_Symbol, timeFrame, MAPeriod, 0, MODE_SMA, PRICE_CLOSE);
   barsTotal=iBars(_Symbol,timeFrame);
   return(INIT_SUCCEEDED);
  }
//+------------------------------------------------------------------+
//| Expert tick function                                             |
//+------------------------------------------------------------------+
void OnTick()
  {
   MqlRates priceArray[];
   double mySMAArray[];
   double Ask = NormalizeDouble(SymbolInfoDouble(_Symbol,SYMBOL_ASK),_Digits);
   double Bid = NormalizeDouble(SymbolInfoDouble(_Symbol,SYMBOL_BID),_Digits);
   ArraySetAsSeries(priceArray,true);
   ArraySetAsSeries(mySMAArray,true);
   int Data=CopyRates(_Symbol,_Period,0,3,priceArray);
   CopyBuffer(simpleMA,0,0,3,mySMAArray);
   double lastClose=(priceArray[1].close);
   double SMAVal = NormalizeDouble(mySMAArray[1],_Digits);
   double prevClose=(priceArray[2].close);
   double prevSMAVal = NormalizeDouble(mySMAArray[2],_Digits);
   int bars=iBars(_Symbol,timeFrame);
   if(barsTotal != bars)
     {
      barsTotal=bars;
      if(prevClose<prevSMAVal && lastClose>SMAVal)
        {
         trade.PositionClose(_Symbol);
         trade.Buy(lotSize,_Symbol,Ask,0,0,NULL);
        }
      if(prevClose>prevSMAVal && lastClose<SMAVal)
        {
         trade.PositionClose(_Symbol);
         trade.Sell(lotSize,_Symbol,Bid,0,0,NULL);
        }
     }
  }
//+------------------------------------------------------------------+
We compile the EA and run it EA on the EURUSD data to backtest the strategy. The testing period is from 1st of Jan to 30th of June 2022 the same we did in the all mentioned Moving average types. Our settings for the SMA will be as follows:
- Lot size: 1
- Time frame: 1 hour
- MA period: 50
The results of the test:
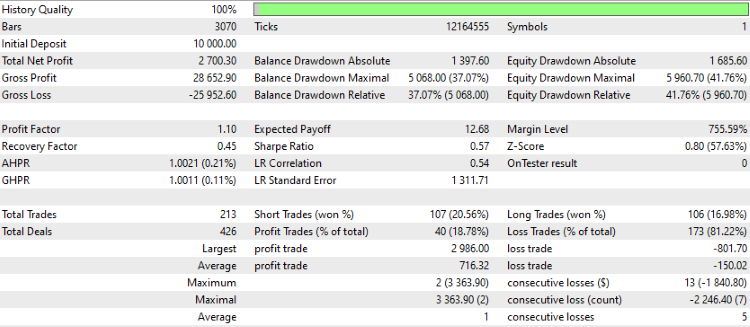
As we can see the following figures that we need to study after testing the SMA indicator:
- Net Profit: 2700.30 (27%)
- Balance DD relative: 37.07%
- Equity DD relative: 41.76%
- Profit factor: 1.10
- Expected payoff: 12.68
- Recovery factor: 0.45
- Sharpe Ratio: 0.57
Adaptive Moving Average (iAMA)
In this part, we will learn about another type of moving average which is the AMA (Adaptive Moving Average). It is developed by Perry J. Kaufman, and it is called (KAMA) also and the main concept is to reduce the noise in the price movement. It follows the price movement whatever the volatility of this price movement as it adjusts to it. The indicator is a trend-follower indicator, so, it can be used to identify the trend and the turning points.
The indicator is calculated in a few steps.
Step one: Calculating AMA or KAMA

Step two: Calculating the smoothing constant (SC)

Step three: Calculation of the Efficiency Ratio (ER)

Now, we learned how to calculate the AMA indicator manually but we do not need that as we can insert it automatically in the MetaTrader 5 by choosing it from available ready-made indicators. It is time to create a trading system that can execute buying and selling orders based on the crossover between the closing price and the AMA indicator. So, we will use the following signals for our strategy.
Buy signal:
The closing price is above the adaptive moving average value
And, The previous closing price was below the previous adaptive moving average value
Sell signal:
The closing price is below the adaptive moving average value
And, The previous closing price was above the previous adaptive moving average value
The following is the full code for creating this type of trading system:
//+------------------------------------------------------------------+
//|                                                  iAMA_System.mq5 |
//+------------------------------------------------------------------+
#include <Trade\Trade.mqh>
input double lotSize = 1;
input ENUM_TIMEFRAMES timeFrame = PERIOD_H1;
input int MAPeriod= 50;
input int fastMAPeriod= 5;
input int slowMAPeriod= 100;
int adaptiveMA;
int barsTotal;
CTrade trade;
//+------------------------------------------------------------------+
//| Expert initialization function                                   |
//+------------------------------------------------------------------+
int OnInit()
  {
   adaptiveMA = iAMA(_Symbol, timeFrame, MAPeriod,fastMAPeriod,slowMAPeriod, 0, PRICE_CLOSE);
   barsTotal=iBars(_Symbol,timeFrame);
   return(INIT_SUCCEEDED);
  }
//+------------------------------------------------------------------+
//| Expert tick function                                             |
//+------------------------------------------------------------------+
void OnTick()
  {
   MqlRates priceArray[];
   double myAMAArray[];
   double Ask = NormalizeDouble(SymbolInfoDouble(_Symbol,SYMBOL_ASK),_Digits);
   double Bid = NormalizeDouble(SymbolInfoDouble(_Symbol,SYMBOL_BID),_Digits);
   ArraySetAsSeries(priceArray,true);
   ArraySetAsSeries(myAMAArray,true);
   int Data=CopyRates(_Symbol,timeFrame,0,3,priceArray);
   CopyBuffer(adaptiveMA,0,0,3,myAMAArray);
   double lastClose=(priceArray[1].close);
   double AMAVal = NormalizeDouble(myAMAArray[1],_Digits);
   double prevClose=(priceArray[2].close);
   double prevAMAVal = NormalizeDouble(myAMAArray[2],_Digits);
   int bars=iBars(_Symbol,timeFrame);
   if(barsTotal != bars)
     {
      barsTotal=bars;
      if(lastClose>AMAVal && prevClose<prevAMAVal)
        {
         trade.PositionClose(_Symbol);
         trade.Buy(lotSize,_Symbol,Ask,0,0,NULL);
        }
      if(lastClose<AMAVal && prevClose>prevAMAVal)
        {
         trade.PositionClose(_Symbol);
         trade.Sell(lotSize,_Symbol,Bid,0,0,NULL);
        }
     }
  }
//+------------------------------------------------------------------+
The difference in this code is using the iAMA function that returns the handle of the adaptive moving average indicator and its parameters are:
- symbol: to specify the symbol name, we will use _Symbol for the current symbol
- period: to specify the time frame we will use the user input with a default value of 1 hour
- ama_period: to specify the period of the adaptive moving average
- fast_ma_period: to specify the period of fast MA
- slow_ma_period: to specify the period of slow MA
- ama_shift: to specify the horizontal shift, we will use 0
- applied_price: to specify the price type, we will use the closing price
We need to backtest the AMA indicator for the same period to see its results:
- Lot size =1
- Time frame = 1 hour
- MAperiod = 50
- Fast MA = 5
- Slow MA = 100
The results:
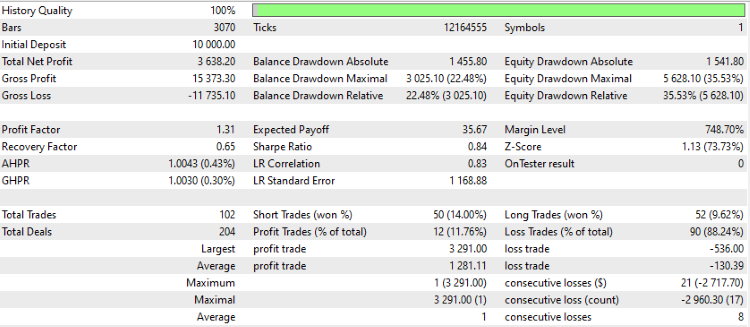
As we can see the following figures that we need to study after testing AMA indicator:
- Net Profit: 3638.20 (36.39%)
- Balance DD relative: 22.48%
- Equity DD relative: 35.53%
- Profit factor: 1.31
- Expected payoff: 35.67
- Recovery factor: 0.65
- Sharpe Ratio: 0.86
Double Exponential Moving Average (iDEMA)
In this part, we will identify another moving average type which is the Double Exponential Moving Average (DEMA) technical indicator. It is a trend-follower indicator that was developed by Patrick Mulloy. The main objective of this indicator is to reduce the lag of the EMAs but make it more responsive to the market movement as we will see in the calculation of this indicator.
This indicator can be used to identify the trend or turning points in the trend by detecting the position of prices relative to this moving average. The indicator calculation steps are shown below:
1. Calculation of the first Exponential Moving Average (EMA)
EMA one = EMA of n period of price
2. Calculating the EMA of EMA one
EMA two = EMA of EMA one
3. Calculating the DEMA
DEMA = (2 * EMA one) - EMA two
As we know we do not need to do this manual calculation, it is for understanding well the indicator but we have this indicator the same as a lot of technical indicators in the MetaTrader 5. Now, we need to create the same trading system that we created before but we will use the DEMA this time to test its results compared to other types. This trading system will be executed the same mentioned orders which are buying and selling based on the crossover also but this time will be the crossover between the price and the DEMA indicator. Signals will be:
Buy signal:
The closing price is above the double exponential moving average (DEMA)value
And, The previous closing price was below the previous DEMA value
Sell signal:
The closing price is below the DEMA value
And, The previous closing price was above the previous DEMA value
The following is the full code of this trading system with the little difference of using the iDEMA function to return the handle of the double exponential moving average indicator and its parameters are:
- symbol: to specify the symbol name, we will use (_Symbol) for the current symbol
- period: to specify the time frame we will use the user input with a default time frame of 1 hour
- ma_period: to specify the moving average period, we will use the user input with a default value of 50
- ma_shift: to specify the horizontal shift, we will use 0 as we do not need a shift on the chart
- applied_price: to specify the price type, we will use the closing price to calculate the moving average
It will be the same as below one block of code:
//+------------------------------------------------------------------+
//|                                                 iDEMA_System.mq5 |
//+------------------------------------------------------------------+
#include <Trade\Trade.mqh>
input double lotSize = 1;
input ENUM_TIMEFRAMES timeFrame = PERIOD_H1;
input int MAPeriod= 50;
int DEMA;
int barsTotal;
CTrade trade;
//+------------------------------------------------------------------+
//| Expert initialization function                                   |
//+------------------------------------------------------------------+
int OnInit()
  {
   DEMA = iDEMA(_Symbol, timeFrame, MAPeriod,0, PRICE_CLOSE);
   barsTotal=iBars(_Symbol,timeFrame);
   return(INIT_SUCCEEDED);
  }
//+------------------------------------------------------------------+
//| Expert tick function                                             |
//+------------------------------------------------------------------+
void OnTick()
  {
   MqlRates priceArray[];
   double myDEMAArray[];
   double Ask = NormalizeDouble(SymbolInfoDouble(_Symbol,SYMBOL_ASK),_Digits);
   double Bid = NormalizeDouble(SymbolInfoDouble(_Symbol,SYMBOL_BID),_Digits);
   ArraySetAsSeries(priceArray,true);
   ArraySetAsSeries(myDEMAArray,true);
   int Data=CopyRates(_Symbol,timeFrame,0,3,priceArray);
   CopyBuffer(DEMA,0,0,3,myDEMAArray);
   double lastClose=(priceArray[1].close);
   double DEMAVal = NormalizeDouble(myDEMAArray[1],_Digits);
   double prevClose=(priceArray[2].close);
   double prevDEMAVal = NormalizeDouble(myDEMAArray[2],_Digits);
   int bars=iBars(_Symbol,timeFrame);
   if(barsTotal != bars)
     {
      barsTotal=bars;
      if(lastClose>DEMAVal && prevClose<prevDEMAVal)
        {
         trade.PositionClose(_Symbol);
         trade.Buy(lotSize,_Symbol,Ask,0,0,NULL);
        }
      if(lastClose<DEMAVal && prevClose>prevDEMAVal)
        {
         trade.PositionClose(_Symbol);
         trade.Sell(lotSize,_Symbol,Bid,0,0,NULL);
        }
     }
  }
//+------------------------------------------------------------------+
After compiling this code, we can backtest the same period that we used for other previous types, and the setting or inputs of this indicator will be the following:
- Lot size = 1
- Time frame = 1 hour
- MA period = 50
After running the test, we get the following results:
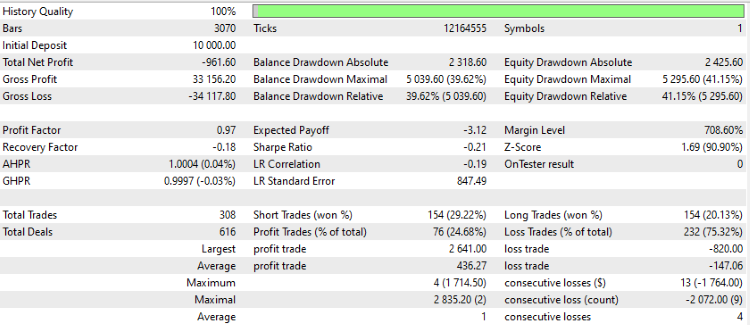
As we can see the following figures that we need to study after testing iDEMA:
- Net Profit: - 961.60 (- 9.62%)
- Balance DD relative: 39.62%
- Equity DD relative: 41.15%
- Profit factor: 0.97
- Expected payoff: - 3.12
- Recovery factor: - 0.18
- Sharpe Ratio: - 0.21
Triple Exponential Moving Average (iTEMA)
Now, we will identify another moving average type which is the Triple Exponential Moving Average (TEMA), it was developed by Patrick Mulloy to add more responsiveness to the indicator to be suitable for short-term trading. In this indicator, we use triple-smoothed EMAs, single, and double-smoothed EMAs. So, this indicator will be closer to the price to be more responsive the same as we mentioned. The same as we used the double exponential moving average we can the TEMA the same way in addition to its quicker response to the price so, it can be used to identify the trend and turning points or changes in the trend.
The following are steps to calculate this TEMA indicator:
1. Calculation the first Exponential Moving Average (EMA)
EMA one = EMA of n period of price
2. Calculating EMA of EMA one
EMA two = EMA of EMA one
3. Calculating EMA of EMA two
EMA three = EMA of EMA two
4. Calculating the TEMA
DEMA = (3 * EMA one) - (3 * EMA two) + (EMA3)
We can insert this indicator from the available ready-made technical indicators in the MetaTrader 5 without manual calculation then we need to create our trading system using this TEMA indicator to test it and compare its results with other types. So, the following is the full code to create this trading system the same as we did before with the difference of using the iTEMA function to return the handle of the Triple Exponential Moving Average indicator and its parameters are the same as what we mentioned in the DEMA and SMA.
//+------------------------------------------------------------------+
//|                                                 iTEMA_System.mq5 |
//+------------------------------------------------------------------+
#include <Trade\Trade.mqh>
input double lotSize = 1;
input ENUM_TIMEFRAMES timeFrame = PERIOD_H1;
input int MAPeriod= 50;
int TEMA;
int barsTotal;
CTrade trade;
//+------------------------------------------------------------------+
//| Expert initialization function                                   |
//+------------------------------------------------------------------+
int OnInit()
  {
   TEMA = iTEMA(_Symbol, timeFrame, MAPeriod,0, PRICE_CLOSE);
   barsTotal=iBars(_Symbol,timeFrame);
   return(INIT_SUCCEEDED);
  }
//+------------------------------------------------------------------+
//| Expert tick function                                             |
//+------------------------------------------------------------------+
void OnTick()
  {
   MqlRates priceArray[];
   double myTEMAArray[];
   double Ask = NormalizeDouble(SymbolInfoDouble(_Symbol,SYMBOL_ASK),_Digits);
   double Bid = NormalizeDouble(SymbolInfoDouble(_Symbol,SYMBOL_BID),_Digits);
   ArraySetAsSeries(priceArray,true);
   ArraySetAsSeries(myTEMAArray,true);
   int Data=CopyRates(_Symbol,timeFrame,0,3,priceArray);
   CopyBuffer(TEMA,0,0,3,myTEMAArray);
   double lastClose=(priceArray[1].close);
   double TEMAVal = NormalizeDouble(myTEMAArray[1],_Digits);
   double prevClose=(priceArray[2].close);
   double prevTEMAVal = NormalizeDouble(myTEMAArray[2],_Digits);
   int bars=iBars(_Symbol,timeFrame);
   if(barsTotal != bars)
     {
      barsTotal=bars;
      if(lastClose>TEMAVal && prevClose<prevTEMAVal)
        {
         trade.PositionClose(_Symbol);
         trade.Buy(lotSize,_Symbol,Ask,0,0,NULL);
        }
      if(lastClose<TEMAVal && prevClose>prevTEMAVal)
        {
         trade.PositionClose(_Symbol);
         trade.Sell(lotSize,_Symbol,Bid,0,0,NULL);
        }
     }
  }
//+------------------------------------------------------------------+
After compiling and executing this software we can backtest the same period to compare its results to other moving average types and the following are settings or inputs that will be used to try to let all parameters be fixed in this testing process:
- Lot size = 1
- Time frame = 1 hour
- MA period = 50
After running and completing this testing we can find results the same as the following:
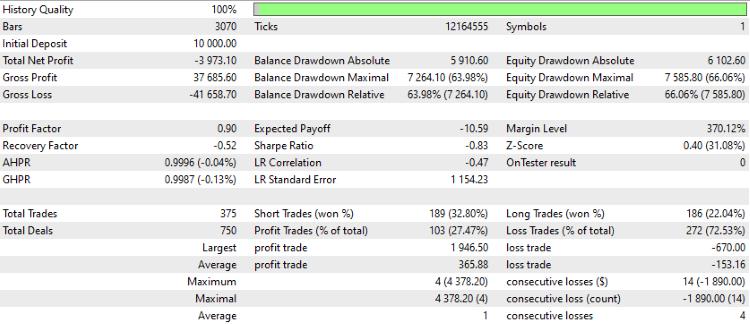
As we can see the following figures that we need to study:
- Net Profit: - 3973.10 (- 39.74%)
- Balance DD relative: 63.98%
- Equity DD relative: 66.06%
- Profit factor: 0.90
- Expected payoff: - 10.59
- Recovery factor: - 0.52
- Sharpe Ratio: - 0.83
Fractal Adaptive Moving Average (iFrAMA)
We have the last type of moving average that we need to identify in this article. It is the Fractal Adaptive Moving Average (FrAMA) indicator, which was developed by John Ehlers. It is a trend-following indicator and supposed that market prices are fractal. It can be used to detect trends and turning points also. The following are steps about how we can calculate it:
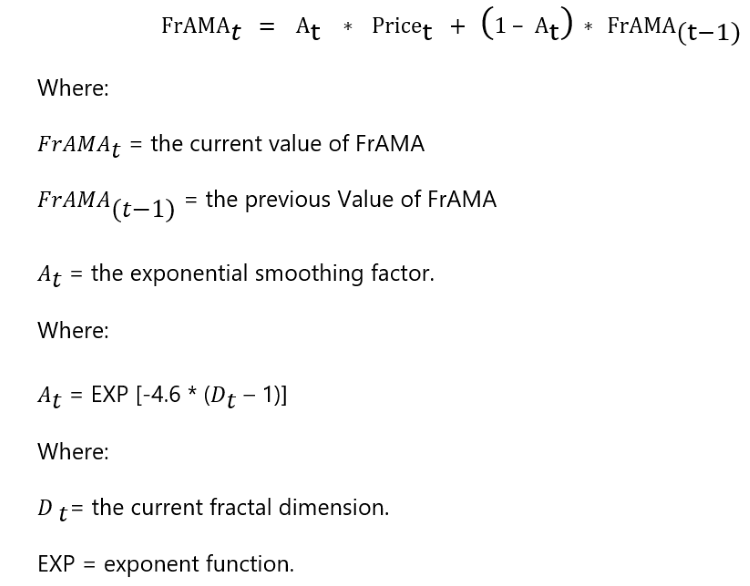
We can insert this indicator from the available ready-made technical indicator in the MetaTrader 5, Now we need to create the same trading system with the same strategy but we will use the FrAMA indicator instead here to compare its results after testing with other types as well. The strategy is the crossover between the price and the FrAMA indicator when the price crosses above the FrAMA it will be a buy signal and when the price crosses below the FrAMA it will be a sell signal.
Buy signal:
The closing price is above the fractal adaptive moving average (FrAMA)value
And, The previous closing price was below the previous FrAMA value
Sell signal:
The closing price is below the FrAMA value
And, The previous closing price was above the previous FrAMA value
The following is the full code to create this trading system it will be the same as what we mentioned before in other types but we will use the (iFrAMA) function to return the handle of the fractal adaptive moving average and its parameters are:
- symbol: to specify the symbol name, we will use _Symbol for the current symbol
- period: to specify the time frame we will use the user input with a default value of 1 hour
- ma_period: to specify the moving average period, we will use the user input with a default value of 50
- ma_shift: to specify the horizontal shift, we will use 0
- applied_price: to specify the price type, we will use closing price
//+------------------------------------------------------------------+
//|                                                iFrAMA_System.mq5 |
//+------------------------------------------------------------------+
#include <Trade\Trade.mqh>
input double lotSize = 1;
input ENUM_TIMEFRAMES timeFrame = PERIOD_H1;
input int MAPeriod= 50;
int FrAMA;
int barsTotal;
CTrade trade;
//+------------------------------------------------------------------+
//| Expert initialization function                                   |
//+------------------------------------------------------------------+
int OnInit()
  {
   FrAMA = iFrAMA(_Symbol, timeFrame, MAPeriod,0, PRICE_CLOSE);
   barsTotal=iBars(_Symbol,timeFrame);
   return(INIT_SUCCEEDED);
  }
//+------------------------------------------------------------------+
//| Expert tick function                                             |
//+------------------------------------------------------------------+
void OnTick()
  {
   MqlRates priceArray[];
   double myFrAMAArray[];
   double Ask = NormalizeDouble(SymbolInfoDouble(_Symbol,SYMBOL_ASK),_Digits);
   double Bid = NormalizeDouble(SymbolInfoDouble(_Symbol,SYMBOL_BID),_Digits);
   ArraySetAsSeries(priceArray,true);
   ArraySetAsSeries(myFrAMAArray,true);
   int Data=CopyRates(_Symbol,timeFrame,0,3,priceArray);
   CopyBuffer(FrAMA,0,0,3,myFrAMAArray);
   double lastClose=(priceArray[1].close);
   double FrAMAVal = NormalizeDouble(myFrAMAArray[1],_Digits);
   double prevClose=(priceArray[2].close);
   double prevFrAMAVal = NormalizeDouble(myFrAMAArray[2],_Digits);
   int bars=iBars(_Symbol,timeFrame);
   if(barsTotal != bars)
     {
      barsTotal=bars;
      if(lastClose>FrAMAVal && prevClose<prevFrAMAVal)
        {
         trade.PositionClose(_Symbol);
         trade.Buy(lotSize,_Symbol,Ask,0,0,NULL);
        }
      if(lastClose<FrAMAVal && prevClose>prevFrAMAVal)
        {
         trade.PositionClose(_Symbol);
         trade.Sell(lotSize,_Symbol,Bid,0,0,NULL);
        }
     }
  }
//+------------------------------------------------------------------+
After compiling and executing this EA to test this strategy using the FrAMA indicator with the following same settings or inputs:
- Lot size: 1
- Time frame: 1 hour
- MA period: 50
We test this EA at the same period as all other mentioned moving averages, and get the following results:
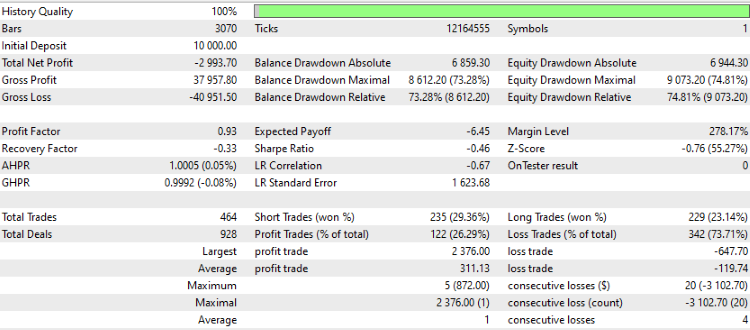
As we can see the most important figures that we need to study are the same as the following:
- Net Profit: - 2993.70 (- 29.94%)
- Balance DD relative: 73.28%
- Equity DD relative: 74.81%
- Profit factor: 0.93
- Expected payoff: - 6.45
- Recovery factor: - 0.33
- Sharpe Ratio: - 0.46
Comparing Results with Simple Moving Average (SMA) Results
In this part, I will provide a comparison of results of every mentioned moving average type and you need to know that I will try to provide the best results as much as possible but every moving average can give different results if we optimize it and change periods or tested periods as we know that moving average can give different results based on settings of the indicator and the market conditions.
The main objective here is to provide the same conditions as much as possible to see if there is a type better than others with the best settings that we can choose from our point of view. But for your understanding about what we looking for we need to see the most important measures in its highest performance:
- Net Profit: The highest value is the best
- Drawdown (DD): The lowest is the best
- Profit Factor: The highest is the best
- Expected Payoff: The highest value is the best
- Recovery Factor: The highest one is the best
- Sharpe Ratio: The highest Sharpe Ratio is the best
Now, we will compare the previous simple moving average results with other moving average types based on this previous context through the following table:
| Measurement | SMA | AMA | DEMA | TEMA | FrAMA |
|---|---|---|---|---|---|
| Net Profit | 2700.30 (27%) | 3638.20 (36.39%) | - 961.60 (- 9.62%) | - 3973.10 (- 39.74%) | - 2993.70 (- 29.94%) |
| Balance Drawdown Relative | 37.07% | 22.48% | 39.62% | 63.98% | 73.28% |
| Equity Drawdown Relative | 41.76% | 35.53% | 41.15% | 66.06% | 74.81% |
| Profit Factor | 1.10 | 1.31 | 0.97 | 0.90 | 0.93 |
| Expected Payoff | 12.68 | 35.67 | - 3.12 | - 10.59 | - 6.45 |
| Recovery Factor | 0.45 | 0.65 | - 0.18 | - 0.52 | - 0.33 |
| Sharpe Ratio | 0.57 | 0.86 | - 0.21 | - 0.83 | - 0.46 |
According to the results of all our tests, we have two types that have the best performance based on the settings and tested period. These are the simple moving average and the adaptive moving average. The best one is the adaptive moving average. It has:
- The highest net profit
- The lowest balance DD Relative
- The lowest equity DD Relative
- The best Profit Factor
- The highest Expected Payoff
- The higher Recovery Factor
- The higher Sharpe Ratio
As we mentioned before that we may find better results with more optimization for settings and strategies but the objective here is that we need to understand and apply the testing process on a real example and then we can use the same process for any testing purposes.
Conclusion
In this article, we have considered the performance results of the following moving average types:
- The Adaptive Moving Average (AMA)
- The Double Exponential Moving Average (DEMA)
- The Triple Exponential Moving Average (TEMA)
- The Fractal Adaptive Moving Average (FrAMA)
We created trading systems for every type and compare their results with the simple moving average which is the most popular moving average type. According to the testing results, we found out that the best results were generated by the simple moving average and the adaptive moving average, the top one being the adaptive one (AMA). We analyzed and compared the following metrics to identify the winner:
- Net Profit
- Drawdown (DD)
- Profit Factor
- Expected Payoff
- Recovery Factor
- Sharpe Ratio
Testing is a very important topic in trading. So, I encourage you to do more testing on more strategies. In addition to evaluating the strategy itself, it can get you some unexpected insights as every testing deepens your understanding.
Thank you for the time that you spent reading this article. I hope that you found this article useful for you and that it added value to your knowledge. If you want to read more articles about creating trading systems based on the popular technical indicator like RSI, MACD, Stochastic, Bollinger Bands, and other topics, you can check my article through the Publications, I hope you will find them useful as well.
Warning: All rights to these materials are reserved by MetaQuotes Ltd. Copying or reprinting of these materials in whole or in part is prohibited.
This article was written by a user of the site and reflects their personal views. MetaQuotes Ltd is not responsible for the accuracy of the information presented, nor for any consequences resulting from the use of the solutions, strategies or recommendations described.
- Free trading apps
- Over 8,000 signals for copying
- Economic news for exploring financial markets
You agree to website policy and terms of use