
Learn how to design a trading system by Bill Williams' MFI
Introduction
Here is a new article from our series about learning how to design a trading system based on the most popular technical indicators. We will present in this article a new technical tool that can be a useful addition to your trading, especially if you use it accompanied with other technical tools to get better insights. We will get acquainted with Bill Williams' Market Facilitation Index (BW MFI). This indicator will be covered through the following topics:
We will use the MetaTrader 5 trading platform to test the strategies of this article and we will use MQL5 (MetaQuotes Language) IDE to build our trading systems for the article also. If you do not know how to download and use them, you can read the topic of Writing MQL5 code in MetaEditor from my previous article for more details.
All mentioned strategies in this article are only for educational purposes and you must test them before using them in your real account. They certainly need some optimization. Some of the strategies may nor suit your trading style at all as there is nothing suitable for all people. Also, it will be very useful for you as a coder to try applying what you read by yourself because it will help you improve your programming skills.
Disclaimer: All information provided 'as is' only for educational purposes and is not prepared for trading purposes or advice. The information does not guarantee any kind of result. If you choose to use these materials on any of your trading accounts, you will do that at your own risk and you will be the only responsible.
BW MFI definition
In this topic, we will learn about the Market Facilitation Index (MFI) indicator in detail. It is one of the technical indicators which was developed by the well-known trader and author Bill Williams. This indicator aims to measure the direction of the market by studying and analyzing the price and the volume as well. This will help us as traders as it can be helpful to detect the future movement of the market and will give insights about the strength of the current price movement: if it will continue or it may reverse. This can be very useful to us as it helps to trade with the strongest party in the market and take the right decision.
To be able to understand the situation, we can analyze the MFI and the volume. The cases can be as follow:
- If the BW MFI and volume increase, it indicates as the market participants are interested in this financial instrument.
- If the BW MFI and the volume decrease, it indicates as the market participants are not interested in this financial instrument.
- If the BW MFI increases but the volume decreases, it indicates as the current movement is not supported by the volume.
- If the BW MFI decreases but the volume increases, it indicates as there is a balance in the market between buyers and sellers.
Now let us see how we can calculate the BW MFI manually. This will help understand the main idea or concept behind it only, as we do not need to do that nowadays since we can simply use the built-in indicator in the MetaTrader 5. To calculate the BW MFI we need to divide the result by the volume after subtracting high and low prices.
BW MFI = (High - Low) / Volume
Where:
High => the highest price
Low => the lowest price
Volume => the current volume
But as I mentioned above, we actually do not need to calculate it manually and all we need to do is to choose it among the available indicators in the MetaTrader 5. Below I show how to do that.
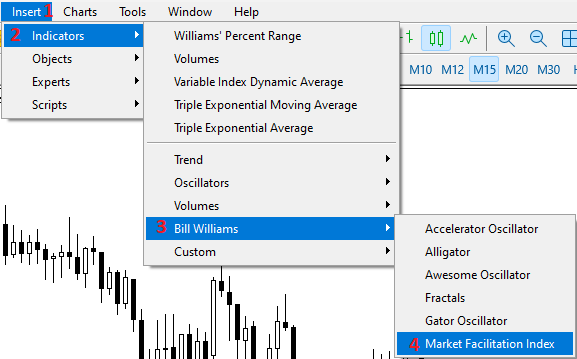
Open the MetaTrader 5 terminal, select the Insert menu -> Indicators -> Bill Williams -> Market Facilitation Index. It is shown in the following picture:
After that we can find the window of the indicator's parameters the same as the following:
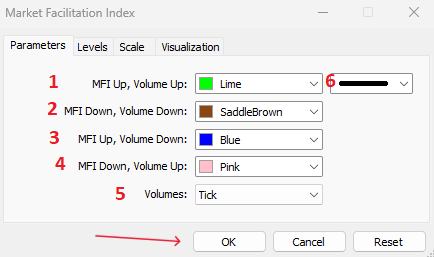
1 — the color to indicate the case of MFI and the volume increase.
2 — the color to indicate the case when the MFI and the volume decrease.
3 — the color to indicate the case when the MFI increases and the volume decreases.
4 — the color to indicate the case when the MFI decreases and the volume increases.
5 — the volume type (Tick or Real).
6 — the thickness of the bars of the indicator.
After determining the above parameters and pressing OK, you will find the indicator attached to the chart the same as in the following example:
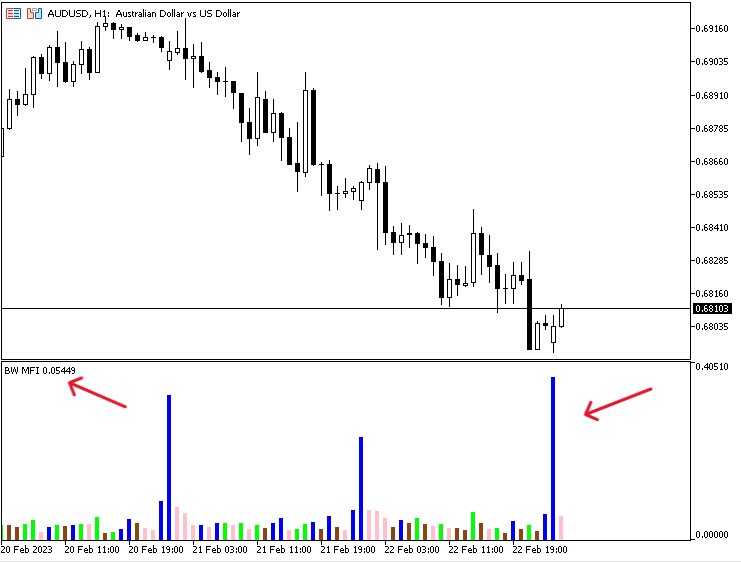
As you can in the previous picture, the indicator appears in the sub-window of the chart. It appears as bars with different values and colors based on the price and volume based on the calculation of the BW MFI indicator. Every color and value of the indicator indicates a specific state of the price movements.
- The green bar: means that the BW MFI and the volume increase indicating that the participants of the market are interested in this instrument.
- The saddle brown bar: means that the BW MFI and volume decrease indicating that there is no one interested in the instrument.
- The blue bar: means that the BW MFI increases and the volume decreases indicating that the market movement is not supported by the volume.
- The pink bar: means that the BW MFI decreases and the volume increases indicating that there is a balance between bulls and bears.
BW MFI strategy
In this topic we will share some simple strategies to be used based on the main idea of the BW MFI indicator for the purpose of education. Please do not forget that they will need optimization, modification of some parameters or combination with other technical indicators to get better results. So, it is very important to test them before using them in your real account to make sure that they are profitable and useful for your trading.
Strategy one: BW MFI - Movement Status
Based on this strategy we need to get the status of the movement of the BW MFI indicator based on the order of BW MFI values and volumes values. According to that, we will have four states:
- If the current BW MFI is greater than the previous one and the current volume is greater than the previous one. So, the bar is green and it will be a signal of a green state.
- If the current BW MFI is less than the previous one and the current volume is less than the previous one. So, the bar is brown and it will be a signal of a fade state.
- If the current BW MFI is greater than the previous one and the current volume is less than the previous one. So, the bar is blue and it will be a signal of a fake state.
- If the current BW MFI is less than the previous one and the current volume is greater than the previous one. So, the bar is pink, it will be a signal of a squat state.
Simply,
- Current BW MFI > prev. BW MFI and current vol > prev. vol ==> Green state - green bar
- Current BW MFI < prev. BW MFI and current vol < prev. vol ==> Fade state - brown bar
- Current BW MFI > prev. BW MFI and current vol < prev. vol ==> Fake state - blue bar
- Current BW MFI < prev. BW MFI and current vol > prev. vol ==> Squat state - pink bar
Strategy two: BW MFI signals
Based on this strategy we need to get a signal based on the state of the BW MFI indicator. First, we need to determine the state of the market just as we identified through the previous strategy. Then we will determine our decision based on that. According to this strategy, we will have four signals:
- If the state is green, it will be a signal to find a good entry.
- If the state is fade, it will be a signal to find a good exit.
- If the state is fake, it will be a signal to false breakout probability.
- If the state is squat, it will be a signal of the market is balanced.
Strategy three: BW MFI with MA
Based on this strategy we will use another technical indicator which is the moving average to get a buy or sell signal. If the state is green and the closing price is above the moving average, it will be a buy signal. In the other scenario, if the state is green and the closing price is below the moving average, it will be a sell signal. This way from features of technical analysis as we can combine technical tools together to get more insights and see different perspectives. You can also do that with other technical tools to get more insights, like support and resistance, MACD, Moving averages, or any other useful technical tools that can be useful in filtration of generated signals.
Simply,
- Green state and closing price > MA ==> Buy signal
- Green state and closing price < MA ==> Sell signal
BW MFI strategy blueprint
In this part, we will consider a very important step in designing our trading system which is a step-by-step blueprint for each mentioned strategy. The blueprint helps create the trading system smoothly, as it visualizes what we need to instruct the computer to do. So, we can consider this step as a planning step for our upcoming strategy.
Strategy one: BW MFI - Movement Status
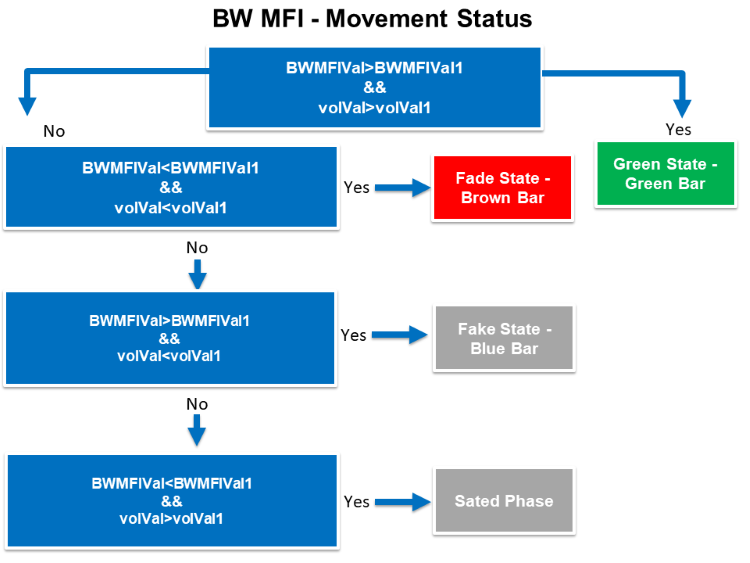
According to this strategy, we need to create a trading system that can be used to get a signal of the movement of the BW MFI indicator based on the color of the indicator's bar which will be determined as per the nature of the indicator by comparing four values every tick to determine the position of every one of them. These four values are the current BW MFI, the previous BW MFI, the current volumes, and the previous volumes. We need the program to check them and determine the position of each value. When the current value of BW MFI is greater than the previous one and at the same time the current volume is greater than the previous one, we need the trading system to return a comment on the chart with "Green State - Green Bar" and this is the first case. The second one is when the current BW MFI is less than the previous one and at the same time the value of the current volume is lower than the previous one when the trading system to return a comment on the chart with "Fade Statue - Brown Bar". The third case is when the current BW MFI value is greater than the previous one and at the same time the value of the current volume is lower than the previous one, when need the system to return a comment on the chart with "Fake State - Blue Bar". The fourth and last case is when the current BW MFI value is lower than the previous one and at the same time the value of the current volume is greater than the previous one, we need to get a comment on the chart with "Squat State - Pink Bar".
The following graph is for the movement status strategy blueprint:
Strategy two: BW MFI signals
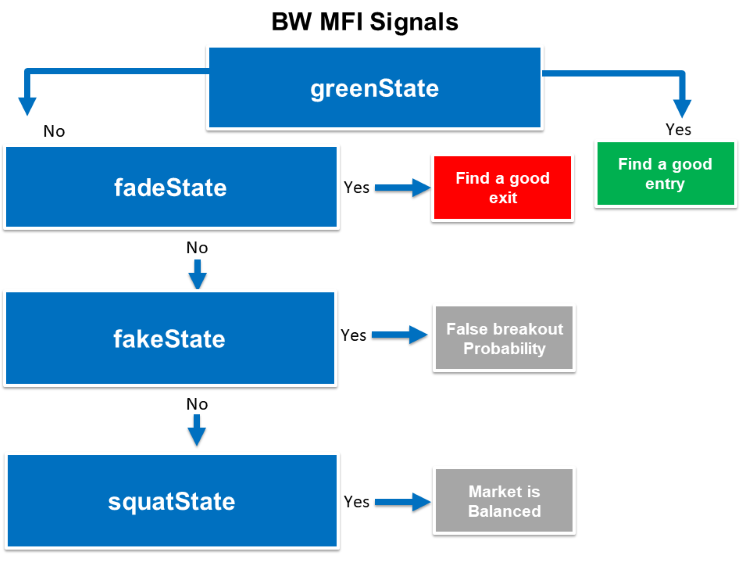
According to this strategy and after identifying every state based on the indicator bars, we need to create a trading system that can be used to return the comment on the chart with the suitable signal based on this state of the BW MFI indicator. To do that, we need to create a trading system that can check four states for every tick and return a suitable signal based on it. If the state of the BW MFI is a green state that is identified in the trading system, we need to get a signal as a comment on the chart with "Find a good entry". The second state when checking the state of the indicator and finding that it is a fade state, we need the trading system to return a signal as a comment on the chart with "Find a good exit". The third scenario or state is when checking the state of the BW MFI and finding it is a fake state, we need the trading system to return a comment on the chart as a signal with "False breakout probability". The last state is when finding after checking that it is a squat state, we need to get a comment on the chart as a signal with "Market is Balanced".
The following graph is for the signals strategy blueprint:
Strategy three: BW MFI with MA
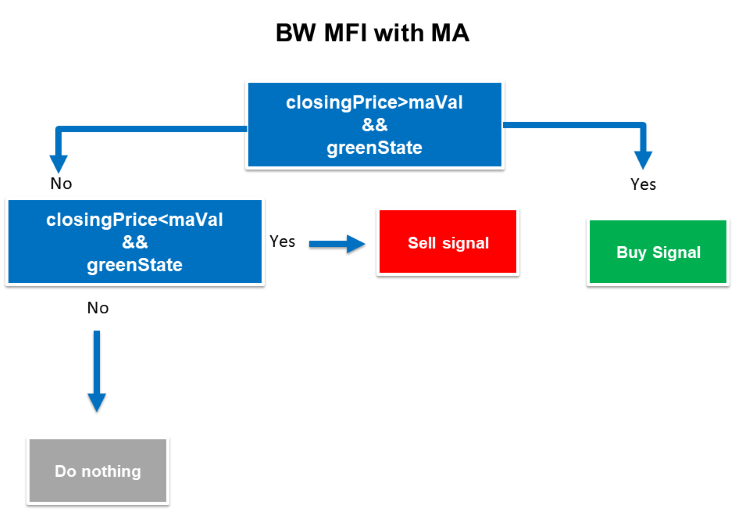
According to this strategy, we need to create a trading system that can return a buy or sell signal based on the BW MFI indicator and the simple moving average. We need the trading system to continuously check the closing price, the current simple moving average, and the state of the current BW MFI indicator after identifying its four states every tick. If the trading system found that the closing price is greater than the current value of the simple moving average and at the same time the current BW MFI state is green, we need the trading system to return a buy signal as a comment on the chart. If it finds that the closing price is less than the current simple moving average and at the same time the current BW MFI state is green , we need the trading system to return a sell signal as a comment on the chart. If there is something else we need the trading system to return nothing.
The following graph is for the BW MFI with the MA strategy blueprint:
BW MFI trading system
We will start creating our trading system for each mentioned strategy in this part of the article. We start creating a simple trading system to return a comment on the chart with the BW MFI current value to use it as a base for other strategies. The following are for steps to do that:
Create an Array of BWMFIArray by using a double function which is one of the real types to return values with fractions.
double BWMFIArray[]; Sorting data in this array by using the "ArraySetAsSeries" function. Its parameters:
- array[]: to determine the created array which is BMWFIArray.
- flag: Array indexing direction, which will be true.
ArraySetAsSeries(BWMFIArray,true);
Creating an integer variable for BWMFIDef and defining the Bill Williams Market Facilitation Index using the "iBWMFI" function. to return the indicator handle Its parameters:
- symbol: to determine the desired symbol, we'll use (_Symbol) to be applied for the current symbol.
- period: to determine the period, we'll use(_PERIOD) to be applied for the current time frame.
- applied_volume: to determine the type of volume, we'll use (VOLUME_TICK).
int BWMFIDef=iBWMFI(_Symbol,_Period,VOLUME_TICK);
Defining data and storing results by using the "CopyBuffer" function for BWMFIArray. Its parameters:
- indicator_handle: to determine the indicator handle, we will use (BWMFIDef).
- buffer_num: to determine the indicator buffer number, we will use (0).
- start_pos: to determine the start position, we will determine (0).
- count: to determine the amount to copy, we will use (3).
- buffer[]: to determine the target array to copy, we will use (BWMFIArray).
CopyBuffer(BWMFIDef,0,0,3,BWMFIArray);
Getting the current value of BWMFI after creating a double variable for BWMFIVal. Then, we will use the (NormalizeDouble) function for rounding purposes.
- value: We'll use BWMFIArray[0] for the current value.
- digits: We'll use (5) for the digits after the decimal point.
double BWMFIVal=NormalizeDouble(BWMFIArray[0],5);
Using the (Comment) function to appear the value of the current BW MFI Value.
Comment("BW MFI Value = ",BWMFIVal);
The following is the full code in one block for this trading system:
//+------------------------------------------------------------------+
//|                             Simple Market Facilitation Index.mq5 |
//|                                  Copyright 2023, MetaQuotes Ltd. |
//|                                             https://www.mql5.com |
//+------------------------------------------------------------------+
#property copyright "Copyright 2023, MetaQuotes Ltd."
#property link      "https://www.mql5.com"
#property version   "1.00"
//+------------------------------------------------------------------+
void OnTick()
  {
   double BWMFIArray[];
   ArraySetAsSeries(BWMFIArray,true);
   int BWMFIDef=iBWMFI(_Symbol,_Period,VOLUME_TICK);
   CopyBuffer(BWMFIDef,0,0,3,BWMFIArray);
   double BWMFIVal=NormalizeDouble(BWMFIArray[0],5);
   Comment("BW MFI Value = ",BWMFIVal);
  }
//+------------------------------------------------------------------+
After compiling the previous lines of code without errors we will find this expert in the navigator window under the Expert Advisors folder in the MetaTrader 5 trading terminal the same as the following:
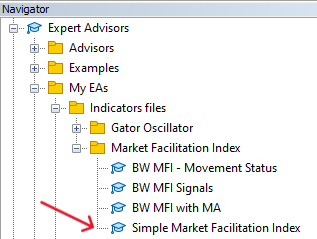
By dragging and dropping the expert of the Simple Market Facilitation Index on the desired chart, we will find the window of this EA the same as the following:
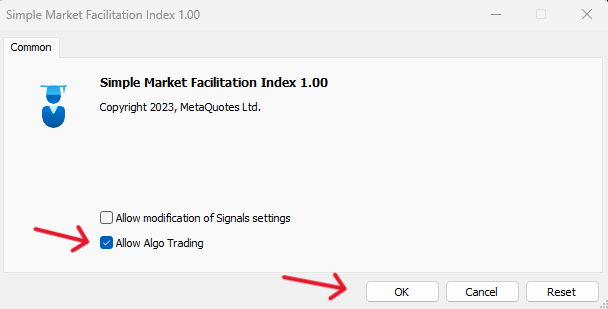
After ticking next to Allow Algo Trading and pressing OK, we can find the EA is attached the same as the following:
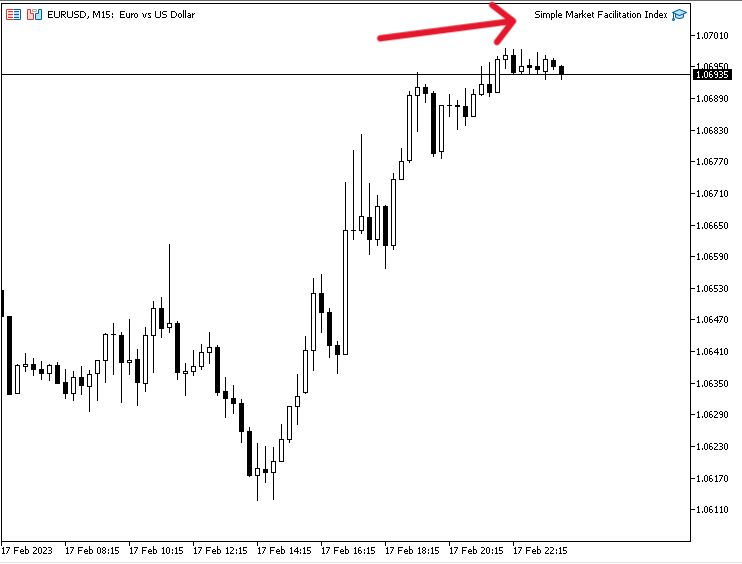
Now, we're ready to receive signals the same as the following example from testing:
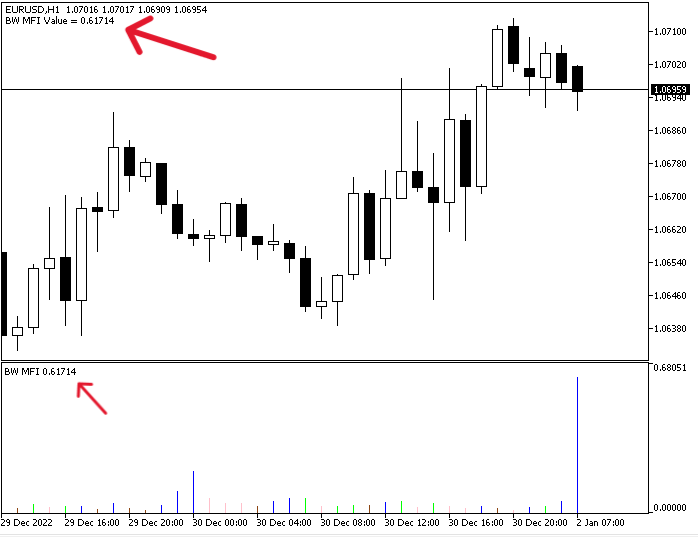
As we can see on the previous chart we have a signal based on this trading strategy that shows as a comment with the current BW MFI value in the top left corner.
Strategy one: BW MFI - Movement Status
We can find the following full code to create this type of trading system:
//+------------------------------------------------------------------+
//|                                     BW MFI - Movement Status.mq5 |
//|                                  Copyright 2023, MetaQuotes Ltd. |
//|                                             https://www.mql5.com |
//+------------------------------------------------------------------+
#property copyright "Copyright 2023, MetaQuotes Ltd."
#property link      "https://www.mql5.com"
#property version   "1.00"
//+------------------------------------------------------------------+
void OnTick()
  {
   double BWMFIArray[];
   double volArray[];
   ArraySetAsSeries(BWMFIArray,true);
   ArraySetAsSeries(volArray,true);
   int BWMFIDef=iBWMFI(_Symbol,_Period,VOLUME_TICK);
   int volDef=iVolumes(_Symbol,_Period,VOLUME_TICK);
   CopyBuffer(BWMFIDef,0,0,3,BWMFIArray);
   CopyBuffer(volDef,0,0,3,volArray);
   double BWMFIVal=NormalizeDouble(BWMFIArray[0],5);
   double BWMFIVal1=NormalizeDouble(BWMFIArray[1],5);
   double volVal=NormalizeDouble(volArray[0],5);
   double volVal1=NormalizeDouble(volArray[1],5);
   if(BWMFIVal>BWMFIVal1&&volVal>volVal1)
     {
      Comment("Green State - Green Bar");
     }
   if(BWMFIVal<BWMFIVal1&&volVal<volVal1)
     {
      Comment("Fade State - Brown Bar");
     }
   if(BWMFIVal>BWMFIVal1&&volVal<volVal1)
     {
      Comment("Fake State - Blue Bar");
     }
   if(BWMFIVal<BWMFIVal1&&volVal>volVal1)
     {
      Comment("Squat State - Pink Bar");
     }
  }
//+------------------------------------------------------------------+
Differences in this code:
Creating two arrays of (BWMFIArray) and (volArray) and sorting data in these arrays by using the "ArraySetAsSeries" function.
   double BWMFIArray[];
   double volArray[];
   ArraySetAsSeries(BWMFIArray,true);
   ArraySetAsSeries(volArray,true);
Creating integer variables for BWMFIDef and volDef. Defining the Bill Williams Market Facilitation Index using the "iBWMFI" function and Volumes using the "iVolumes" function. to return the indicator handles the parameters are the same for both:
- symbol: to determine the desired symbol, we'll use (_Symbol) to be applied for the current symbol.
- period: to determine the period, we'll use(_PERIOD) to be applied for the current time frame.
- applied_volume: to determine the type of volume, we'll use (VOLUME_TICK).
   int BWMFIDef=iBWMFI(_Symbol,_Period,VOLUME_TICK);
   int volDef=iVolumes(_Symbol,_Period,VOLUME_TICK);
Defining data and storing results by using the "CopyBuffer" function for volArray.
CopyBuffer(volDef,0,0,3,volArray);
Defining the current and the previous values of BWMFI and volumes:
   double BWMFIVal=NormalizeDouble(BWMFIArray[0],5);
   double BWMFIVal1=NormalizeDouble(BWMFIArray[1],5);
   double volVal=NormalizeDouble(volArray[0],5);
   double volVal1=NormalizeDouble(volArray[1],5);
Conditions of the strategy:
In the case of the green bar,
   if(BWMFIVal>BWMFIVal1&&volVal>volVal1)
     {
      Comment("Green State - Green Bar");
     }
In the case of the brown bar,
   if(BWMFIVal<BWMFIVal1&&volVal<volVal1)
     {
      Comment("Fade State - Brown Bar");
     }
In the case of the blue bar,
   if(BWMFIVal>BWMFIVal1&&volVal<volVal1)
     {
      Comment("Fake State - Blue Bar");
     }
In the case of the pink bar,
   if(BWMFIVal<BWMFIVal1&&volVal>volVal1)
     {
      Comment("Squat State - Pink Bar");
     }
After compiling the previous code without any errors and executing it, we'll find it is attached to the chart the same as the following:
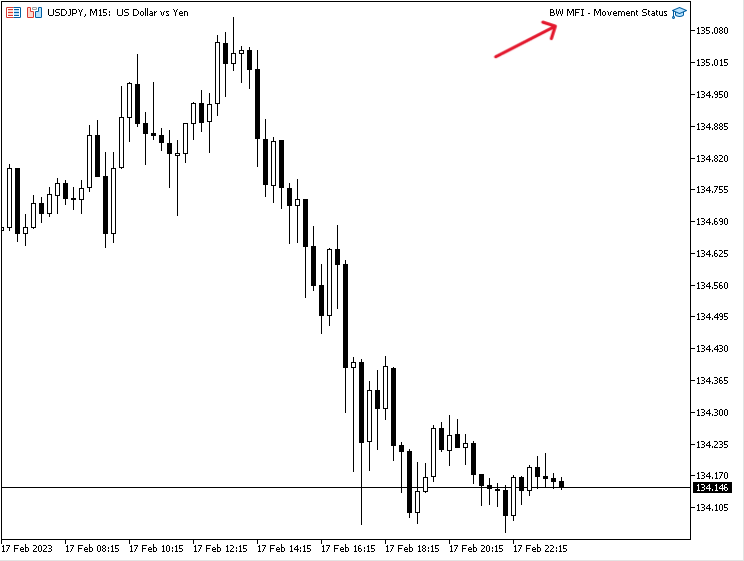
As we can see we have the EA is attached in the top right corner of the previous figure. We're ready to receive signals of this trading system the same as the following examples from testing:
In the case of the green state signal,
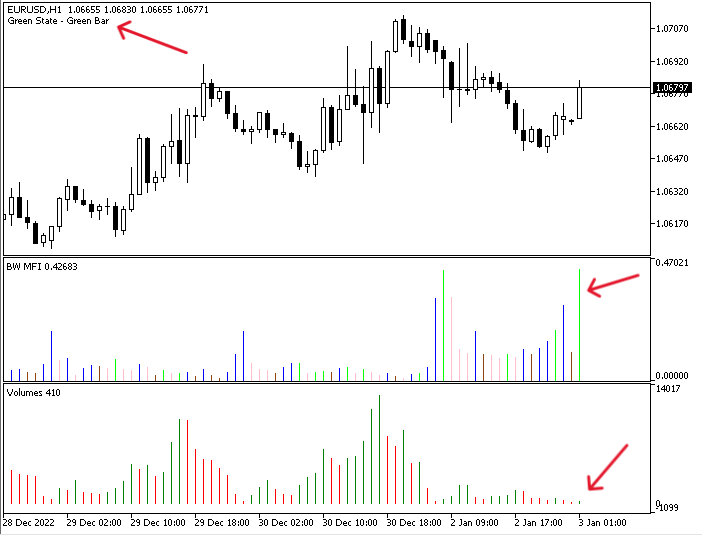
As we can see in the previous figure we have the signal of a green state in the top left corner.
In the case of the fade state:
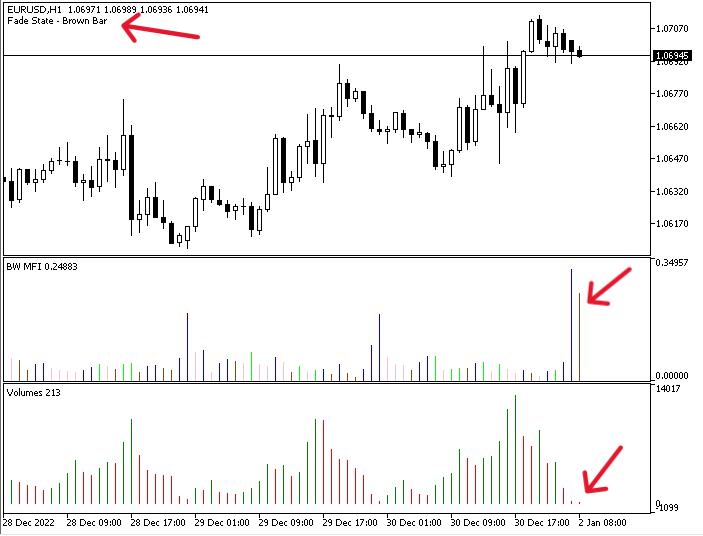
We have the signal of a fade based on this strategy as a comment in the top left corner.
In the case of the fake state:
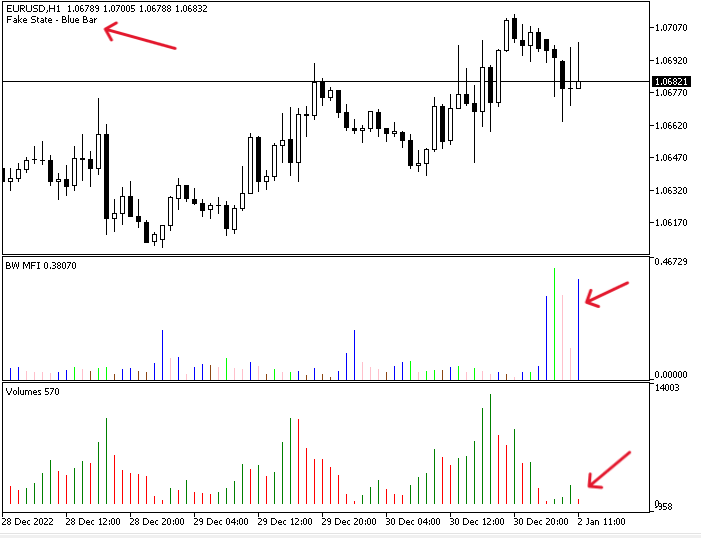
The same as we can see in the previous example as we got a signal of a fake state based on this trading system.
In the case of squat state:
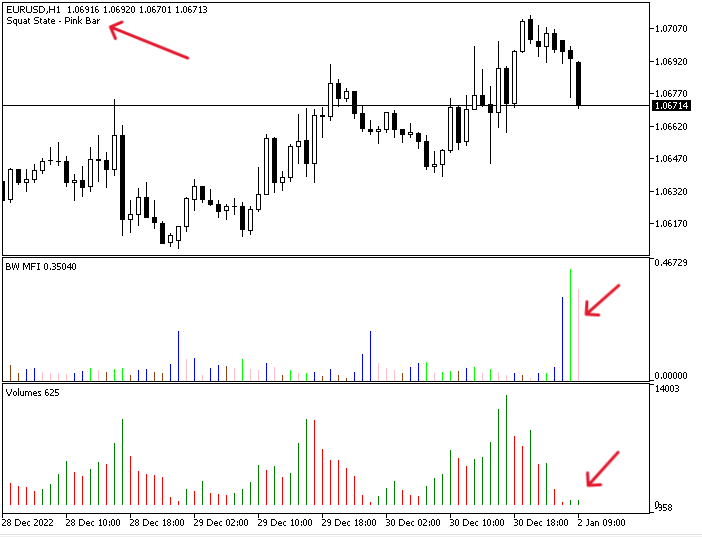
We have a signal of a squat state as a comment on the top left corner of the chart based on this trading strategy.
Strategy two: BW MFI signals
The following is the full code of this trading system of this strategy.
//+------------------------------------------------------------------+
//|                                               BW MFI Signals.mq5 |
//|                                  Copyright 2023, MetaQuotes Ltd. |
//|                                             https://www.mql5.com |
//+------------------------------------------------------------------+
#property copyright "Copyright 2023, MetaQuotes Ltd."
#property link      "https://www.mql5.com"
#property version   "1.00"
//+------------------------------------------------------------------+
//| Expert initialization function                                   |
//+------------------------------------------------------------------+
void OnTick()
  {
   double BWMFIArray[];
   double volArray[];
   ArraySetAsSeries(BWMFIArray,true);
   ArraySetAsSeries(volArray,true);
   int BWMFIDef=iBWMFI(_Symbol,_Period,VOLUME_TICK);
   int volDef=iVolumes(_Symbol,_Period,VOLUME_TICK);
   CopyBuffer(BWMFIDef,0,0,3,BWMFIArray);
   CopyBuffer(volDef,0,0,3,volArray);
   double BWMFIVal=NormalizeDouble(BWMFIArray[0],5);
   double BWMFIVal1=NormalizeDouble(BWMFIArray[1],5);
   double volVal=NormalizeDouble(volArray[0],5);
   double volVal1=NormalizeDouble(volArray[1],5);
   bool greenState = BWMFIVal>BWMFIVal1&&volVal>volVal1;
   bool fadeState = BWMFIVal<BWMFIVal1&&volVal<volVal1;
   bool fakeState = BWMFIVal>BWMFIVal1&&volVal<volVal1;
   bool squatState = BWMFIVal<BWMFIVal1&&volVal>volVal1;

   if(greenState)
     {
      Comment("Find a good entry");
     }
   if(fadeState)
     {
      Comment("Find a good exit");
     }
   if(fakeState)
     {
      Comment("False breakout Probability");
     }
   if(squatState)
     {
      Comment("Market is Balanced");
     }
  }
//+------------------------------------------------------------------+
Differences of this code:
Declaring bool variables for four states green, fade, fake, and squat to specific conditions of every state,
   bool greenState = BWMFIVal>BWMFIVal1&&volVal>volVal1;
   bool fadeState = BWMFIVal<BWMFIVal1&&volVal<volVal1;
   bool fakeState = BWMFIVal>BWMFIVal1&&volVal<volVal1;
   bool squatState = BWMFIVal<BWMFIVal1&&volVal>volVal1;
Conditions of the strategy:
In the case of the green state
   if(greenState)
     {
      Comment("Find a good entry");
     }
In the case of the fade state
   if(fadeState)
     {
      Comment("Find a good exit");
     }
In the case of the fake state
   if(fakeState)
     {
      Comment("False breakout Probability");
     }
In the case of the squat state
   if(squatState)
     {
      Comment("Market is Balanced");
     }
After compiling and executing this code, we can find the EA is attached to the chart the same as the following:
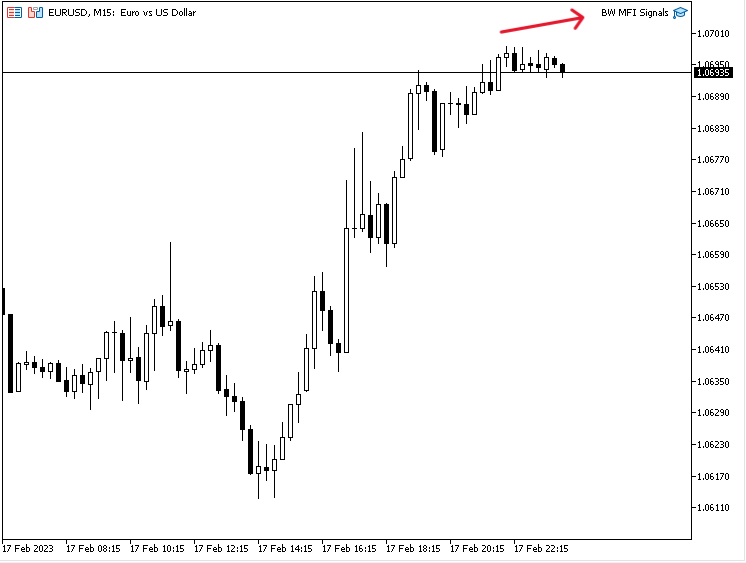
We can see that the EA of BW MFI signals is attached to the chart in the top right corner. We can get our signals based on this trading system now the same as the following:
In the case of finding a good entry signal:
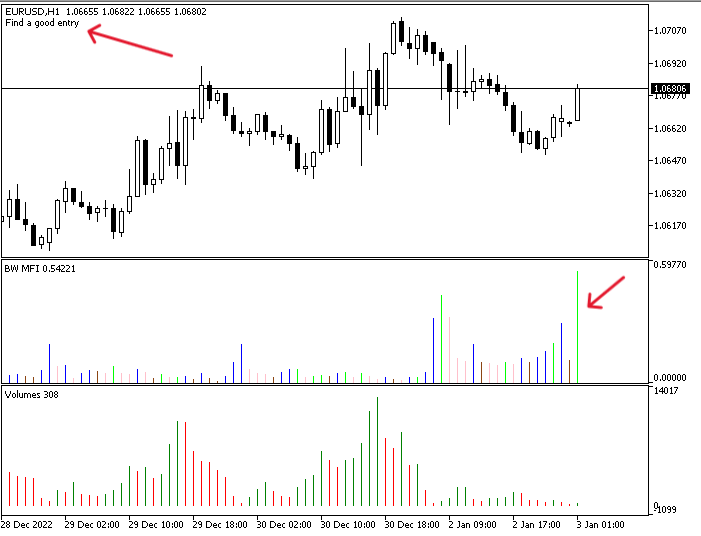
As we can we have our signal of finding a good entry in the top left corner of the chart as a comment.
In the case of finding a good exit signal:
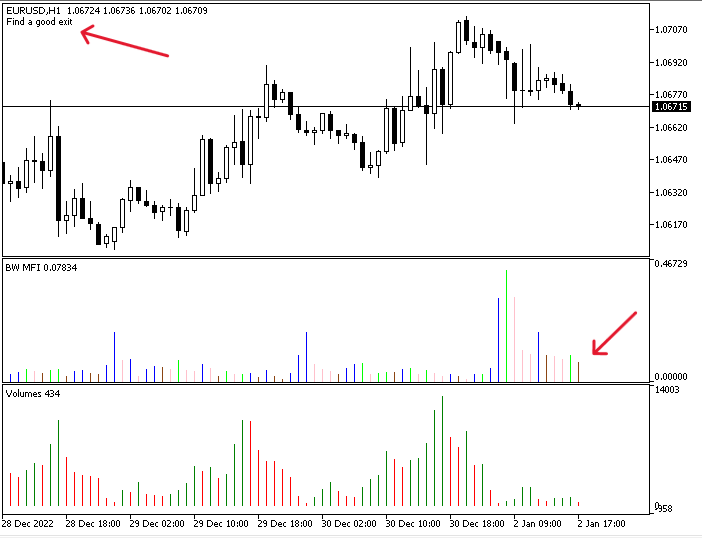
As we can we have our signal of find a good exit in the top left corner of the chart as a comment.
In the case of a false breakout Probability signal:
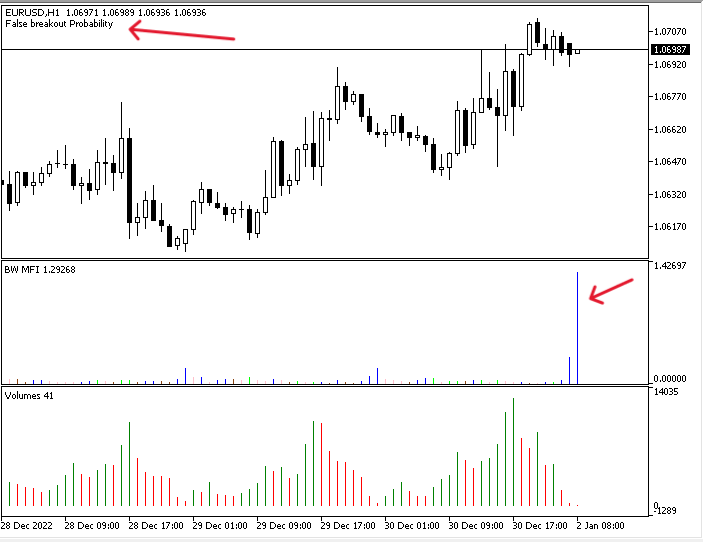
As we can we have our signal of false breakout probability in the top left corner of the chart as a comment.
In case of the market is Balanced signal:
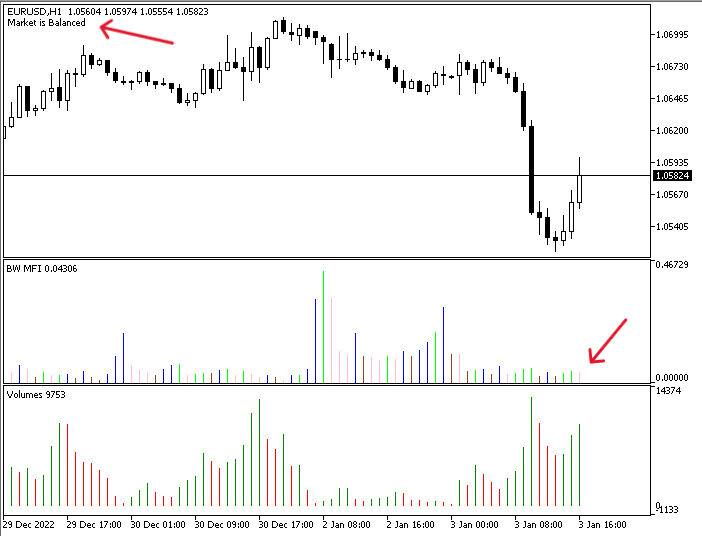
As we can we have our signal of the market is balanced in the top left corner of the chart as a comment.
Strategy three: BW MFI with MA:
The following is the full code of this trading system based on the strategy that we will combine between the BW MFI with the moving average.
//+------------------------------------------------------------------+
//|                                               BW MFI with MA.mq5 |
//|                                  Copyright 2023, MetaQuotes Ltd. |
//|                                             https://www.mql5.com |
//+------------------------------------------------------------------+
#property copyright "Copyright 2023, MetaQuotes Ltd."
#property link      "https://www.mql5.com"
#property version   "1.00"
//+------------------------------------------------------------------+
//| Expert initialization function                                   |
//+------------------------------------------------------------------+
void OnTick()
  {
   double BWMFIArray[];
   double volArray[];
   double maArray[];
   MqlRates pArray[];
   ArraySetAsSeries(BWMFIArray,true);
   ArraySetAsSeries(volArray,true);
   ArraySetAsSeries(maArray,true);
   int BWMFIDef=iBWMFI(_Symbol,_Period,VOLUME_TICK);
   int volDef=iVolumes(_Symbol,_Period,VOLUME_TICK);
   int maDef=iMA(_Symbol,_Period,10,0,MODE_SMA,PRICE_CLOSE);
   int data=CopyRates(_Symbol,_Period,0,10,pArray);
   CopyBuffer(BWMFIDef,0,0,3,BWMFIArray);
   CopyBuffer(volDef,0,0,3,volArray);
   CopyBuffer(maDef,0,0,3,maArray);
   double BWMFIVal=NormalizeDouble(BWMFIArray[0],5);
   double BWMFIVal1=NormalizeDouble(BWMFIArray[1],5);
   double volVal=NormalizeDouble(volArray[0],5);
   double volVal1=NormalizeDouble(volArray[1],5);
   double maVal=NormalizeDouble(maArray[0],5);
   double closingPrice=pArray[0].close;
   bool greenState = BWMFIVal>BWMFIVal1&&volVal>volVal1;
   bool fadeState = BWMFIVal<BWMFIVal1&&volVal<volVal1;
   bool fakeState = BWMFIVal>BWMFIVal1&&volVal<volVal1;
   bool squatState = BWMFIVal<BWMFIVal1&&volVal>volVal1;
   if(closingPrice>maVal&&greenState)
     {
      Comment("Buy Signal");
     }
   else
      if(closingPrice<maVal&&greenState)
        {
         Comment("Sell signal");
        }
      else
         Comment("");
  }
//+------------------------------------------------------------------+
Differences in this code:
Creating two more arrays for maArray by using the double function and pArray by using the MqlRates function,
   double maArray[];
   MqlRates pArray[];
Sorting data in maArray by using the "ArraySetAsSeries" function:
ArraySetAsSeries(maArray,true);
Creating an integer variable for maDef and defining the Moving Average by using the "iMA" function to return the indicator handle and its parameters:
- symbol: to determine the symbol name. We'll determine (_SYMBOL) to be applied for the current chart.
- period: to determine the period, we'll use (_PERIOD) to be applied for the current time frame and you can also use (PERIOD_CURRENT) for the same purpose.
- ma_period: to determine the average period, we'll use (10).
- ma_shift: to determine the horizontal shift if needed. We'll set (0) as we do need not to shift the MA.
- ma_method: to determine the moving average type, we'll set SMA (Simple Moving Average).
- applied_price: to determine the type of used price in the calculation, we'll use the closing price.
int maDef=iMA(_Symbol,_Period,10,0,MODE_SMA,PRICE_CLOSE);
Getting historical data of MqlRates by using the "CopyRates" function:
- symbol_name: to determine the symbol name, we'll use (_Symbol) to be applied for the current symbol.
- timeframe: to determine the timeframe ad we will use the (_Period) to be applied for the current time frame.
- start_pos: to determine the starting point or position, we'll use (0) to start from the current position.
- count: to determine the count to copy, we'll use (10).
- rates_array[]: to determine the target of the array to copy, we'll use (pArray).
int data=CopyRates(_Symbol,_Period,0,10,pArray);
Defining data and storing results by using the "CopyBuffer" function for the BWMFIArray, volArray, and maArray.
   int data=CopyRates(_Symbol,_Period,0,10,pArray);
   CopyBuffer(BWMFIDef,0,0,3,BWMFIArray);
   CopyBuffer(volDef,0,0,3,volArray);
   CopyBuffer(maDef,0,0,3,maArray);
Getting values of the current BW MFI, volumes, simple moving average, and closing price in addition to the previous values of BW MFI and volumes.
   double BWMFIVal=NormalizeDouble(BWMFIArray[0],5);
   double BWMFIVal1=NormalizeDouble(BWMFIArray[1],5);
   double volVal=NormalizeDouble(volArray[0],5);
   double volVal1=NormalizeDouble(volArray[1],5);
   double maVal=NormalizeDouble(maArray[0],5);
   double closingPrice=pArray[0].close;
Creating bool variables of green, fade, fake, and squat states:
   bool greenState = BWMFIVal>BWMFIVal1&&volVal>volVal1;
   bool fadeState = BWMFIVal<BWMFIVal1&&volVal<volVal1;
   bool fakeState = BWMFIVal>BWMFIVal1&&volVal<volVal1;
   bool squatState = BWMFIVal<BWMFIVal1&&volVal>volVal1;
Conditions of this strategy:
In the case of a buy signal
   if(closingPrice>maVal&&greenState)
     {
      Comment("Buy Signal");
     }
In the case of a sell signal
   else
      if(closingPrice<maVal&&greenState)
        {
         Comment("Sell signal");
        }
Otherwise
      else
         Comment("");
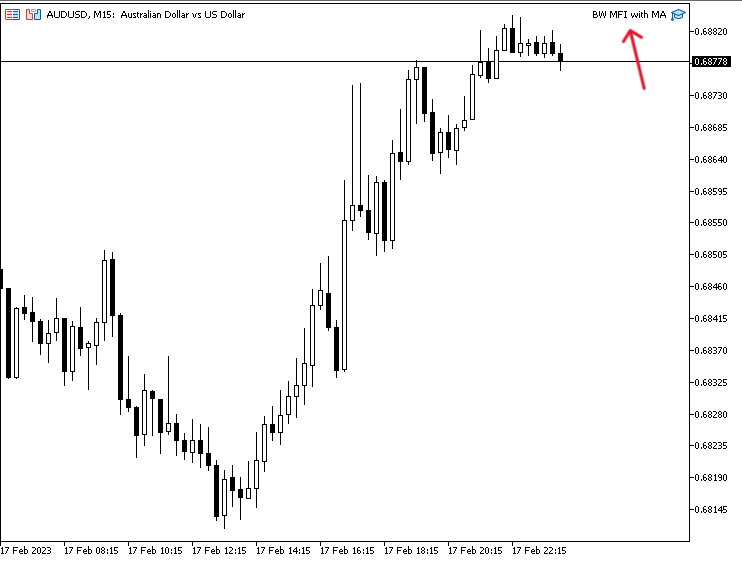
After compiling this code and executing it we will find it attached to the chart the same as the following:
In the case of a buy signal
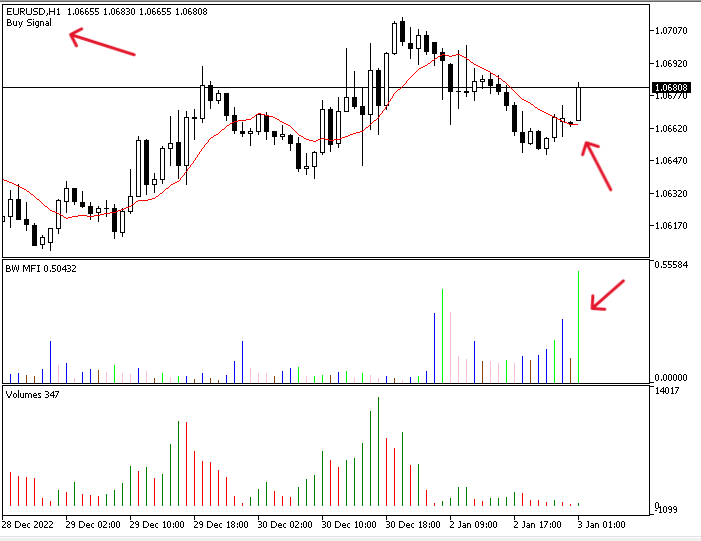
As we can see in the top left corner we have a buy signal that appeared as a comment on the chart.
In the case of a sell signal
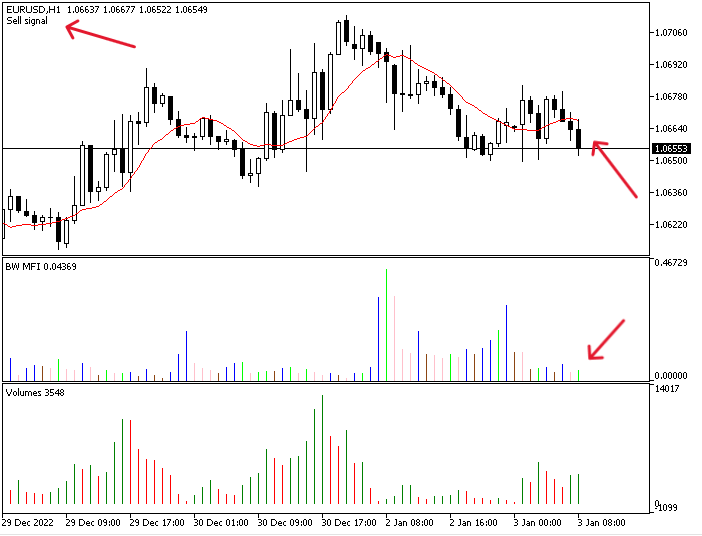
As we can see in the top left corner we have a sell signal that appeared as a comment on the chart. Through the previous in this topic, we learned how to create different trading systems based on mentioned strategies.
Conclusion
At the end of this article, it is supposed that you now understand the main concept of the Market Facilitation Index technical indicator which was developed by Bill Williams. Now you should know how we can calculate it manually and how to insert it onto the chart in the MetaTrader 5 trading platform, as well as how to interpret its readings. We have also learned how to use it. For this purpose, we considered some simple strategies based on the main concept of it:
- BW MFI - Movement Status strategy: it can be used to get the states of the market based on the bars of the indicator as a signal on the chart (green, fade, fake, and squat states).
- BW MFI Signals strategy: it can be used to get signals on the chart with the suitable decision based on the BW MFI indicator (find a good entry, find a good exit, false breakout probability, and the market is balanced).
- BW MFI with MA strategy: it can be used to get buy and sell signals based on the BW MFI and simple moving average indicator.
I advise everyone to try to use additional technical tools to get better results and see the whole view of the market. Also, you must test them before using them in your real trading to make sure they are useful for you because the main concept in this article is to share information for educational purposes only. After that, we designed step-by-step blueprints for each strategy to help us create our trading systems easily to be used in the MetaTrader 5. We learned and created them using the MQL5 language.
I hope that you find this article useful and can get more insights around its topic or any related topic to improve your trading. I hope also that you tried to apply what you learned in this article by writing codes by yourself — if you want to improve your MQL5 programming skill, this is a very important step in any learning process. If you want to read more similar articles about learning how to create a trading system based on the most popular technical indicators, you can read my other articles in this series, and I hope you find them useful too.
Warning: All rights to these materials are reserved by MetaQuotes Ltd. Copying or reprinting of these materials in whole or in part is prohibited.
This article was written by a user of the site and reflects their personal views. MetaQuotes Ltd is not responsible for the accuracy of the information presented, nor for any consequences resulting from the use of the solutions, strategies or recommendations described.
- Free trading apps
- Over 8,000 signals for copying
- Economic news for exploring financial markets
You agree to website policy and terms of use
Great work. Very Useful. Im waiting for article about news callender
Thanks for your kind comment. I'll try to write about what you mentioned.