
DIY technical indicator

Introduction
Any technical indicator is based on a certain algorithm for processing market information. As a rule, prices are used as initial data. Speaking in the language of math, the indicator is a function that converts prices into some final result. In this article, I will consider linear functions that can be used to build an indicator.
Rule #1
The idea behind all linear indicators is quite simple and boils down to four steps:
- Take a predetermined number of price readings;
- Multiply them by some ratios;
- Sum up the obtained results;
- Display the resulting value on a chart.
It is intuitively clear that the final result and the behavior of such an indicator depend on the ratios. What should these ratios be? Can they have arbitrary values or be subject to some restrictions?
The indicators that are set on the main chart can be expressed by a simple equation (in this case, we use integers as ratios):
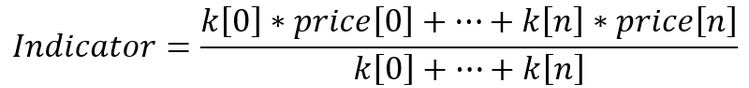
We need to do a simple transformation in order to convert the ratios to real numbers:
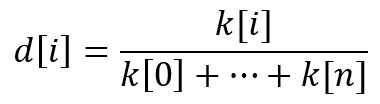
Then the main rule for such indicators is reduced to a simple statement: "The sum of the ratios should be equal to one". In other words:
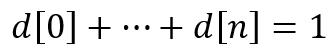
The indicator equation looks pretty simple. But there are great opportunities behind it. Let's try to create several indicators on our own, following this rule.
As a basis for our experiments, I will use a generally common indicator. Its only difference will be the input parameter - a string variable which is to store the sequence of ratios. This approach will allow us to test a large number of options using one template.
input string InpCoefficient="1,1,1,1,1";//variable for indicator ratios
We will use a comma as a separator between the ratios.
Perform the following steps inside the OnInit() function (the code also features a mysterious 'center', we will find out its purpose later):
   string s[];                                                  //array for substrings with ratios
   size=StringSplit(InpCoefficient,StringGetCharacter(",",0),s);//get substrings and their number

   ArrayResize(coeff,size);  //prepare the array for indicator ratios
   double denom=0,center=0;  //variables for normalizing values and calculating the center of the indicator
   for(int i=0; i<size; i++) // set the ratios
     {
      coeff[i]=StringToDouble(s[i]);
      denom=denom+coeff[i];
     }

   if(denom==0) //if the normalization term is 0, then something is wrong
     {
      Alert("Wrong odds!");
      return(INIT_FAILED);
     }

   for(int i=0; i<size; i++) //normalize the ratios and calculate the indicator center
     {
      coeff[i]=coeff[i]/denom;
      center=center+coeff[i]*(i+1);
     }

   Print((int)MathRound(center));//display the count closest to the center of the indicator
Now let's consider a few examples.
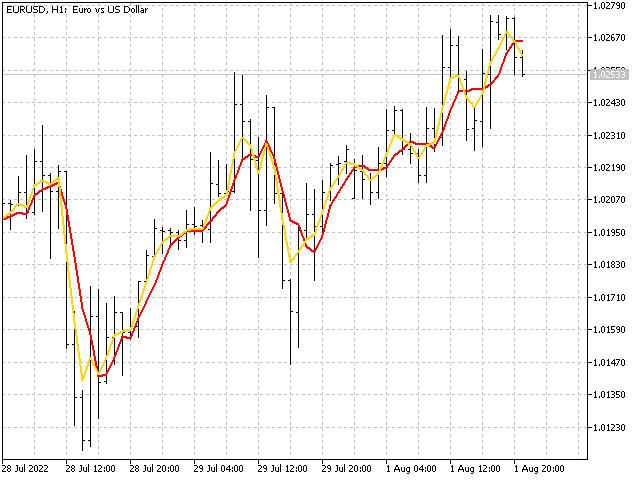
The first sequence. Let's take five price readings with the same ratios: 1,1,1,1,1. This is a simple moving average. The indicator equation in this case is (price[0] + price[1] + price[2] + price[3] + price[4])/5.
The second sequence. To obtain this sequence, we will take five moving averages with periods from one to five and find their average. This means our initial data will be as follows:
price[0]/1 +
(price[0] + price[1])/2 +
(price[0] + price[1] + price[2])/3 +
(price[0] + price[1] + price[2] + price[3])/4 +
(price[0] + price[1] + price[2] + price[3] + price[4])/5.
Summing them up will give us the ratios of our sequence – 137,77,47,27,12.
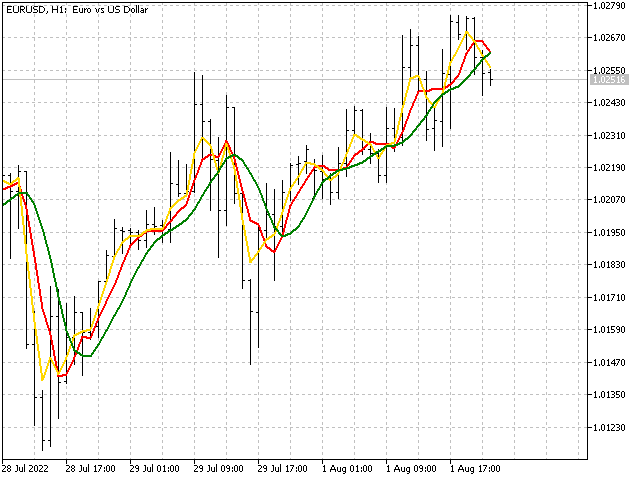
The third sequence. For this sequence, we will take five moving averages with the shift of one step back. Then we will find their average. In other words, we will get the average of several moving averages as a result. Opening data:
(price[0] + price[1] + price[2] + price[3] + price[4])/5 +
(price[1] + price[2] + price[3] + price[4] + price[5])/5 +
(price[2] + price[3] + price[4] + price[5] + price[6])/5 +
(price[3] + price[4] + price[5] + price[6] + price[7])/5 +
(price[4] + price[5] + price[6] + price[7] + price[8])/5.
The result is a triangular window with ratios – 1,2,3,4,5,4,3,2,1.
Various mathematical sequences can be used as indicator ratios. Below are the examples of a few more indicators. One of them is based on Fibo numbers: 34,21,13,8,5,3,2,1,1. Another indicator is also built on Fibo numbers, but a symmetrical construction is built from them: 1,1,2,3,5,3,2,1,1. The third indicator is based on the series of Pascal's triangle: 1,8,28,56,70,56,28,8,1.
The ratios for the indicator can also be found in the Encyclopedia of Integer Sequences. In 2014, a competition was held for the most beautiful new sequence. The sequences A229037, A235265 and A235383 were declared winners. One of these sequences even got its own name - "forest fire". This sequence is interesting in that it avoids linear trends. Here is what the indicators built on their basis look like.
Words can also be converted into indicator ratios. Let's take the name of the most popular trading platform MetaTrader 5. We will take the ordinal number of each letter as ratios. In this case, we get the sequence: 13,5,20,1,20,18,1,4,5,18,5.
This trading platform is released by MetaQuotes Software Corp. If we omit the spaces and the period, we get the sequence: 13,5,20,1,17,21,15,20,5,19,19,15,6,20,23,1,18,5,3,15,18,16.
The indicators based on these sequences look like this.
Finally, let's make yet another indicator and name it... Oh, well... I will not name it that, otherwise the article will be subject to age restrictions. Let it simply be Crazy. The main feature of this indicator is that we use random ratios with each new call.
Knowing the ratios of the indicator, we can get one of its important characteristics. To do this, we need to calculate what reference the weight center of the indicator falls on. To do this, we need to substitute the reference number in the indicator equation:
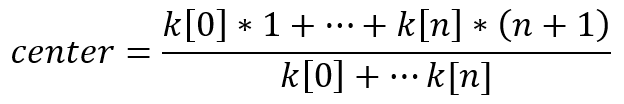
Depending on the center and period of the indicator, we can attribute it to one of three types. Let 'period' be the period of the indicator.
- Trend: center < period/3
- Smoothing: period/3 < center < 2*period/3
- Countertrend: 2*period/3 < center
Rule #1a
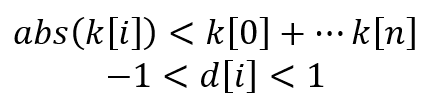
As we can see, following the rule #1 always yields a fully functional technical indicator. But here the question arises: can there be negative ratios in the indicator? Here an additional rule comes into play, which sounds like this: the absolute value of any ratio should be less than their sum. Or, in symbolic form for integer and real ratios:
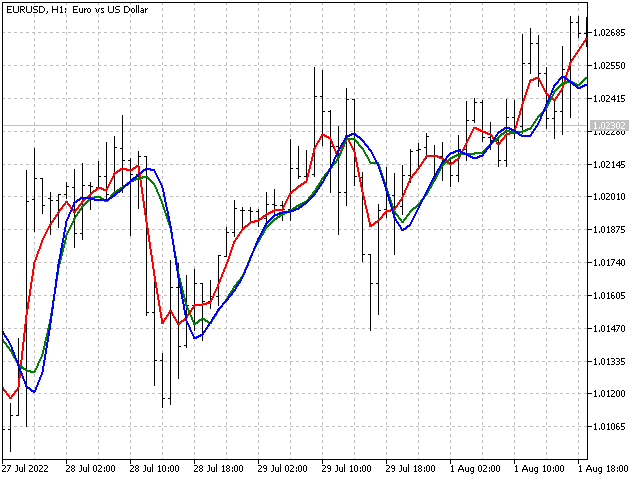
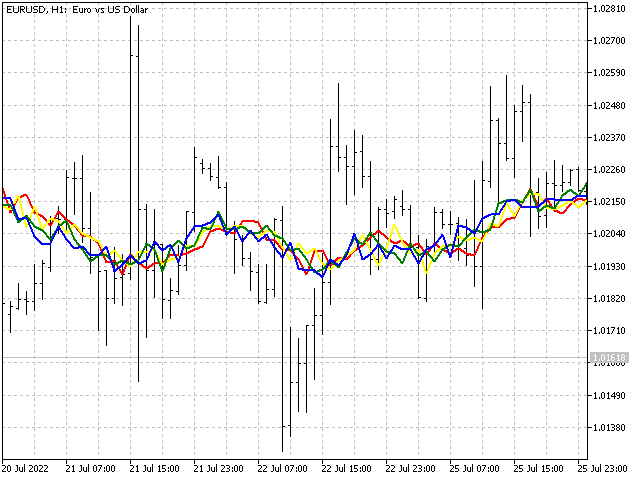
This limitation is related to the stability of the indicator. For example, let's take several sequences obtained from a linearly weighted moving average: 5,4,3,2,1 - blue line, 5,4,3,2,-1 - green, 5,4,3,-2,-1 - yellow and 5,4,-3,-2,-1 - red.
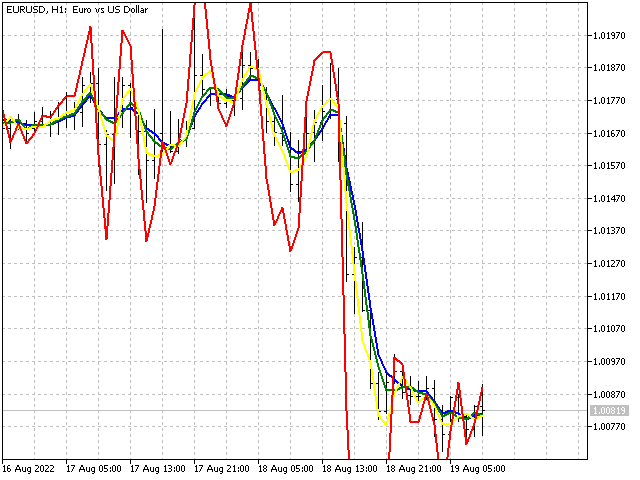
As we can see, the last option behaves quite freely compared to the previous ones — the indicator has lost stability. Therefore, if there are negative ratios in the indicator, it is necessary to check their compliance with the rule 1a.
Small pause
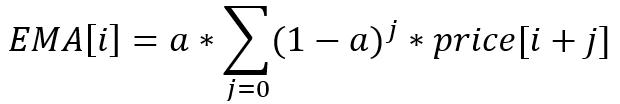
The rule for ratios allows us not only to create new indicators, but also to modify the standard options. Let's take an exponential moving average as an example. Its equation is simple and known to everyone:

This is an example of a recursive indicator where its current value depends on the previous one. If we expand the recursion, then the exponential average equation will look like this:
Here we have a geometric progression of infinite length.
A quick note: what we colloquially call an EMA period is actually a simple moving average period whose center matches the center of the EMA.
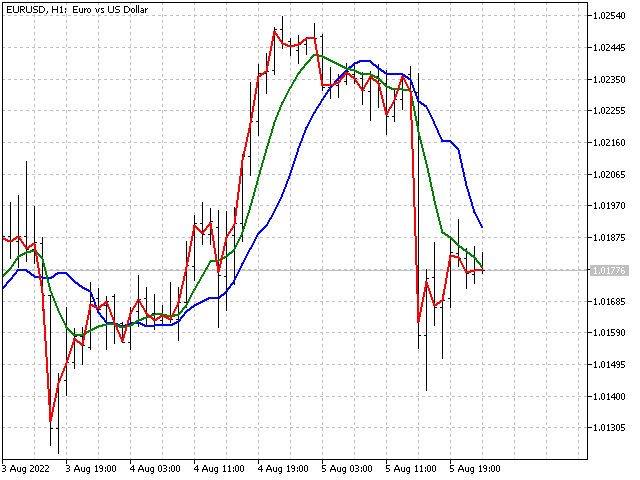
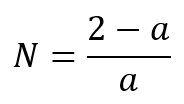
Let's try to limit the length of the progression. Then we get a filter, which I will call geometric. The most interesting feature of this filter is that its behavior depends on both the smoothing factor and its period. At the same time, as the period increases, the geometric filter becomes more and more similar to the standard EMA. For example, let's take the exponential smoothing ratio equal to a = 0.1. Then the EMA period can be calculated as follows:
Now let's compare the behavior of the EMA and the geometric filter with the same smoothing ratio, but with the period equal to 10.
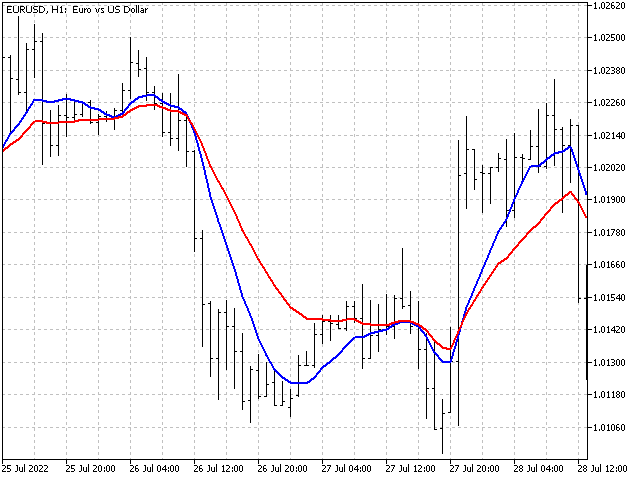
If we gradually increase the period of the geometric filter, we will see how it gradually approaches the EMA.
In addition to a geometric progression, there is also an arithmetic one. In the MetaTrader terminal, the arithmetic progression is implemented as a linearly weighted average. Let's make small changes to it introducing an arithmetic progression step. It will allow us to get an indicator with the values from SMA to LWMA.
Now it remains to take one more step combining both options in order to obtain an arithmetic-geometric progression as a result. I will slightly deviate from the mathematical canons and allow different progressions to have different periods. As a result, we get an indicator whose behavior can change over a fairly wide range. At least, the standard options (SMA, LWMA and EMA) are unable to show the same flexibility as our new indicator.
Window functions for dummies
We can use window functions applied in digital signal handling as indicator ratios. Let's look at a fairly universal option — the window of the sum of cosines. The generalized equation for the ratios of such a window looks like this:
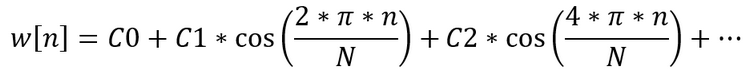
Let's try to construct our own solution based on this window, which can be used in technical indicators. To do this, we will write a script that will calculate the indicator ratios.
All standard window functions are symmetrical about their center. We can afford to move the center of the window function to the beginning or end of the indicator. Then, based on the same function, we can get a trending, smoothing or countertrend indicator. Such a solution, albeit implicitly, is used in conventional indicators: for example, LWMA is a half of a triangular window, and EMA is a truncated Laplace window.
Let iPeriod be the period of our future indicator. Then, the indicator center can take values from 1 to iPeriod with a step equal to 0.5. In other words, iCenter can take values 1, 1.5, 2, ... iPeriod.
   int period=MathMax(2,iPeriod),     //check indicator length for min. acceptable value
       step=(int)MathRound(2*iCenter);//number of steps to the center of the indicator by 0.5

   double center=0.5*step;      //indicator center
   if(center<1 || center>period)//check if the center has a valid value
      center=0.5*(period+1);
Now we only have to determine the width of the window and find its offset. This offset allows us to match the center of the indicator and that of the window function.
   int width=(int)(2*center),//window function width
       shift=1;              //offset to match the centers of the indicator and the window

   if(2*center<=period)//if the center is shifted to the beginning of the indicator
     {
      width=2*period-(int)(2*center)+2;
      shift=period-(int)(2*center)+2;
     }
Let's restrict ourselves to a fifth-order window. Then we need to set up to five ratios C1 - C5. Any numbers can be used as ratios. In this case, the condition should necessarily be fulfilled - each next ratio should be less than the previous one. In other words, C1 > C2 > C3 > C4 > C5. The fulfillment of this condition is necessary for the correct calculation of the normalizing value.
If all ratios of the window function are equal to zero, then we get a rectangular window (SMA). A few other options are listed below (ratios with zero values omitted).
Hann window: C1 = 1.
Ratio linear fall-off window: C1 = 5, C2 = 4, C3 = 3, C4 = 2, C5 = 1.
Fibo window: C1 = 8, C2 = 5, C3 = 3, C4 = 2, C5 = 1.
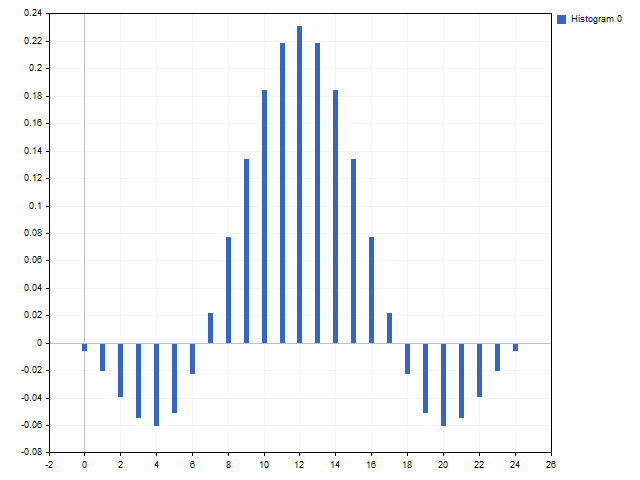
We can get window functions with partially negative values in case of some ratio values. This makes them look like a standard flat top window: C1 = 3, C2 = 2.
Window functions for advanced users
We can use a generalized adaptive polynomial to construct window functions. Its equation looks like this:

A distinctive feature of this polynomial is that all parameters are independent of each other. The only exception is that the parameter C0 should not be less than the sum of all other ratios. The ratios should be at least zero and the exponents should be greater (if the exponent is zero, then a rectangular window is obtained, which can be obtained using the C0 ratio anyway).
Using this polynomial, you can get both already known window functions and something unusual. For example, with C0 = 1, we get a rectangular window (SMA).
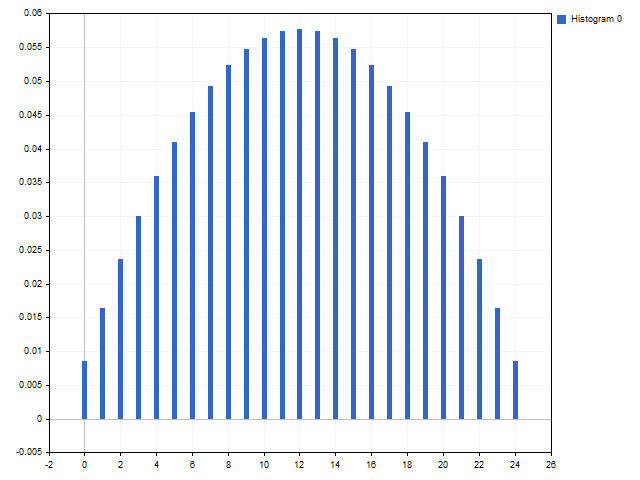
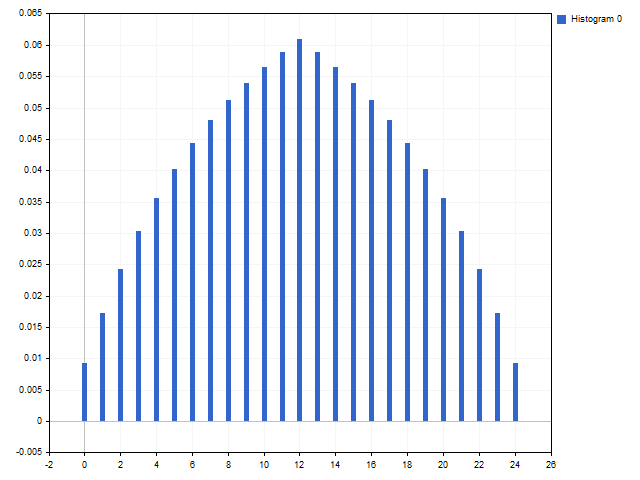
Triangular window: C0 = 1, C1 = 1, P1 = 1.

Welch window: C0 = 1, C1 = 1, P1 = 2.
Besides, you can get something unusual. Window with Fibo numbers and linear growth of the degree (the C0 ratio is left free, then it will take the value): C1 = 8, P1 = 1, C2 = 5, P2 = 2, C3 = 3, P3 = 3, C4 = 2, P4 = 4, C5 = 1, P5 = 5.
Rule #2
Until now, we have considered indicators that are placed on the main chart and completely forgot about oscillators. The rule that underlies all oscillators is very simple: the sum of the oscillator ratios is zero.
A working oscillator is easiest to make when based on two indicators. Then the oscillator equation will be:

In this case, the indicators should be different. For example, this is how an oscillator based on rectangular and triangular windows looks like: 1,1,1,1,1 and 1,2,3,2,1.
You can also use the same window function but different lengths: 1,2,3,2,1 and 1,2,3,4,5,4,3,2,1.
It may also be the same indicator shifted a few counts back: 5,4,3,2,1 and 0,0,0,5,4,3,2,1 (the zeros in the second sequence carry out a shift of three counts):
The oscillators are quite often used in trading strategies. For example, all strategies that use the intersection of two indicators as signals can be reduced to one oscillator.
For example, let's write a simple EA. Several pairs of indicators will serve as sources of signals:
- two simple moving averages;
- linearly weighted average and triangular window;
- MetaQuotes indicator with both trading platforms (let's compare which one is more profitable);
- and of course, Crazy.
The EA will open Buy positions when the indicator line with a small period crosses the line of another indicator upwards. Sell positions will be opened when crossing downwards. Opening a position in one direction leads to closing positions in the opposite direction. These conditions will look like a change in the sign of the oscillator based on the corresponding indicators.
Test parameters: EURUSD H1, 2021.01.01 - 2021.12.31.
The test results are shown in the table. In case of Crazy, I performed 5 tests considering its features.
| TypeInd | Total Net Profit | Gross Profit | Gross Loss | Total Trades |
|---|---|---|---|---|
| SMA | -112.15 | 338.69 | -450.84 | 340 |
| TMA | 4.64 | 422.06 | -417.42 | 372 |
| MT4 | -39.43 | 402.26 | -441.69 | 444 |
| MT5 | -45.27 | 395.20 | -440.47 | 438 |
| Crazy 1 | -82.13 | 432.68 | -514.81 | 640 |
| Crazy 2 | -91.15 | 469.24 | -560.39 | 662 |
| Crazy 3 | -57.01 | 454.13 | -511.14 | 612 |
| Crazy 4 | -39.16 | 487.40 | -526.56 | 673 |
| Crazy 5 | -21.45 | 471.97 | -493.42 | 666 |
As we can see, none of the options showed impressive results. Although Crazy was relatively good. The difference between the best and worst trade is 4. This indicator is actually crazy.
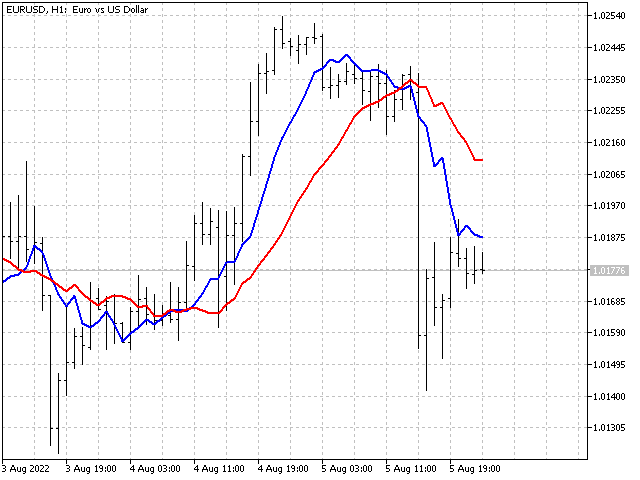
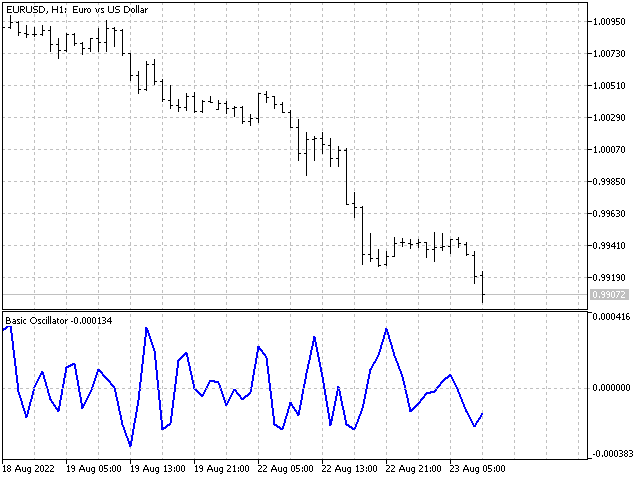
Let's see if we can improve our strategy. Let's look at the chart - here is an example of two intersections, when formally the red line crossed the blue one in the same direction.
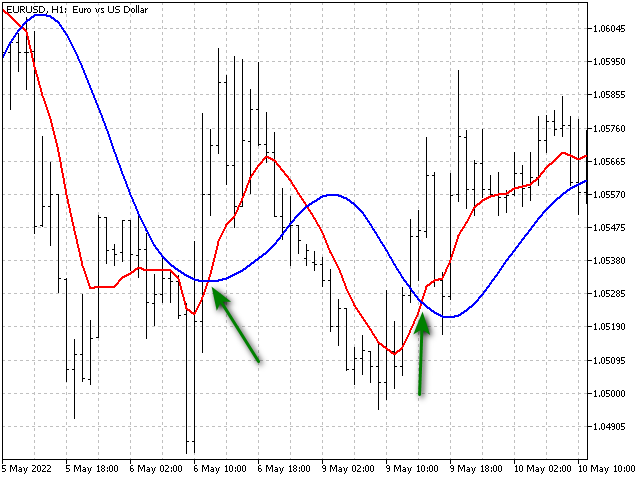
But the behavior of the blue line looks different. Let's add two additional oscillators to the main one, which will track changes in the values of the indicators themselves. Then the EA will be able to sort some inputs. Let's see what result this complication can yield.
| TypeInd | Total Net Profit | Gross Profit | Gross Loss | Total Trades |
|---|---|---|---|---|
| SMA | 45.64 | 325.11 | -279.47 | 138 |
| TMA | 156.03 | 466.26 | -310.23 | 306 |
| MT4 | -133.56 | 296.25 | -429.81 | 212 |
| MT5 | -192.40 | 273.05 | -465.45 | 203 |
| Crazy 1 | 114.30 | 564.00 | -449.70 | 409 |
| Crazy 2 | -93.57 | 421.01 | -514.58 | 413 |
| Crazy 3 | -31.83 | 445.27 | -477.10 | 446 |
| Crazy 4 | 3.87 | 451.39 | -447.52 | 431 |
| Crazy 5 | -8.04 | 458.58 | -466.62 | 409 |
As we can see, the addition of new oscillators has had a positive effect in some cases. In others, the result has worsened. Perhaps, it is necessary to take into account not only qualitative, but also quantitative parameters for such strategies. In any case, strategies of this kind require further study.
Conclusion
As you can see, developing a technical indicator can be quite an exciting experience. The attachments:
- Base Indicator — a template that allows you to build indicators based on their ratios.
- OEIS — an indicator based on the most beautiful sequences. All sequences have period restrictions.
- Crazy — an indicator that uses random ratios.
- Arithmetic Geometric Filter — an indicator based on arithmetic and geometric progressions.
- Window Functions for Dummies — a script that allows calculating a window function based on a cosine polynomial. The script saves the obtained ratios in a text file in the Files folder.
- Window Functions for Advanced — a script that calculates indicator ratios using a generalized adaptive polynomial. The calculation result is also saved to a file.
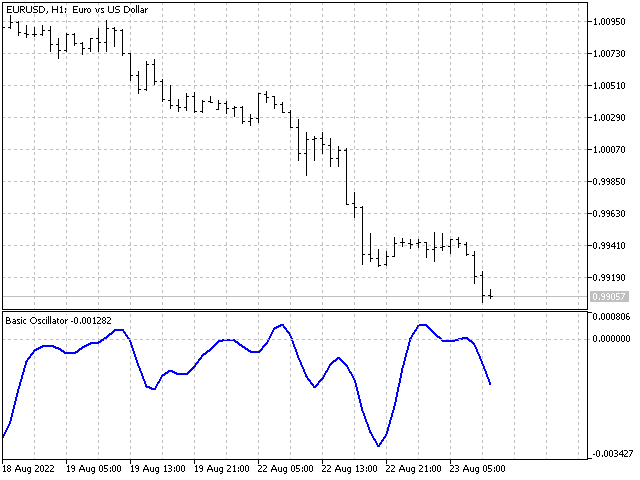
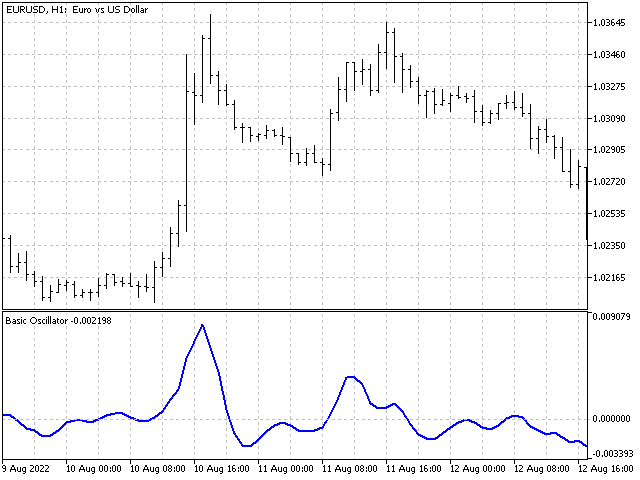
- Basic Oscillator — template for an oscillator based on two indicators.
- EA Indicator — an EA that opens positions using oscillators. The Control parameter determines the number of oscillators to analyze.
Translated from Russian by MetaQuotes Ltd.
Original article: https://www.mql5.com/ru/articles/11348
Warning: All rights to these materials are reserved by MetaQuotes Ltd. Copying or reprinting of these materials in whole or in part is prohibited.
This article was written by a user of the site and reflects their personal views. MetaQuotes Ltd is not responsible for the accuracy of the information presented, nor for any consequences resulting from the use of the solutions, strategies or recommendations described.

 Learn how to design a trading system by Fractals
 Market math: profit, loss and costs
 Data Science and Machine Learning (Part 08): K-Means Clustering in plain MQL5
 Developing a trading Expert Advisor from scratch (Part 27): Towards the future (II)
- Free trading apps
- Over 8,000 signals for copying
- Economic news for exploring financial markets
You agree to website policy and terms of use
Great article. Thank you.
Thank you. I will try to prepare material on adaptive indicators soon.
What's with the title, huh?
The work is very serious, I was really interested in familiarising myself with the calculations.
But the title hints that here is just an instruction "Let's open the wizard and write the parameters in the necessary boxes"....
Can we change it? Something like "Universal indicator with your own hands" or "Indicators and signal theory"?
Or is it already too complicated?