
Price Action Analysis Toolkit Development (Part 26): Pin Bar, Engulfing Patterns and RSI Divergence (Multi-Pattern) Tool

Introduction
In my previous article, I focused on identifying four candlestick formations: pin bar, doji, engulfing, and marubozu. These patterns were used to generate buy or sell signals immediately upon recognition. However, this approach sometimes produced false signals because the confirmation relied solely on pattern recognition without additional filters.
This article introduces a new tool that concentrates on two key patterns: pin bar and engulfing. These patterns are combined with RSI divergence to confirm each signal. RSI divergence is a tool I developed in the past as a standalone indicator based on price action. By integrating pattern recognition with RSI divergence, we create a more robust and powerful analytical method, offering more profound insights and improving trading accuracy through comprehensive price action analysis.
We will begin by examining the two patterns in greater depth, followed by an overview of the strategy, a breakdown of the code components, backtesting results, and analysis. Finally, we will conclude with key takeaways. Please see the table of contents below.
- Understanding Candlestick Patterns
- Strategy Overview
- Code Components Breakdown
- Backtesting and Results
- Conclusion
Understanding Candlestick Patterns
Candlestick patterns are a type of chart used in technical analysis to analyze price movements in financial markets. They visually represent the open, high, low, and close prices of a market over a specific period, offering insights into potential market direction and sentiment. There are many candlestick patterns available, but as mentioned in this article, we are focusing on two main patterns: the pin bar and the engulfing pattern. These patterns can appear as a single or two candles on higher timeframes, or as multiple candles on lower timeframes. Let's look at the presentation below, where I will explain in detail to help you understand what I mean.The first diagram (Fig. 1) illustrates a bearish engulfing pattern on the M30 timeframe. It consists of two candles: the first is a bullish candle with a small body, followed by a bearish candle with a larger body that engulfs the previous bullish candle.
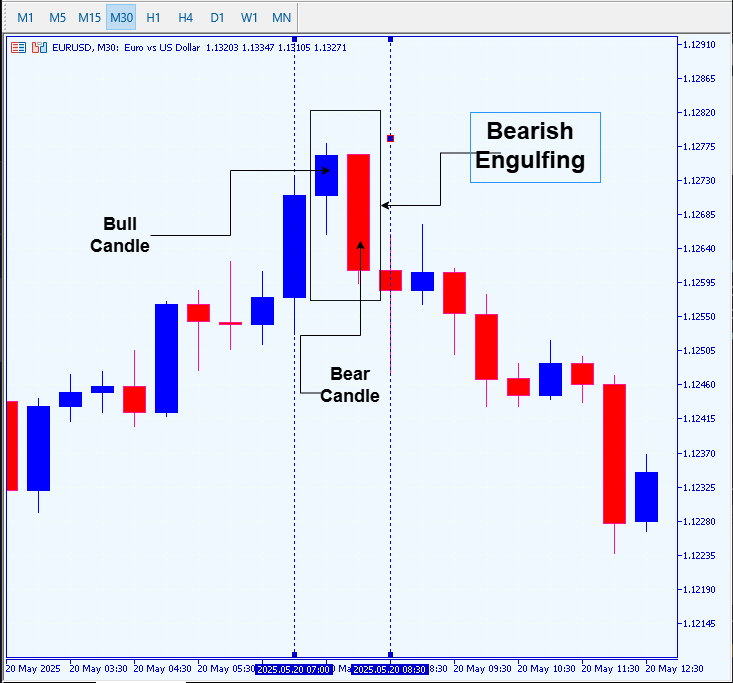
Fig. 1. Bearish Engulfing M30
The same pattern can be represented by multiple candles when viewed on a lower timeframe. Let's look at the diagram below (Fig. 2). It shows the same candlestick pattern as before, but now displayed on the M5 timeframe, where it is represented by a series of several candles.
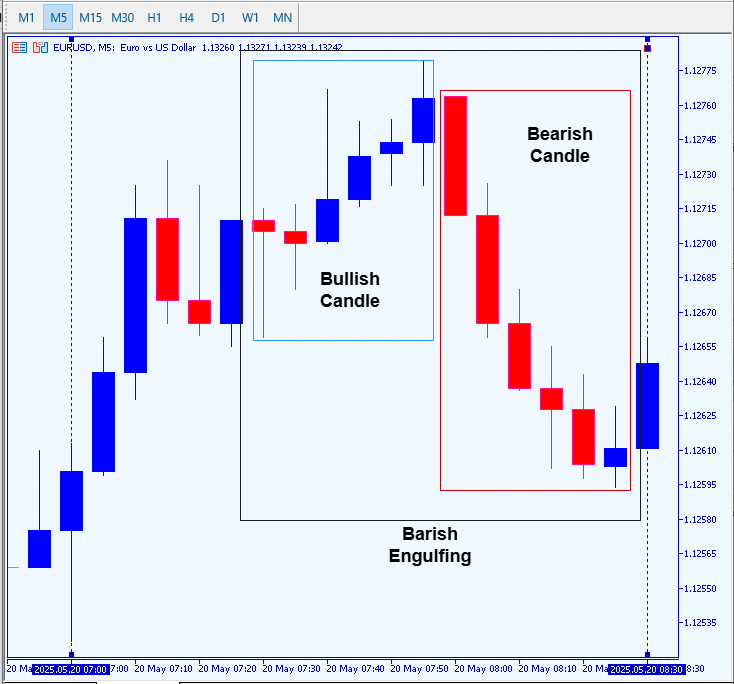
Fig. 2. Bearish Engulfing M5
Let's proceed to discuss the two patterns we are focusing on, the pin bar and the engulfing pattern, as well as RSI divergence. We won't delve deeply into these topics here, as we covered them extensively in our previous article. You can refer to that article through the link provided.
Pin Bar
A pin bar is a type of candlestick characterized by a small real body and a prominent wick, signaling a significant rejection of price at a specific level. It appears as a single candle that often indicates a potential reversal or a critical turning point in the market. The extended wick demonstrates that prices moved sharply in one direction but were quickly rejected, implying a change in market sentiment and a possible shift in momentum.
Engulfing Pattern
An engulfing candlestick pattern is a popular tool in technical analysis that signals a possible reversal in market direction. It consists of two consecutive candles, where the second candle's body entirely "engulfs" the body of the first, indicating a shift in market sentiment. This pattern serves as a reversal signal, suggesting that the previous trend may be ending, and a new trend is beginning, either a bullish reversal when a larger upward candle engulfs a smaller downward candle, or a bearish reversal when a larger downward candle engulfs a smaller upward candle.
RSI Divergence
RSI (Relative Strength Index) divergence occurs when the price of an asset and the RSI indicator move in opposite directions, signaling a potential change in momentum and a possible trend reversal. This divergence is evident when the price forms new highs or lows, but the RSI fails to confirm with corresponding highs or lows. There are two main types: bearish divergence, which happens when the price makes a new high while the RSI creates a lower high, indicating weakening upward momentum and a possible upcoming decline; bullish divergence, where the price makes a new low, but the RSI forms a higher low, suggesting that downward momentum is waning, and an upward move may follow.
RSI, as a momentum oscillator, measures the speed and change of price movements, helping traders identify overbought or oversold conditions, but it also reveals divergence patterns. When the price reaches new extremes without a matching movement in RSI, it signals a potential shift in momentum and a trend reversal.
Bearish Divergence
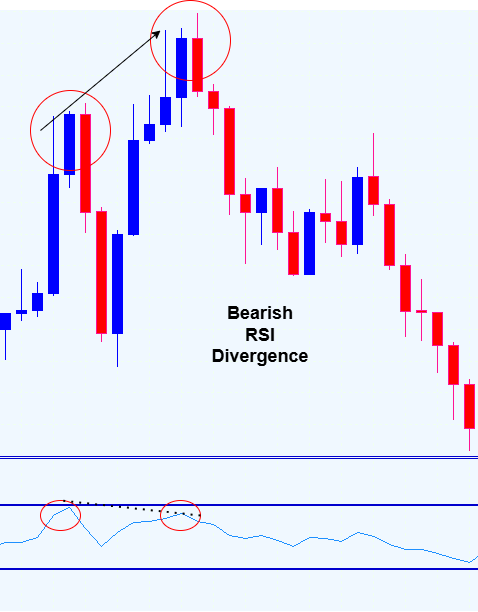
Fig. 3. Bearish RSI Divergence
Bullish RSI divergence
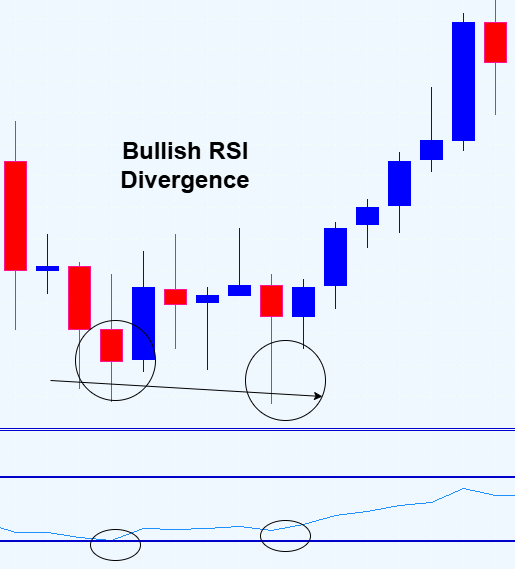
Fig. 4. Bullish RSI Divergence
Strategy Overview
Our tool thoroughly searches for and recognizes pin bar and engulfing patterns, while simultaneously checking for RSI divergence to confirm each signal, whether for buying or selling. In other words, when a pin bar or an engulfing pattern is detected, the EA verifies RSI divergence as a confirmation before validating the signal. Only if the RSI confirms the pattern does the tool display the trading signal. Below is a diagram that illustrates how a pin bar can be confirmed by bullish RSI divergence.
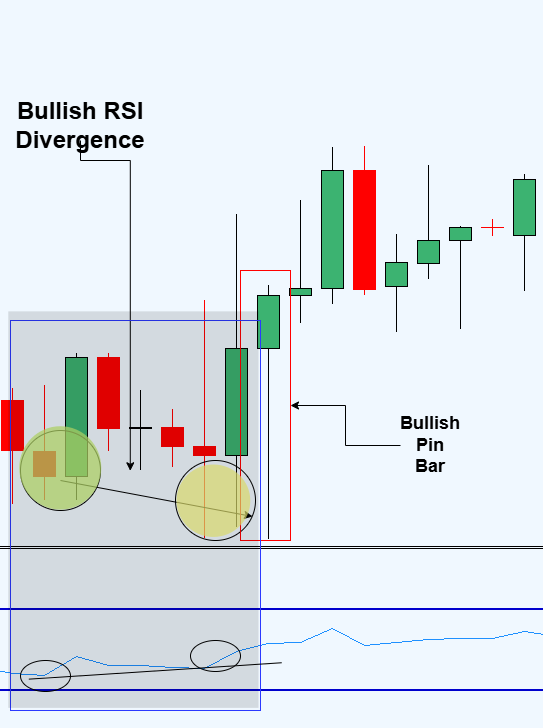
Fig. 5. Pin Bar Confirmation
Code Component Breakdown
1. Metadata and Initialization Properties
The starting section of the EA defines essential metadata that helps identify and manage the script within the MetaTrader environment. The copyright statement, link, and version number provide attribution and version control, ensuring users know the origin and update status of the script. The #propertystrict directive enforces stricter compilation rules, catching potential errors early and promoting better coding practices. This configuration ensures the EA adheres to expected standards, facilitating maintenance, troubleshooting, and identification when multiple scripts are running concurrently.
//+------------------------------------------------------------------+
//|                                           Multi-Pattern Signal EA|
//|                                   Copyright 2025, MetaQuotes Ltd.|
//|                           https://www.mql5.com/en/users/lynnchris|
//+------------------------------------------------------------------+
#property copyright "Copyright 2025, MetaQuotes Ltd."
#property link      "https://www.mql5.com/en/users/lynnchris"
#property version   "1.0"
#property strict
2. Including Libraries and Defining User Inputs
The EA includes the <Trade/Trade.mqh> library to enable order operations, such as opening, closing, and managing trades. While this version primarily focuses on pattern detection and alerts, having the trade library integrated allows for future expansion into automated trading. The input parameters are vital for customization: traders can tweak the RSI period to adjust sensitivity, set overbought and oversold thresholds for divergence detection, and configure stop-loss and take-profit levels in pips.
The EntryBuffer acts as a buffer zone to prevent entries too close to recent price extremes, reducing false signals. Notification flags enable or disable sound alerts, push notifications, and emails, giving traders control over how they receive alerts. These parameters collectively make the EA adaptable to various trading styles and market conditions.
#include <Trade/Trade.mqh>

input int    RSI_Period     = 14;      // RSI calculation period
input double RSI_Overbought = 70.0;    // RSI level indicating overbought
input double RSI_Oversold   = 30.0;    // RSI level indicating oversold
input double SL_Pips        = 20.0;    // Default stop loss in pips
input double TP_Pips        = 20.0;    // Default take profit in pips
input double EntryBuffer    = 5.0;     // Buffer in points for entry price
input bool   EnableSound    = true;    // Enable sound alerts
input bool   EnablePush     = true;    // Enable push notifications
input bool   EnableEmail    = false;   // Enable email alerts
3. Initialization: Creating Indicator Handles and Buffers
During the initial setup, the EA creates a handle for the RSI indicator using iRSI(), specifying the symbol, period, and RSI parameters. This handle is essential for retrieving live RSI values during each tick, forming the backbone of divergence detection. The arrays are set as series, which means the newest data is always at index 0. The internal buffers for time, open, high, low, and close prices are initialized to store historical data for analysis. The lastBarTime variable tracks the timestamp of the last processed candle, preventing multiple signals from being generated within the same candle, thereby avoiding redundant alerts and ensuring signal accuracy.
int OnInit()
{
    rsiHandle = iRSI(_Symbol, _Period, RSI_Period, PRICE_CLOSE);
    if(rsiHandle == INVALID_HANDLE)
        return INIT_FAILED;

    // Set arrays as series for easier access to recent data
    ArraySetAsSeries(rsiBuffer,   true);
    ArraySetAsSeries(timeBuffer,  true);
    ArraySetAsSeries(openBuffer,  true);
    ArraySetAsSeries(highBuffer,  true);
    ArraySetAsSeries(lowBuffer,   true);
    ArraySetAsSeries(closeBuffer, true);

    return INIT_SUCCEEDED;
}
4. Continuous Data Monitoring and Processing in OnTick()
The OnTick() function executes on every market tick, acting as the core loop of the EA. It starts by verifying that there are at least 20 bars available, ensuring enough historical data for pattern recognition. It then copies the latest 20 data points for timestamps and price data—open, high, low, close—into internal buffers. This step is crucial because market data is constantly updating, and analysis relies on recent, accurate data. If any copying operation fails, the function halts to prevent errors or false signals.
To prevent multiple signals within the same candle, it checks if the previous candle’s timestamp matches lastBarTime. If so, it skips processing; otherwise, it updates lastBarTime with the new candle’s timestamp. It then refreshes RSI data. Once data is prepared, it calls FindSignalBar() to analyze the recent bars for divergence patterns and candlestick signals, which forms the basis for alert generation.
void OnTick()
{
    // Ensure enough data is available
    if(Bars(_Symbol, _Period) < 20)
        return;

    // Copy recent market data
    if(CopyTime(_Symbol, _Period, 0, 20, timeBuffer)   <= 0 ||
       CopyOpen(_Symbol, _Period, 0, 20, openBuffer)   <= 0 ||
       CopyHigh(_Symbol, _Period, 0, 20, highBuffer)   <= 0 ||
       CopyLow(_Symbol, _Period, 0, 20, lowBuffer)     <= 0 ||
       CopyClose(_Symbol, _Period, 0, 20, closeBuffer) <= 0)
       return;

    // Prevent multiple signals in the same candle
    if(timeBuffer[1] == lastBarTime)
        return;
    lastBarTime = timeBuffer[1];

    // Update RSI data
    if(CopyBuffer(rsiHandle, 0, 0, 20, rsiBuffer) <= 0)
        return;

    // Detect potential divergence and pattern
    int dir = FindSignalBar();
    if(dir == 0)
        return;

    // Determine direction and compute entry/stop levels
    bool isBullish = (dir > 0);
    int idx = 1; // most recent completed bar
    double entry = isBullish
                   ? highBuffer[idx] + EntryBuffer * _Point
                   : lowBuffer[idx] - EntryBuffer * _Point;
    double stopL = isBullish
                   ? lowBuffer[idx] - SL_Pips * _Point
                   : highBuffer[idx] + SL_Pips * _Point;

    // Visualize and notify
    DrawSignal(idx, isBullish, entry, stopL);
}
5. Pattern Recognition through Divergence and Candlestick Analysis
The function FindSignalBar()plays a crucial role in identifying potential reversal signals. It scans recent bars (from 5 to 15 bars back) to detect divergence patterns. Bullish divergence is confirmed when lows are rising while RSI drops below the oversold level, indicating a potential upward reversal. Conversely, bearish divergence is when highs are falling with RSI overbought, hinting at a possible downward move.
The function also examines the latest bar for supportive candlestick patterns; pin bars and engulfing candles, known for their reversal significance. If both divergence and pattern conditions are satisfied, it returns +1 for a bullish signal or -1 for a bearish signal; if not, it returns 0, indicating no valid setup at that moment. This layered approach combines momentum divergence with price action to improve signal reliability.
int FindSignalBar()
{
    bool bullDiv = false, bearDiv = false;
    for(int i = 5; i <= 15; i++)
    {
        // Bullish divergence condition
        if(lowBuffer[i] > lowBuffer[1] && rsiBuffer[i] < rsiBuffer[1] && rsiBuffer[1] < RSI_Oversold)
            bullDiv = true;
        // Bearish divergence condition
        if(highBuffer[i] < highBuffer[1] && rsiBuffer[i] > rsiBuffer[1] && rsiBuffer[1] > RSI_Overbought)
            bearDiv = true;
    }

    // No divergence detected
    if(!bullDiv && !bearDiv)
        return 0;

    // Check for candlestick patterns supporting divergence
    bool bullPat = IsBullishPinBar(1) || IsBullishEngulfing(1);
    bool bearPat = IsBearishPinBar(1) || IsBearishEngulfing(1);

    // Confirmed signals
    if(bullDiv && bullPat)
        return +1;
    if(bearDiv && bearPat)
        return -1;

    return 0; // No valid signal
}
6. Candlestick Pattern Detection for Confirmation
These functions analyze individual candles to confirm reversal signals.IsBullishPinBar() checks if the candle has a small body with a long lower wick, indicating rejection of lower prices—a bullish reversal hint. IsBearishPinBar() does the opposite. IsBullishEngulfing() confirms if the current candle's body engulfs the previous, signaling strong buying pressure, while IsBearishEngulfing() indicates strong selling pressure. These pattern detection functions use proportional measurements of candles’ bodies and wicks relative to their high-low range to ensure only well-formed patterns are considered, reducing false positives and increasing the reliability of the signals.
// Bullish Pin Bar Pattern
bool IsBullishPinBar(int i)
{
    double body = MathAbs(openBuffer[i] - closeBuffer[i]);
    double rng  = highBuffer[i] - lowBuffer[i];
    double lw   = MathMin(openBuffer[i], closeBuffer[i]) - lowBuffer[i];
    double uw   = highBuffer[i] - MathMax(openBuffer[i], closeBuffer[i]);
    return closeBuffer[i] > openBuffer[i]
           && lw > 2.0 * body
           && uw < 0.5 * body
           && body > 0.1 * rng;
}

// Bearish Pin Bar Pattern
bool IsBearishPinBar(int i)
{
    double body = MathAbs(openBuffer[i] - closeBuffer[i]);
    double rng  = highBuffer[i] - lowBuffer[i];
    double uw   = highBuffer[i] - MathMax(openBuffer[i], closeBuffer[i]);
    double lw   = MathMin(openBuffer[i], closeBuffer[i]) - lowBuffer[i];
    return closeBuffer[i] < openBuffer[i]
           && uw > 2.0 * body
           && lw < 0.5 * body
           && body > 0.1 * rng;
}

// Bullish Engulfing Pattern
bool IsBullishEngulfing(int i)
{
    if(closeBuffer[i] <= openBuffer[i])
        return false;
    if(openBuffer[i] > closeBuffer[i+1])
        return false;
    if(closeBuffer[i] < openBuffer[i+1])
        return false;
    return true;
}

// Bearish Engulfing Pattern
bool IsBearishEngulfing(int i)
{
    if(closeBuffer[i] >= openBuffer[i])
        return false;
    if(openBuffer[i] < closeBuffer[i+1])
        return false;
    if(closeBuffer[i] > openBuffer[i+1])
        return false;
    return true;
}
7. Visualization and Alert Generation
Once a valid pattern and divergence are confirmed, DrawSignal() visualizes the setup by drawing arrows at entry points, horizontal lines for entry and stop-loss levels, and trend lines illustrating the divergence pattern. The arrow's color and code reflect the direction, greenish for bullish, red for bearish. The trend lines connect recent lows or highs to visually confirm divergence.
The function also crafts a detailed alert message including pattern type, side, symbol, time, entry, and stop-loss levels. It then triggers notifications—playing a sound, sending push notifications, or emails—according to user preferences, ensuring the trader is promptly informed and can act swiftly. This comprehensive visualization and alert system enhances situational awareness and decision-making.
void DrawSignal(int i, bool isBullish, double entry, double stopL)
{
    string tag = TimeToString(timeBuffer[i], TIME_SECONDS);
    string nameA = "Arr_" + tag;
    string nameE = "Ent_" + tag;
    string nameS = "SL_" + tag;
    string nameL = "Div_" + tag;

    color clrArr = isBullish ? clrLime : clrRed;
    int code = isBullish ? 233 : 234;

    // Arrow at entry point
    ObjectCreate(0, nameA, OBJ_ARROW, 0, timeBuffer[i], entry);
    ObjectSetInteger(0, nameA, OBJPROP_COLOR, clrArr);
    ObjectSetInteger(0, nameA, OBJPROP_ARROWCODE, code);
    ObjectSetInteger(0, nameA, OBJPROP_WIDTH, 2);

    // Horizontal lines for entry and stop-loss
    ObjectCreate(0, nameE, OBJ_HLINE, 0, 0, entry);
    ObjectSetInteger(0, nameE, OBJPROP_COLOR, clrAqua);
    ObjectCreate(0, nameS, OBJ_HLINE, 0, 0, stopL);
    ObjectSetInteger(0, nameS, OBJPROP_COLOR, clrOrangeRed);
    ObjectSetInteger(0, nameS, OBJPROP_STYLE, STYLE_DASH);

    // Divergence trend line for visual confirmation
    for(int j = i + 5; j < i + 15; j++)
    {
        if(isBullish && lowBuffer[j] > lowBuffer[i])
        {
            ObjectCreate(0, nameL, OBJ_TREND, 0,
                         timeBuffer[j], lowBuffer[j],
                         timeBuffer[i], lowBuffer[i]);
            ObjectSetInteger(0, nameL, OBJPROP_COLOR, clrDodgerBlue);
            break;
        }
        if(!isBullish && highBuffer[j] < highBuffer[i])
        {
            ObjectCreate(0, nameL, OBJ_TREND, 0,
                         timeBuffer[j], highBuffer[j],
                         timeBuffer[i], highBuffer[i]);
            ObjectSetInteger(0, nameL, OBJPROP_COLOR, clrOrange);
            break;
        }
    }

    // Construct alert message
    string pattern = isBullish
                     ? (IsBullishEngulfing(i) ? "Engulfing" : "PinBar")
                     : (IsBearishEngulfing(i) ? "Engulfing" : "PinBar");
    string side = isBullish ? "Buy" : "Sell";
    string txt = StringFormat(
                     "%s + RSI Divergence %s Signal\nSymbol: %s\nTime: %s\nEntry: %.5f\nSL: %.5f",
                     pattern, side, _Symbol,
                     TimeToString(timeBuffer[i], TIME_MINUTES),
                     entry, stopL
                 );

    // Notify trader
    Alert(txt);
    if(EnableSound)
        PlaySound("alert.wav");
    if(EnablePush)
        SendNotification(txt);
    if(EnableEmail)
        SendMail("Signal EA Alert", txt);

    Print(txt);
}
MQL5 Full EA
//+------------------------------------------------------------------+
//|                                           Multi-Pattern Signal EA|
//|                                   Copyright 2025, MetaQuotes Ltd.|
//|                           https://www.mql5.com/en/users/lynnchris|
//+------------------------------------------------------------------+
#property copyright "Copyright 2025, MetaQuotes Ltd."
#property link      "https://www.mql5.com/en/users/lynnchris"
#property version   "1.0"
#property strict

#include <Trade/Trade.mqh>

input int    RSI_Period     = 14;
input double RSI_Overbought = 70.0;
input double RSI_Oversold   = 30.0;
input double SL_Pips        = 20.0;  // in pips
input double TP_Pips        = 20.0;  // in pips
input double EntryBuffer    = 5.0;   // in points
input bool   EnableSound    = true;
input bool   EnablePush     = true;
input bool   EnableEmail    = false;

CTrade   trade;

// internal buffers
double   rsiBuffer[];
datetime timeBuffer[];
double   openBuffer[], highBuffer[], lowBuffer[], closeBuffer[];
int      rsiHandle;
datetime lastBarTime = 0;

//+------------------------------------------------------------------+
int OnInit()
  {
   rsiHandle = iRSI(_Symbol, _Period, RSI_Period, PRICE_CLOSE);
   if(rsiHandle == INVALID_HANDLE)
      return INIT_FAILED;

   ArraySetAsSeries(rsiBuffer,   true);
   ArraySetAsSeries(timeBuffer,  true);
   ArraySetAsSeries(openBuffer,  true);
   ArraySetAsSeries(highBuffer,  true);
   ArraySetAsSeries(lowBuffer,   true);
   ArraySetAsSeries(closeBuffer, true);

   return INIT_SUCCEEDED;
  }

//+------------------------------------------------------------------+
void OnTick()
  {
   if(Bars(_Symbol,_Period) < 20)
      return;

   if(CopyTime(_Symbol,_Period,0,20,timeBuffer)   <= 0 ||
      CopyOpen(_Symbol,_Period,0,20,openBuffer)   <= 0 ||
      CopyHigh(_Symbol,_Period,0,20,highBuffer)   <= 0 ||
      CopyLow(_Symbol,_Period,0,20,lowBuffer)     <= 0 ||
      CopyClose(_Symbol,_Period,0,20,closeBuffer) <= 0)
      return;

   if(timeBuffer[1] == lastBarTime)
      return;
   lastBarTime = timeBuffer[1];

   if(CopyBuffer(rsiHandle,0,0,20,rsiBuffer) <= 0)
      return;

   int dir = FindSignalBar();
   if(dir == 0)
      return;

   int idx = 1;
   bool isBullish = (dir > 0);

   double entry = isBullish
                  ? highBuffer[idx] + EntryBuffer * _Point
                  : lowBuffer[idx]  - EntryBuffer * _Point;
   double stopL = isBullish
                  ? lowBuffer[idx]  - SL_Pips * _Point
                  : highBuffer[idx] + SL_Pips * _Point;

   DrawSignal(idx, isBullish, entry, stopL);
  }

//+------------------------------------------------------------------+
int FindSignalBar()
  {
   bool bullDiv = false, bearDiv = false;
   for(int i = 5; i <= 15; i++)
     {
      if(lowBuffer[i] > lowBuffer[1] && rsiBuffer[i] < rsiBuffer[1] && rsiBuffer[1] < RSI_Oversold)
         bullDiv = true;
      if(highBuffer[i] < highBuffer[1] && rsiBuffer[i] > rsiBuffer[1] && rsiBuffer[1] > RSI_Overbought)
         bearDiv = true;
     }
   if(!bullDiv && !bearDiv)
      return 0;

   bool bullPat = IsBullishPinBar(1) || IsBullishEngulfing(1);
   bool bearPat = IsBearishPinBar(1) || IsBearishEngulfing(1);

   if(bullDiv && bullPat)
      return +1;
   if(bearDiv && bearPat)
      return -1;
   return 0;
  }

//+------------------------------------------------------------------+
bool IsBullishPinBar(int i)
  {
   double body = MathAbs(openBuffer[i] - closeBuffer[i]);
   double rng  = highBuffer[i] - lowBuffer[i];
   double lw   = MathMin(openBuffer[i], closeBuffer[i]) - lowBuffer[i];
   double uw   = highBuffer[i] - MathMax(openBuffer[i], closeBuffer[i]);
   return closeBuffer[i] > openBuffer[i]
          && lw > 2.0 * body
          && uw < 0.5 * body
          && body > 0.1 * rng;
  }

//+------------------------------------------------------------------+
//|                                                                  |
//+------------------------------------------------------------------+
bool IsBearishPinBar(int i)
  {
   double body = MathAbs(openBuffer[i] - closeBuffer[i]);
   double rng  = highBuffer[i] - lowBuffer[i];
   double uw   = highBuffer[i] - MathMax(openBuffer[i], closeBuffer[i]);
   double lw   = MathMin(openBuffer[i], closeBuffer[i]) - lowBuffer[i];
   return closeBuffer[i] < openBuffer[i]
          && uw > 2.0 * body
          && lw < 0.5 * body
          && body > 0.1 * rng;
  }

//+------------------------------------------------------------------+
//|                                                                  |
//+------------------------------------------------------------------+
bool IsBullishEngulfing(int i)
  {
   if(closeBuffer[i] <= openBuffer[i])
      return false;
   if(openBuffer[i]  > closeBuffer[i+1])
      return false;
   if(closeBuffer[i] < openBuffer[i+1])
      return false;
   return true;
  }

//+------------------------------------------------------------------+
//|                                                                  |
//+------------------------------------------------------------------+
bool IsBearishEngulfing(int i)
  {
   if(closeBuffer[i] >= openBuffer[i])
      return false;
   if(openBuffer[i]  < closeBuffer[i+1])
      return false;
   if(closeBuffer[i] > openBuffer[i+1])
      return false;
   return true;
  }

//+------------------------------------------------------------------+
void DrawSignal(int i, bool isBullish, double entry, double stopL)
  {
   string tag   = TimeToString(timeBuffer[i], TIME_SECONDS);
   string nameA = "Arr_" + tag;
   string nameE = "Ent_" + tag;
   string nameS = "SL_"  + tag;
   string nameL = "Div_" + tag;

   color clrArr = isBullish ? clrLime : clrRed;
   int   code   = isBullish ? 233 : 234;

   ObjectCreate(0, nameA, OBJ_ARROW, 0, timeBuffer[i], entry);
   ObjectSetInteger(0, nameA, OBJPROP_COLOR, clrArr);
   ObjectSetInteger(0, nameA, OBJPROP_ARROWCODE, code);
   ObjectSetInteger(0, nameA, OBJPROP_WIDTH, 2);

   ObjectCreate(0, nameE, OBJ_HLINE, 0, 0, entry);
   ObjectSetInteger(0, nameE, OBJPROP_COLOR, clrAqua);
   ObjectCreate(0, nameS, OBJ_HLINE, 0, 0, stopL);
   ObjectSetInteger(0, nameS, OBJPROP_COLOR, clrOrangeRed);
   ObjectSetInteger(0, nameS, OBJPROP_STYLE, STYLE_DASH);

   for(int j = i + 5; j < i + 15; j++)
     {
      if(isBullish && lowBuffer[j] > lowBuffer[i])
        {
         ObjectCreate(0, nameL, OBJ_TREND, 0,
                      timeBuffer[j], lowBuffer[j],
                      timeBuffer[i], lowBuffer[i]);
         ObjectSetInteger(0, nameL, OBJPROP_COLOR, clrDodgerBlue);
         break;
        }
      if(!isBullish && highBuffer[j] < highBuffer[i])
        {
         ObjectCreate(0, nameL, OBJ_TREND, 0,
                      timeBuffer[j], highBuffer[j],
                      timeBuffer[i], highBuffer[i]);
         ObjectSetInteger(0, nameL, OBJPROP_COLOR, clrOrange);
         break;
        }
     }

   string pattern = isBullish
                    ? (IsBullishEngulfing(i) ? "Engulfing" : "PinBar")
                    : (IsBearishEngulfing(i) ? "Engulfing" : "PinBar");
   string side    = isBullish ? "Buy" : "Sell";
   string txt     = StringFormat(
                       "%s + RSI Divergence %s Signal\nSymbol: %s\nTime: %s\nEntry: %.5f\nSL: %.5f",
                       pattern, side, _Symbol,
                       TimeToString(timeBuffer[i], TIME_MINUTES),
                       entry, stopL
                    );

   Alert(txt);
   if(EnableSound)
      PlaySound("alert.wav");
   if(EnablePush)
      SendNotification(txt);
   if(EnableEmail)
      SendMail("Signal EA Alert", txt);
   Print(txt);
  }
//+------------------------------------------------------------------+
Backtesting and Results
Backtesting is a process that involves evaluating a trading strategy using historical market data to estimate how it would have performed in the past. This simulation allows traders to see how their predefined rules would have worked under actual market conditions, providing insight into potential profitability and risks. By analyzing the results of these simulated trades, traders can make informed decisions about whether to implement the strategy in live trading.
The first step in backtesting is to define the trading strategy clearly. This involves establishing specific rules for entering and exiting trades, including the indicators, price patterns, or other conditions that will trigger buy or sell signals. A well-defined strategy ensures consistent testing and accurate results. Next, traders need to gather relevant historical data, such as price charts, volume, and other pertinent information for the period they wish to analyze. Accurate and comprehensive data is essential for reliable backtesting outcomes.
Choosing the right backtesting platform is crucial. There are various software tools available, some that allow manual analysis and others that support fully automated testing. The selected platform should be capable of accurately simulating trades based on your strategy rules and providing detailed performance metrics. Once the platform is selected, the trader must set up the backtesting environment. This includes configuring parameters such as timeframes, transaction costs, slippage, and other factors that can influence performance, ensuring the simulation reflects real trading conditions as closely as possible.
After setup, the next step is to apply the strategy by running the backtest. The platform then generates simulated trades according to your predefined rules and the historical market data. During this process, it’s important to analyze the results thoroughly. Key metrics such as total profit or loss, win rate, maximum drawdown, and risk-reward ratios provide valuable insights into the strategy's effectiveness and robustness.
Based on the analysis, traders should refine and optimize their strategy. Adjustments to parameters or rules can improve performance and help address any weaknesses identified during testing. To ensure the strategy’s reliability and avoid overfitting, it’s essential to validate it with out-of-sample data. Running the refined strategy on a separate set of historical data helps confirm its robustness and its potential to perform well in live markets.
Below are the results from my backtesting.
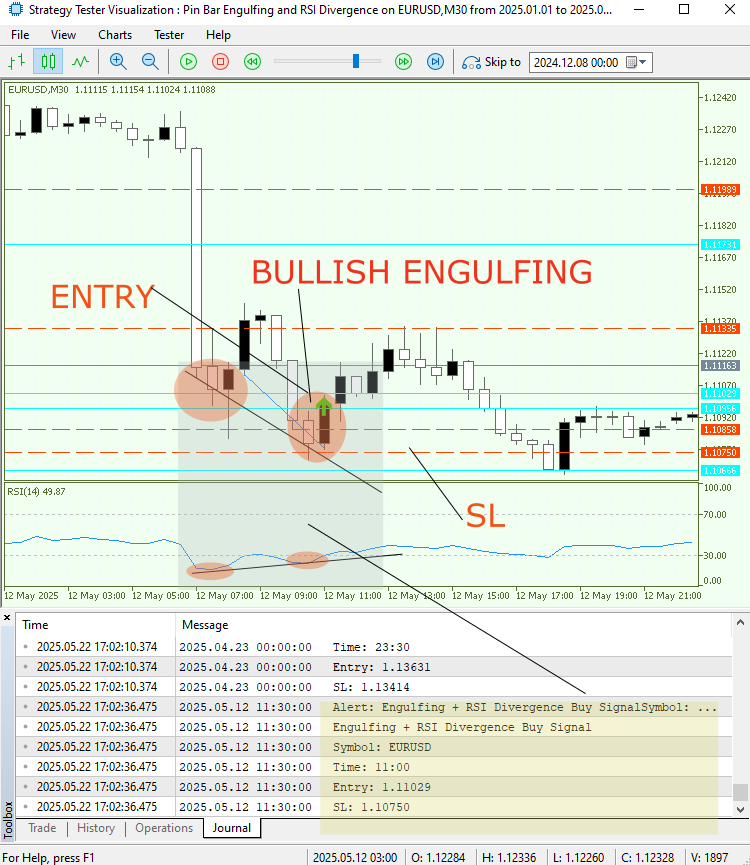
Fig. 6. Bullish Engulfing Confirmation
The figure above (Fig 6) illustrates a screenshot from the backtesting of EURUSD on the M30 timeframe, showing a bullish engulfing pattern that was confirmed by a bullish divergence.
Fig. 7. USDCHF Backtesting
The figure above (Fig. 7) illustrates a screenshot from the backtesting of USDCHF on the M30 timeframe, showing a bullish engulfing pattern confirmed by a bullish divergence. Furthermore, below is a GIF demonstrating the backtesting process on the USDCHF pair, highlighting how several signals were identified.
Conclusion
This EA exemplifies an advanced approach to pattern recognition and divergence detection within a trading strategy. By combining technical indicators like RSI with candlestick pattern analysis, such as pin bars and engulfing patterns, it effectively identifies high-probability reversal signals. The EA's modular design allows it to analyze recent market data in real-time, generate visual signals on the chart, and send timely alerts, making it a valuable tool for traders seeking systematic and disciplined entries.
Backtesting results demonstrate that the EA can achieve high win rates, especially when signals are confirmed by multiple criteria. However, as with any automated strategy, it is crucial to validate its robustness across different currency pairs and market conditions through out-of-sample testing. Proper parameter optimization and risk management are essential to maximize profitability and mitigate drawdowns. Overall, this EA showcases the potential of combining pattern recognition with divergence analysis, laying a solid foundation for further machine learning integration and intelligent decision-making in trading systems.
| Date | Tool Name | Description | Version | Updates | Notes |
|---|---|---|---|---|---|
| 01/10/24 | Chart Projector | Script to overlay the previous day's price action with a ghost effect. | 1.0 | Initial Release | Tool number 1 |
| 18/11/24 | Analytical Comment | It provides previous day's information in a tabular format, as well as anticipates the future direction of the market. | 1.0 | Initial Release | Tool number 2 |
| 27/11/24 | Analytics Master | Regular Update of market metrics after every two hours | 1.01 | Second Release | Tool number 3 |
| 02/12/24 | Analytics Forecaster | Regular Update of market metrics after every two hours with telegram integration | 1.1 | Third Edition | Tool number 4 |
| 09/12/24 | Volatility Navigator | The EA analyzes market conditions using the Bollinger Bands, RSI and ATR indicators | 1.0 | Initial Release | Tool Number 5 |
| 19/12/24 | Mean Reversion Signal Reaper | Analyzes market using mean reversion strategy and provides signal | 1.0 | Initial Release | Tool number 6 |
| 9/01/25 | Signal Pulse | Multiple timeframe analyzer | 1.0 | Initial Release | Tool number 7 |
| 17/01/25 | Metrics Board | Panel with button for analysis | 1.0 | Initial Release | Tool number 8 |
| 21/01/25 | External Flow | Analytics through external libraries | 1.0 | Initial Release | Tool number 9 |
| 27/01/25 | VWAP | Volume Weighted Average Price | 1.3 | Initial Release | Tool number 10 |
| 02/02/25 | Heikin Ashi | Trend Smoothening and reversal signal identification | 1.0 | Initial Release | Tool number 11 |
| 04/02/25 | FibVWAP | Signal generation through python analysis | 1.0 | Initial Release | Tool number 12 |
| 14/02/25 | RSI DIVERGENCE | Price action versus RSI divergences | 1.0 | Initial Release | Tool number 13 |
| 17/02/25 | Parabolic Stop and Reverse (PSAR) | Automating PSAR strategy | 1.0 | Initial Release | Tool number 14 |
| 20/02/25 | Quarters Drawer Script | Drawing quarters levels on chart | 1.0 | Initial Release | Tool number 15 |
| 27/02/25 | Intrusion Detector | Detect and alert when price reaches quarters levels | 1.0 | Initial Release | Tool number 16 |
| 27/02/25 | TrendLoom Tool | Multi timeframe analytics panel | 1.0 | Initial Release | Tool number 17 |
| 11/03/25 | Quarters Board | Panel with buttons to activate or disable quarters levels | 1.0 | Initial Release | Tool number 18 |
| 26/03/25 | ZigZag Analyzer | Drawing trendlines using ZigZag Indicator | 1.0 | Initial Release | Tool number 19 |
| 10/04/25 | Correlation Pathfinder | Plotting currency correlations using Python libraries. | 1.0 | Initial Release | Tool number 20 |
| 23/04/25 | Market Structure Flip Detector Tool | Market structure flip detection | 1.0 | Initial Release | Tool number 21 |
| 08/05/25 | Correlation Dashboard | Relationship between different pairs | 1.0 | Initial Release | Tool number 22 |
| 13/05/25 | Currency Strength Meter | measuring the strength of each currency across pairs | 1.0 | Initial Release | Tool number 23 |
| 21/05/25 | PAQ Analysis Tool | Candlestick formation detector | 1.0 | Initial Release | Tool number 24 |
| 23/05/25 | Pin bar, Engulfing and RSI divergence | Using RSI Divergence to confirm Pin bar and engulfing patterns signals | 1.0 | Initial Release | Tool number 25 |
Warning: All rights to these materials are reserved by MetaQuotes Ltd. Copying or reprinting of these materials in whole or in part is prohibited.
This article was written by a user of the site and reflects their personal views. MetaQuotes Ltd is not responsible for the accuracy of the information presented, nor for any consequences resulting from the use of the solutions, strategies or recommendations described.

- Free trading apps
- Over 8,000 signals for copying
- Economic news for exploring financial markets
You agree to website policy and terms of use