
Price Action Analysis Toolkit Development (Part 49): Integrating Trend, Momentum, and Volatility Indicators into One MQL5 System

Contents
- Introduction
- Understanding Indicators
- Strategy Overview
- MQL5 Implementation
- Testing and Outcomes
- Conclusion
Introduction
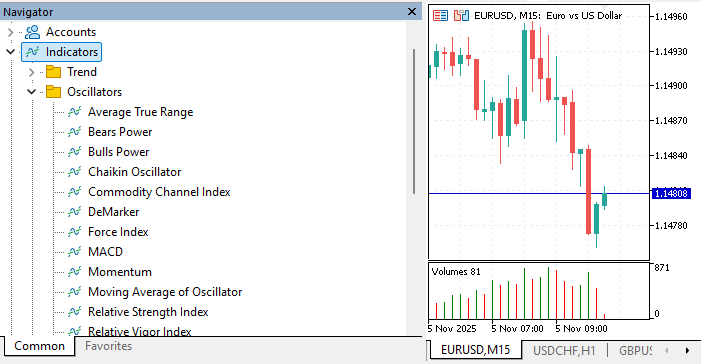
In every trader’s analytical process, technical indicators play a central role in identifying trends, gauging momentum, and pinpointing potential entry or exit points. Yet in MetaTrader 5, applying multiple indicators to a single chart often means repeatedly navigating through the Indicators tree, locating each tool, and manually attaching them one by one. While that’s manageable for two or three indicators, it quickly becomes tedious for a full multi‑indicator analysis. For new users, this is doubly frustrating because they must remember which sub‑folder a given indicator resides in, and also waste time hunting for the same indicators over and over. Each addition is another interruption in the workflow, and it’s easy to lose focus on actual market interpretation.
The diagram below illustrates how to navigate through MetaTrader 5 to locate and access various indicators.

This article introduces an MQL5 Expert Advisor that automates and streamlines this process by
- Automatically listing key indicators directly on the chart.
- Providing a unified overview of the most important technical measures—grouped into Trend, Momentum, and Volatility.
- Interpreting indicator values in real time and generating a combined bias: Buy, Sell, or Neutral.
- Presenting directional arrows and color coding for instant visual interpretation of prevailing market sentiment.
The dashboard updates continuously without the need to open multiple indicator windows or swap chart templates, keeping all analysis in one clean view. Unlike traditional approaches that rely on separate subwindows or multiple indicator attachments, this system integrates all essential analytical components into a single, interactive interface. You can toggle profiles to focus on just trend‑based tools, momentum oscillators, or volatility measures—or view them all together. With Hide All and Show All controls, you can declutter the chart in a single click and restore the full dashboard just as easily. The result is a control center for technical analysis, where the chart itself becomes the workspace. Traders can move from raw indicator data to actionable decisions in seconds, without detouring into the Indicators folder or manually reconstructing complex setups. In the sections that follow, we’ll explore the individual indicators used, the strategy logic behind the combined signal, and the MQL5 implementation that makes it work live on your chart.
Understanding Indicators
To form a reliable view of market conditions, traders often rely on more than one type of technical indicator. Each indicator offers a unique perspective: some are designed to highlight the prevailing trend, others to measure the speed and strength of price movement, and others still to quantify volatility. By combining these different perspectives, it becomes possible to create a richer, more reliable market analysis, rather than depending on a single tool. In the Multi Indicator Handler system, this diversity of inputs is organized into three main groups: trend, momentum, and volatility.
Trend Indicators
Trend indicators are the foundation of directional analysis. They reveal whether the market is generally moving up, down, or sideways, and form the primary context for most trading decisions. In this system, the EMA 50 serves as a fast‑reacting moving average for medium‑term trend detection, while the EMA 200 acts as a longer‑term bias filter—with price above the EMA 200 signaling bullish conditions, and price below it signaling bearish sentiment.

Complementing these averages is the ADX 14, which measures the strength of the current trend regardless of its direction. A rising ADX, especially above the commonly watched level of 25, typically indicates that the market is trending strongly.
Momentum Indicators
Momentum indicators, in contrast, focus on direction, the speed, and the force of price movement. The system employs two RSI readings, with periods 14 and 28, to detect overbought and oversold conditions over different horizons. The MACD (12,26,9) adds a layer of crossover‑based momentum analysis drawn from the relationship between two EMAs, while the Stochastic Oscillator (5,3) measures current price relative to its recent range and is highly sensitive to turning points. The Momentum 14 indicator expresses price acceleration in absolute terms, with readings above 100 suggesting upside force and below 100 indicating downside pressure.
The CCI 20 detects deviations from statistical norms, often signaling exhaustion points, while the Williams %R 14 offers a fast‑acting overbought/oversold reading similar to Stochastic but on a different scale. Together, these momentum tools show when a trend is likely to extend or reverse.
Volatility Indicators
The final group, volatility indicators, focuses on how much the market is actually moving. ATR 14 measures the average true range of price over the set period, with increases implying expanded ranges and a more active market. Bollinger Bands (20,2) wrap a moving average with upper and lower bands based on standard deviations, visually capturing periods where price stretches beyond its typical range—behavior that often precedes reversals or volatility spikes. While volatility indicators do not directly predict direction, they provide essential context for risk management and optimal trade timing.
By grouping indicators according to their analytical roles, the Multi Indicator Handler offers two major advantages. First, it allows traders to switch profiles to focus only on trend‑based tools, momentum oscillators, or volatility measures, depending on the immediate question they need answered. Second, it enables weighted decision‑making in the combined bias calculation: trend indicators carry the greatest influence, momentum plays a supporting role, and volatility has the least weight. This reflects their practical importance in determining directional bias while still incorporating the broader context of market dynamics.
In the next section, Strategy Overview, we will connect these indicator groups to the system’s voting logic. You will see how their individual signals are transformed into a single BUY, SELL, or NEUTRAL recommendation and how the interactive dashboard design makes this information instantly accessible for decision‑making.
Strategy Overview
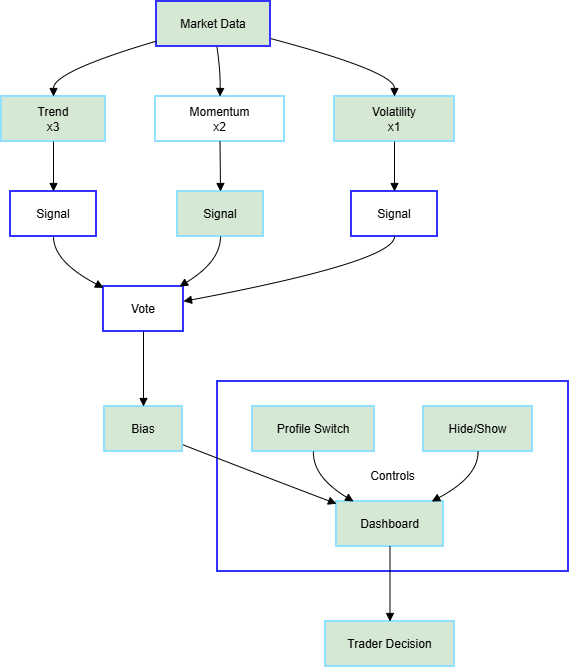
With the indicators grouped into Trend, Momentum, and Volatility, the next step is to transform their individual readings into a unified trading signal. The Multi Indicator Handler applies a structured voting system in which each indicator generates its own bias—Buy, Sell, or Neutral—based on predefined conditions. For example, a rising EMA slope might add a Buy vote, a falling RSI below 30 might add a Buy vote, and an overbought Stochastic might add a Sell vote. Each of these votes is assigned a weight according to the indicator’s group: trend indicators carry the highest influence, reflecting their foundational role in market direction; momentum indicators exert moderate influence; and volatility indicators contribute a lighter weight, providing contextual input rather than overriding directional calls.
The system continuously updates these signals in real time using the OnTimer event. This approach offers smoother and more powerful control than relying on OnTick alone, which can be inconsistent in lower‑volatility markets. Every update cycle, each indicator’s buffer is read—often just for the most recent bar—and interpreted using straightforward logic tailored to that tool’s role. As soon as each group’s weighted signals are tallied, the EA computes the Overall Bias, producing a single directional output: BUY, SELL, or NEUTRAL. This result is displayed prominently on the chart with color‑coded text so traders can identify market sentiment at a glance without scanning multiple subwindows.
A key design feature of the Multi Indicator Handler is its profile switching mechanism. Traders can toggle between four profile modes: ALL, which displays every indicator in the dashboard; TREND, which isolates only trend‑based tools; MOMENTUM, which limits the view to oscillators and momentum measures; and VOL, which focuses on volatility metrics. This functionality allows the trader to zero in on the type of analysis most relevant to their strategy at any given moment. For example, before entering a trade, a trader might select the Momentum profile to confirm that the setup has sufficient force behind it; while managing an open trade, they might keep the Trend profile active to ensure the core trend remains intact.
To complement profile switching, the EA includes two critical workspace controls: Hide All and Show All. Clicking Hide All instantly clears the chart of all indicator objects except for the two control buttons, providing an unobstructed view of price action. Clicking Show All rebuilds the dashboard in its entirety for the active profile, restoring a fully functional analysis environment without manual reconfiguration. This dynamic chart control improves clarity during high‑volatility moments and allows for quick pivots between pure price reading and detailed multi‑indicator confirmation.
The strategy’s logic is intentionally modular. Each indicator’s interpretation is self‑contained within the system, meaning traders can easily swap in new tools, adjust signal conditions, or modify weightings without breaking the dashboard’s core functions. Group voting ensures no single rogue reading dominates the bias, and the overall weighting scheme can be fine‑tuned to fit different risk tolerances or trading styles. In short, the Multi Indicator Handler is built to feed traders clear, synthesized market sentiment while maintaining maximum flexibility and speed in live environments.
In the next section, MQL5 Implementation, we’ll break down how this voting system, profile control, and chart‑based interface are coded—moving from design logic into the actual functions, event handling, and object creation that make this tool work.
MQL5 Implementation
The Multi Indicator Handler Expert Advisor serves as both an analytical engine and a visual interface for trading charts in MetaTrader 5. Its design allows it to collect and interpret data from multiple technical indicators, then display these readings in an interactive dashboard directly on the chart. What makes it effective is the way the code separates its core roles: data acquisition, signal interpretation, and graphical display.
Program Header and Input Parameters
The file begins with a header that includes author details, version number, copyright notice, and a link to your MQL5 profile. Beneath that, we find the #property directives—these dictate compilation rules and metadata, which later appear in the MetaTrader Navigator. Two simple but crucial input variables are next. InpTF sets the timeframe for internal calculations. It defaults to PERIOD_CURRENT, but can be changed to analyze data across timeframes, such as viewing 1‑hour chart data while applying daily indicator logic. InpUpdateMs is the update timer, set in milliseconds; this ensures the dashboard refreshes at a consistent rhythm, independent of market tick volume.
#property version   "1.0"
#property strict
input ENUM_TIMEFRAMES InpTF = PERIOD_CURRENT;
input int InpUpdateMs = 600;

#define SIG_NEUTRAL 0
#define SIG_BUY     1
#define SIG_SELL   -1
To represent analysis signals programmatically, the constants SIG_BUY, SIG_SELL, and SIG_NEUTRAL are declared. Their integer values will later be used in summing and weighting votes from individual indicators.
Profile Modes via Enumeration
An enum called ProfileType defines the four profile modes for the dashboard: ALL, TREND, MOMENTUM, and VOL. This allows intuitive switching between modes during runtime. A global variable, currentProfileholds the mode currently visible.
enum ProfileType { PROFILE_ALL, PROFILE_TREND, PROFILE_MOMENTUM, PROFILE_VOL };
ProfileType currentProfile = PROFILE_ALL;

struct IndicatorSlot {
   string id;
   string name;
   int    handle;
   int    group;      // 0=Trend,1=Momentum,2=Volatility
   string btnName;
   string lblName;
};
Rather than using raw integers for modes, the enumeration ensures the code remains self‑documenting. Reading PROFILE_TREND in code instantly tells a developer or trader what kind of indicators are being shown.
IndicatorSlot Data Structure
Every indicator is represented by an IndicatorSlot structure. This packs together five key properties:
- An internal id, e.g., "EMA50".
- A user‑friendly name, like EMA 50.
- An MQL5 handle returned by functions such as iMA or iRSI.
- A group number indicating Trend, Momentum, or Volatility category.
- Object names (btnName and lblName) for the button and label associated with the indicator.
Grouping these into a structure makes high‑level code simpler to maintain and extend. This way, you don’t need separate arrays for every property, a single slot carries all related data for a given indicator.
Global Arrays for Values and Signals
Alongside the structure, three dynamic arrays keep track of each indicator’s state:
- values[]: latest numeric reading from the indicator’s buffers.
- signals[]: interpreted signal (+1 for Buy, -1 for Sell, 0 for Neutral).
- histValues[50][10]: simple history storing the last 10 readings for up to 50 indicators. These support “sparkline” mini‑trends drawn next to each label.
IndicatorSlot slots[];
double values[];
int signals[];
double histValues[50][10];
This design means each slot has multiple associated datasets that can be updated independently without disrupting the others.
Utility Functions
The EA’s first helper function, ObjExists(), is a safeguard—checking if a chart object exists before creating or deleting it. Without this, attempting to recreate a present object can cause visual glitches or overwrite styles unexpectedly.
bool ObjExists(const string name) {
    return(ObjectFind(0,name)!=-1);
}
The second helper, AddSlot(), handles all array resizing and initialization needed for adding indicators. It sets default signal states to neutral, wipes the sparkline history, and assigns consistent object names with a button and label prefix.
Centralizing Indicator Handle Creation
The function CreateIndicators() is where the EA defines which indicators to include.
void CreateIndicators() {
   ArrayResize(slots,0);
   ArrayResize(values,0);
   ArrayResize(signals,0);

   // Trend
   AddSlot("EMA50","EMA 50", iMA(Symbol(),InpTF,50,0,MODE_EMA,PRICE_CLOSE),0);
   AddSlot("EMA200","EMA 200", iMA(Symbol(),InpTF,200,0,MODE_EMA,PRICE_CLOSE),0);
   AddSlot("ADX14","ADX 14", iADX(Symbol(),InpTF,14),0);

   // Momentum
   AddSlot("RSI14","RSI 14", iRSI(Symbol(),InpTF,14,PRICE_CLOSE),1);
   ...
   // Volatility
   AddSlot("ATR14","ATR 14", iATR(Symbol(),InpTF,14),2);
   AddSlot("BB20","Boll 20,2", iBands(Symbol(),InpTF,20,0,2.0,PRICE_CLOSE),2);
}
It starts by clearing all arrays, then calls AddSlot() for each tool. Built‑in MQL5 functions like iMA, iADX, iRSI, iMACD, and others create indicator handles, which are numeric IDs linking the EA to internal MetaTrader calculations stored in buffers.
void AddSlot(string id,string name,int handle,int group) {
   int n=ArraySize(slots);
   ArrayResize(slots,n+1);
   ArrayResize(values,n+1);
   ArrayResize(signals,n+1);
   slots[n].id=id;
   slots[n].name=name;
   slots[n].handle=handle;
   slots[n].group=group;
   slots[n].btnName="btn_"+id;
   slots[n].lblName="lbl_"+id;
   signals[n]=SIG_NEUTRAL;
   values[n]=0.0;
   for(int j=0;j<10;j++) histValues[n][j]=0.0;
}
Indicators are grouped numerically according to their analytical role: Trend = 0, Momentum = 1, Volatility = 2. This group number is later crucial for both filtering (profile view) and applying weights during signal aggregation.
Creating the Chart Panel
The BuildPanel() function oversees drawing the dashboard. For each slot in the active profile, it creates
- A button showing the indicator’s name.
- A label ready to show its value and signal bias.
- A sparkline to give a miniature visual of recent direction.
Objects are laid out vertically using a starting Y offset and a constant spacing. At the end of the list, an “Overall” bias label is drawn, and a profileBtn is created at the top right for switching profiles.
void BuildPanel(ProfileType filter) {
   int y=38, spacing=26;

   for(int i=0; i<ArraySize(slots); i++) {
      if(filter==PROFILE_ALL || slots[i].group==(int)filter) {
         ObjectCreate(0,slots[i].btnName,OBJ_BUTTON,0,0,0);
         ObjectSetString(0,slots[i].btnName,OBJPROP_TEXT,slots[i].name);

         ObjectCreate(0,slots[i].lblName,OBJ_LABEL,0,0,0);
         ObjectSetString(0,slots[i].lblName,OBJPROP_TEXT,"Val: -- Sig: NEUTRAL");

         string spName="spark_"+slots[i].id;
         ObjectCreate(0,spName,OBJ_TREND,0,0,0);

         y += spacing;
      }
   }
}
Using chart objects like OBJ_BUTTON and OBJ_LABEL means the interface can be interactive, responding to clicks and styled for clarity, without relying on multiple indicator windows.
Rebuilding the Dashboard
When profile modes change or the Show All control is pressed, ShowDashboard() runs. It first deletes all objects except the Hide and Show buttons. It then ensures those two buttons exist by recreating them if they don’t. With controls secure, it calls BuildPanel() to repopulate the indicator UI for the chosen profile.
void ShowDashboard(ProfileType filter) {
   int total=ObjectsTotal(0,0,-1);
   for(int i=total-1;i>=0;i--) {
      string name=ObjectName(0,i);
      if(name!="btn_hide" && name!="btn_show")
         ObjectDelete(0,name);
   }
   // Ensure control buttons exist
   if(!ObjExists("btn_hide")) { /* create btn_hide */ }
   if(!ObjExists("btn_show")) { /* create btn_show */ }

   BuildPanel(filter);
}
This pattern protects against losing core controls mid‑session and keeps dashboard rebuilds clean.
Signal Interpretation per Indicator
The InterpretIndicator() function is where technical readings gain meaning. It uses each indicator’s handle to pull values with CopyBuffer(). Then, depending on the indicator type, it applies logical rules:
- EMA: Slope between bars decides buy/sell bias.
- ADX: A value above 25 signals trending conditions.
- RSI: Above 70 and falling indicates sell, and below 30 and rising indicates buy.
- MACD: Above zero for buy, below zero for sell.
- Stochastic, Momentum, CCI, and Williams %R each use their characteristic thresholds.
- ATR and Bollinger Bands return volatility info without directly influencing direction.
void InterpretIndicator(int i) {
   double buf[];
   signals[i]=SIG_NEUTRAL;

   if(slots[i].id=="EMA50"||slots[i].id=="EMA200") {
      if(CopyBuffer(slots[i].handle,0,0,2,buf)>=2) {
         double slope=buf[0]-buf[1];
         if(slope>0) signals[i]=SIG_BUY;
         else if(slope<0) signals[i]=SIG_SELL;
      }
   }
   ...
}
Signals are set to +1, -1, or 0 accordingly.
Updating Slots and Drawing Sparklines
Every timer cycle, UpdateSlot() recalculates an indicator’s signal, shifts its historical values, updates the label’s text and color, and calls DrawSparkline().
void UpdateSlot(int i) {
   InterpretIndicator(i);
   for(int j=9;j>0;j--) histValues[i][j]=histValues[i][j-1];
   histValues[i][0]=values[i];

   string sigText=(signals[i]==SIG_BUY?"BUY":signals[i]==SIG_SELL?"SELL":"NEUTRAL");
   ObjectSetString(0,slots[i].lblName,OBJPROP_TEXT,
                   StringFormat("Val: %.5g  Sig: %s",values[i],sigText));

   DrawSparkline(i);
}
DrawSparkline() uses two points, recent and the oldest value, mapped in time coordinates to draw a simple OBJ_TREND line. Even though minimal, this gives at‑a‑glance direction context.
Computing Overall Bias
ComputeOverall() loops through all slots, multiplies each signal by its group weight (Trend × 3, Momentum × 2, Volatility × 1), and sums the results. The sign of this sum decides the overall bias: positive is BUY, negative is SELL, and zero is NEUTRAL.
int ComputeOverall() {
   int vote=0;
   for(int i=0;i<ArraySize(slots);i++) {
      int w=(slots[i].group==0?3:(slots[i].group==1?2:1));
      vote+=signals[i]*w;
   }
   if(vote>0) return SIG_BUY;
   if(vote<0) return SIG_SELL;
   return SIG_NEUTRAL;
}
DrawOverallSignal() updates the “Overall” label text and applies green, red, or grey accordingly.
Profile Switching and Controls
NextProfile() cycles through modes sequentially and calls ShowDashboard() each time. HideEverythingExceptButtons() deletes everything but the Hide and Show controls, offering an uncluttered price view at the click of a button.
Lifecycle Events and Timed Updates
In OnInit(), indicators are created, the initial dashboard is built, and a millisecond timer is started to run updates via OnTimer().
int OnInit() {
   CreateIndicators();
   ShowDashboard(currentProfile);
   EventSetMillisecondTimer((uint)MathMax(200,(int)InpUpdateMs));
   return INIT_SUCCEEDED;
}
OnDeinit() stops the timer and deletes all chart objects to clean up after removal.
OnTimer: The Update Loop
This function runs each time the timer ticks. It updates all indicators belonging to the active profile, recalculates the overall bias, and refreshes the display if anything changes.
void OnTimer() {
   for(int i=0;i<ArraySize(slots);i++)
      if(currentProfile==PROFILE_ALL || slots[i].group==(int)currentProfile)
         UpdateSlot(i);

   int ov=ComputeOverall();
   DrawOverallSignal(ov);
}
Because it’s timer‑based, updates stay regular even without incoming ticks—ensuring consistent responsiveness.
Responding to User Actions
OnChartEvent() listens for clicks. Clicking the profile button calls NextProfile(). Clicking Hide All calls HideEverythingExceptButtons(); Show All rebuilds the dashboard via ShowDashboard(currentProfile).
void OnChartEvent(..., const string &sparam) {
   if(sparam=="profileBtn") NextProfile();
   if(sparam=="btn_hide")   HideEverythingExceptButtons();
   if(sparam=="btn_show")   ShowDashboard(currentProfile);
}
OnTick: Reserved for Future Use
Currently empty, OnTick() could be expanded later to add automated trading routines based on the computed bias—for example, opening positions when Overall Bias turns BUY and closing them when it turns NEUTRAL or SELL.
By separating tasks—creation, interpretation, UI building, and updating—the EA remains clean, adaptable, and efficient. It’s easy to add indicators, change weights, or redesign the layout without rewriting fundamental logic.
Testing and Outcomes
After compiling and attaching the Multi Indicator Handler to any chart in MetaTrader 5, the interface loads instantly, blending smoothly with the chart environment. At the upper-left corner, two small control buttons labeled Hide All and Show All provide quick access to manage the dashboard’s visibility, while on the upper-right, a profile selector labeled Profile: ALL allows switching between different indicator groups for focused analysis. Just below these controls, a clean, vertically aligned dashboard lists all configured indicators, each displaying its name, real-time numeric value, and interpreted signal—clearly identifying whether the condition favors a Buy, Sell, or Neutral bias.
Visual Behavior
Each indicator updates automatically according to the selected timeframe and the timer interval set by InpUpdateMs. Color changes are immediate: green signifies a Buybias, red a Sell bias, and grey a Neutral reading. Every indicator also shows a tiny spark lined trend line to the right, a subtle way to show whether values have been rising or falling recently. Over time, you can see momentum indicators pulse between red and green, while slower‑moving trend indicators stay steady, reflecting the real market stability.
An example piece of the update process inside OnTimer() looks like this:
for(int i=0;i<ArraySize(slots);i++) {
   if(currentProfile==PROFILE_ALL || slots[i].group==(int)currentProfile)
         UpdateSlot(i);
}
Even under constant motion, this loop maintains visual smoothness, showing the EA handles updates efficiently without freezing or flickering objects.
Profile Switching in Action
Clicking the Profile button cycles through ALL, TREND, MOMENTUM, and VOL modes. The dashboard instantly rebuilds, displaying only the indicators relevant to that category. This is especially helpful when switching analytical views: during trend exploration you might choose TREND, limiting output to moving averages and ADX; when observing potential entry timing you might select MOMENTUM to see RSI, MACD, and Stochastic readings.
Internally, the logic for this behavior is simple:
void NextProfile() {
   int tmp=(int)currentProfile;
   tmp++;
   if(tmp>3) tmp=0;
   currentProfile=(ProfileType)tmp;
   ShowDashboard(currentProfile);
}
This function ensures smooth cyclic transitions across all profiles with a single click.
Hide and Show Controls
When the Hide All button is clicked, the dashboard vanishes, leaving only the two control buttons visible. This declutters the chart entirely, which is useful for checking raw price action or drawing trend lines manually. Pressing Show All instantly restores the full dashboard exactly in the same locations and colors it previously occupied.
void HideEverythingExceptButtons() {
   int total=ObjectsTotal(0,0,-1);
   for(int i=total-1;i>=0;i--) {
      string name=ObjectName(0,i);
      if(name!="btn_hide" && name!="btn_show")
         ObjectDelete(0,name);
   }
}
This mechanism works consistently even after switching profiles or refreshing charts, proving that the system’s object‑management logic is robust.
Overall Signal Dynamics
At the bottom of the dashboard, the Overall label continuously reflects the combined market bias. As individual indicator colours flip, this label can turn red or green accordingly, showing traders a concise interpretation of dozens of readings. The weighting scheme used here — trend × 3, momentum × 2, volatility × 1 — produces realistic results: a strong trend maintains dominance even when short‑term oscillators temporarily disagree. In practice, the EA’s output often aligns with experienced traders’ intuition: if both EMAs slope upward and ADX is high, the Overall label turns green even if RSI oscillates.
Differentiating the signal calculation is straightforward inside ComputeOverall():
int w=(slots[i].group==0?3:(slots[i].group==1?2:1));
vote += signals[i]*w;
Testing across various symbols and timeframes; this weighting yields stable, trustworthy combined signals without excessive sensitivity.

Performance and Responsiveness
The timer‑based update structure means the EA runs smoothly whether ticks arrive quickly or slowly. CPU usage remains light even at fast refresh rates like 300 ms because it processes only indicators visible in the current profile, not all of them simultaneously. This selective updating can be confirmed in the main loop:
if(currentProfile==PROFILE_ALL || slots[i].group==(int)currentProfile)
         UpdateSlot(i);
In real use, the Multi Indicator Handler improves workflow remarkably. The consolidated dashboard means you no longer need multiple chart templates: instead of one template for moving averages and another for oscillators, a single chart shows all signals contextually.
When analyzing a potential trade, switching from Momentum to Trend gives immediate confirmation whether conditions align with your strategy. During live observation, pressing Hide All declutters the screen for manual drawing or price focus, then pressing Show All restores the analytical view momentarily.
Conclusion
The development of the Multi Indicator Handler Expert Advisor began with a simple, yet persistent problem in trading analysis: managing multiple indicators efficiently within MetaTrader 5. The traditional workflow—manually adding each tool to a chart from various subfolders, juggling multiple chart templates, and scanning separate indicator windows—is error‑prone, time‑consuming, and mentally taxing during fast‑moving market situations.
By designing an EA that consolidates all chosen indicators into a single, interactive dashboard, we addressed each of these pain points methodically. The result is a tool that doesn’t just display raw indicator data; it interprets that data into actionable buy, sell, or neutral signals, applies a logical weighting system for aggregation, and presents the results in a clean visual layout that traders can manipulate at will.
Final Thoughts
Technical analysis remains a cornerstone of discretionary and semi‑automated trading. The more streamlined, accessible, and coherent the analysis process, the faster and more accurate trading decisions can become. The Multi Indicator Handler bridges the gap between raw indicator outputs and trader‑friendly presentation, offering a unified control center for chart analysis inside MetaTrader 5. Whether used as a live trading aid or as a coding template to build customized dashboards, its combination of clear design, logical signal weighting, and user‑centric controls makes it a model worth studying, replicating, and evolving.
For MQL5 developers, it stands as an example of how thoughtful structuring and attention to interface detail can produce robust tools that perform reliably in real‑market conditions. For traders, it demonstrates how technology can simplify the complex task of synthesizing multiple market signals into a single clear direction. If you follow the breakdown from Introduction through Understanding Indicators, Strategy Overview, Implementation, Outcomes, and now this Conclusion, you can both run the EA immediately on your own charts and understand exactly how it works inside—opening a door to modify it for your strategies and workflows.
Warning: All rights to these materials are reserved by MetaQuotes Ltd. Copying or reprinting of these materials in whole or in part is prohibited.
This article was written by a user of the site and reflects their personal views. MetaQuotes Ltd is not responsible for the accuracy of the information presented, nor for any consequences resulting from the use of the solutions, strategies or recommendations described.


- Free trading apps
- Over 8,000 signals for copying
- Economic news for exploring financial markets
You agree to website policy and terms of use