How to create a custom Donchian Channel indicator using MQL5

Introduction
In this article, we will talk about a very important concept in trading which is trend identification as we will learn about a technical tool that can be helpful in that which is the Donchian Channel indicator. This indicator is a trend following the same as we will see.
We will cover all of that through the following topics:
Donchian Channel Definition
In this part, we will identify the Donchian Channel indicator and understand the main concept behind it to use effectively. The Donchian Channel was developed by the Richard Donchian trader and the main objective is to identify the trend this means that it is a trend-following and lagging indicator also as it follows trend directions and price movements. It consists of three lines forming a channel that contains the price. the upper line of the channel represents the highest price recorded during a specific time, the lower line of the channel represents the lowest price of a specific period of time, and the middle line represents the half distance between the upper and lower lines.
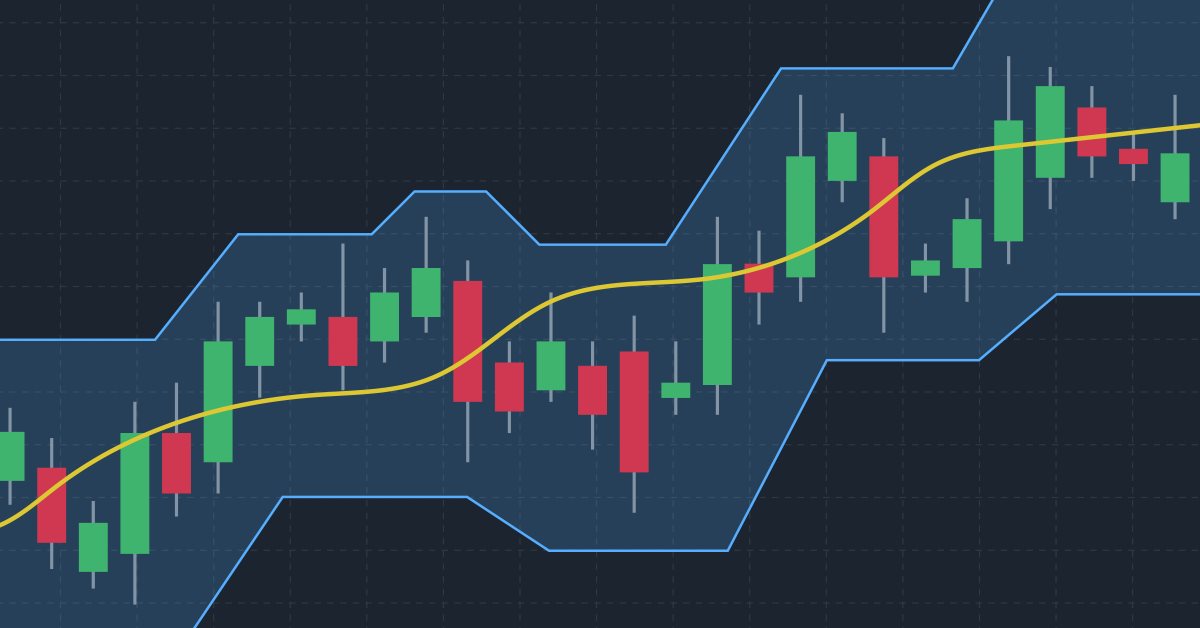
The following chart is an example of the Donchian Channel chart:

As we can see in the previous chart that there is a line above prices, another one below it, and there is a third one between them. What makes the indicator contains or surrounds prices by upper and lower lines in addition to another middle line that can be useful also. Based on this form of the indicator can be useful in trading by using it based on different strategies trend identification, breakouts, and support and resistances levels identification for example.
The main concept of using this indicator is to observe the highs and lows of prices across a specific time to identify trends or the direction that we can be biased for. If the price is above the highest high of a specific time, this indicates that there is a bullish power and this may be a buy signal. If the price is below the lowest low of a specific time, this indicates that there is a bearish power and it may be a sell signal. So, once we specified a specific period of time and determined the highest and the lowest prices, then we will observe them until the prices move in a specific direction up or down and the signal here is breaking the determined highest high or lowest low.
This indicator can be used for the sake of stop-loss and take-profit levels determination, and this is very important and useful in trading as it will eliminate and reduce setting wrong levels because the indicator's levels are very clear and it represents important levels especially if we use correct parameters. So, for example, the low of the channel may be used as a stop-loss level of a buy position or a take-profit level of a short position. But the high of the channel can be used as a stop-loss of a short position or profit target of a buy position.
According to what we mentioned we will provide the way to calculate this indicator the same as the following simple steps:
- Channel High (CH)= The highest high of last N-periods
- Channel Low (CL)= The lowest low of last N-periods
- Middle line (ML)= (Channel High+Channel Low)/2
So, we need to determine the desired time period that we need to detect the direction during it, detect the highest price and lowest price, plot a line next to them for observation, and get the middle line by calculating the half distance between the highest and lowest levels. It is good to mention also that there is a difference between the Donchian Channels and the Bollinger Bands because the Donchian Channels plot the highest high and the lowest low during a specific period of time as we mentioned but the Bollinger Bands plot an average of a period of time after adding and subtracting two standard deviations. If you need more information you can read my previous article about the Bollinger Bands to learn more about it and how to create a trading system based on it.
As we identified that the concept of this indicator is very important especially for those trend follower traders as it helps to identify trends and directions clearly which makes it will be useful to work and test different strategies based on this indicator as it may be a very good tool in our trading system. It is very important to note that it will be better if we use this indicator with other meaningful technical indicators to get better insights and results.
Custom Donchian Channel
In this topic, I will share a method that can be used to create a custom Donchian Channel indicator by MQL5. We will create the indicator with the form of upper line, lower line, and middle line as we can see in the following steps.
Create additional parameters with the identifier following values:
- indicator_chart_window: to view the indicator in the chart window.
- indicator_buffers: to determine the number of buffers of the indicator calculation. The number will be (3).
- indicator_plots: to determine the number of graphics series in the indicator. The number will be (3).
#property indicator_chart_window
#property indicator_buffers 3
#property indicator_plots 3
Create two inputs one for the period and the other for the color of the indicator lines the same as the following:
- Create an integer variable (indPeriod) and assign 20 as a default value but it can be different as per the user's input.
- A color type variable (indColor) and assign blue color as a default value but it can be different also as per the user's input.
input int indPeriod=20; //Period
input color indColor=clrBlue; //Color
Create global variables the same as the following:
- double type arrays of upperBuff, lowerBuff, middleBuff
- double type variables of upperLine, lowerLine, middleLine
- integer type of variables of start and bar
double upperBuff[];
double lowerBuff[];
double middleBuff[];
double upperLine,lowerLine,middleLine;
int start, bar;
Create a custom function of the indicator by using void to return nothing and create a variable of indInit with three parameters (index, buffer as a dynamic array, and label as a string for every line of the indicator). In the body of the function, we will do the following:
- Using the SetIndexBuffer function that links a specified indicator with the one-dimensional dynamic array. Its paramters are:
- index: to specify the number of the indicator buffer. We will use the index variable.
- buffer[]: to determine the created dynamic array that is the buffer[].
- data_type: to determine the data that we need to store which will be the default value (INDICATOR_DATA).
- Using the PlotIndexSetInteger function five times with different prop-id and prop_value parameters as we will see in the code and this function sets the value of the corresponding indicator line. The indicator property must be an integer. All parameters of it are the same as the following:
- plot_index: to determine the index of the graphical plotting. We will use the index variable.
- prop_id: to determine the property identifier value that can be one of the ENUM_PLOT_PROPERT_INTEGER.
- prop_value: to determine the value of the determined property in the prop_id.
- Using the PlotIndexSetString function that sets the value of the corresponding string property indicator. Its parameters are the same as the PlotIndexSetInteger function but the indicator property here must be a string.
- Using the PlotIndexSetDouble function to set the value of the corresponding double property indicator. the parameters are the same also but the indicator property must be of the double type.
void indInit(int index, double &buffer[],string label)
  {
   SetIndexBuffer(index,buffer,INDICATOR_DATA);
   PlotIndexSetInteger(index,PLOT_DRAW_TYPE,DRAW_LINE);
   PlotIndexSetInteger(index,PLOT_LINE_WIDTH,2);
   PlotIndexSetInteger(index,PLOT_DRAW_BEGIN,indPeriod-1);
   PlotIndexSetInteger(index,PLOT_SHIFT,1);
   PlotIndexSetInteger(index,PLOT_LINE_COLOR,indColor);
   PlotIndexSetString(index,PLOT_LABEL,label);
   PlotIndexSetDouble(index,PLOT_EMPTY_VALUE,EMPTY_VALUE);
  }
After that, in the OnInit() body, we will use our custom function of the indicator three times for the three lines of the indicator and it will be the same as the following:
   indInit(0,upperBuff,"Donchian Channel");
   indInit(1,lowerBuff,"Donchian Channel");
   indInit(2,middleBuff,"Middle Donchian");
Using the IndicatorSetString function here to set the text label of the indicator
IndicatorSetString(INDICATOR_SHORTNAME,"Donchian ("+IntegerToString(indPeriod)+")");
In the OnCalculate part, we will do the following steps to calculate the indicator:
Check if rates_totalis less than the user's input period+1, if so we need the program to return zero.
   if(rates_total<indPeriod+1)
     {
      return 0;
     }
Assign a value for the start variable by using the ternary operator ?: - if the start=prev_calculated==0 is true, the operator will set by the indPeriod and if it is false the operator will be set by the prev_calculated-1.
start=prev_calculated==0? indPeriod: prev_calculated-1;
Using the for function to create a loop to calculate the indicator, the expression 1 will be (bar=start), the expression 2 will be (bar < rate_total), and the expression 3 will be (bar ++) to increment the bar by one. The operator of the for loop will be the same as the following:
- Calculating the upperLine by detecting the maximum value of high by using the ArrayMaximum function that searches for the highest value in the array.
- Calculating the lowerLine by detecting the minimum value of low by using the ArrayMinimum function that searches for the lowest value in the array.
- Calculating the middleLine by subtracting the result of upperLine and lowerLine by 2
- Assigning the value of upperBuff[bar], lowerBuff[bar], and middleBuff[bar}
   for(bar=start;bar<rates_total;bar++)
   {
      upperLine=high[ArrayMaximum(high,bar-indPeriod+1,indPeriod)];
      lowerLine=low[ArrayMinimum(low,bar-indPeriod+1,indPeriod)];
      middleLine=(upperLine+lowerLine)/2;

      upperBuff[bar]=upperLine-(upperLine-lowerLine);
      lowerBuff[bar]=lowerLine+(upperLine-lowerLine);
      middleBuff[bar]=middleLine;

   }
The following is the full code in one block:
#property indicator_chart_window
#property indicator_buffers 3
#property indicator_plots 3
input int indPeriod=20; //Period
input color indColor=clrBlue; //Color
double upperBuff[];
double lowerBuff[];
double middleBuff[];
double upperLine,lowerLine,middleLine;
int start, bar;
void indInit(int index, double &buffer[],string label)
  {
   SetIndexBuffer(index,buffer,INDICATOR_DATA);
   PlotIndexSetInteger(index,PLOT_DRAW_TYPE,DRAW_LINE);
   PlotIndexSetInteger(index,PLOT_LINE_WIDTH,2);
   PlotIndexSetInteger(index,PLOT_DRAW_BEGIN,indPeriod-1);
   PlotIndexSetInteger(index,PLOT_SHIFT,1);
   PlotIndexSetInteger(index,PLOT_LINE_COLOR,indColor);
   PlotIndexSetString(index,PLOT_LABEL,label);
   PlotIndexSetDouble(index,PLOT_EMPTY_VALUE,EMPTY_VALUE);
  }
int OnInit()
  {
   indInit(0,upperBuff,"Donchian Channel");
   indInit(1,lowerBuff,"Donchian Channel");
   indInit(2,middleBuff,"Middle Donchian");
   IndicatorSetString(INDICATOR_SHORTNAME,"Donchian ("+IntegerToString(indPeriod)+")");

   return(INIT_SUCCEEDED);
  }
int OnCalculate(const int rates_total,
                const int prev_calculated,
                const datetime &time[],
                const double &open[],
                const double &high[],
                const double &low[],
                const double &close[],
                const long &tick_volume[],
                const long &volume[],
                const int &spread[])
  {
   if(rates_total<indPeriod+1)
     {
      return 0;
     }
   start=prev_calculated==0? indPeriod: prev_calculated-1;
   for(bar=start;bar<rates_total;bar++)
   {
      upperLine=high[ArrayMaximum(high,bar-indPeriod+1,indPeriod)];
      lowerLine=low[ArrayMinimum(low,bar-indPeriod+1,indPeriod)];
      middleLine=(upperLine+lowerLine)/2;

      upperBuff[bar]=upperLine-(upperLine-lowerLine);
      lowerBuff[bar]=lowerLine+(upperLine-lowerLine);
      middleBuff[bar]=middleLine;
   }
   return(rates_total);
  }
After compiling this code, it must be compiled without errors or warnings then we will find the indicator in the Navigator window in the trading terminal in the Indicator folder and by executing it, we can find the window and input the same as the following:

As we can see in the previous picture, we have two inputs:
- Period: to determine the time length that we need to use in the indicator calculation. It appears 20 as a default value but it can be updated by the user.
- Color: to determine the color of lines of the indicator. Its default value is blue but it can be updated also.
After determining these two inputs as per our preferences and pressing OK we can find the indicator attached to the chart the same as the following

As we can see in the previous chart we have three lines of the indicator two lines surrounding the price from above and below forming a channel and a middle line represents the half distance of the channel.
Donchian Channel EA
In this part, we need to use this custom Donchian Channel indicator in a trading system by creating an Expert Advisor that can be used to generate signals based on the indicator's movement or behavior. We can do that using two different methods the first one is to write the code of the indicator concept in the EA or the second method is to use the iCustom function to attach your created indicator to the EA. Here, we will design very simple systems just to understand the concept and how we can improve these systems based on the second method as we learned how to create the indicator.
The following are about these EAs:
Donchian Channel Simple EA
We will start to create the first system that can be used to return a comment on the chart with the indicator's values (Channel High, Channel Middle, and Channel Low). So, we need the program to continuously check and monitor these values and print them out on the chart as a comment.
The following are steps to create this type of EA:
Create an input variable of the indicator period with a default value (20) but the user can update it from inputs of the EA.
input int indPeriod=20; //Period
Create an integer global variable of donChianChannel.
int donchianChannel; In the part on OnInit(), we will update the donchianChannel by assigning to it the iCustom function that returns the handle of the created custom Donchian Channel indicator. Its parameters are:
- symbol: to specify the symbol name, we will use _Symbol to be applied for the current symbol.
- period: to specify the timeframe, we will use the PERIOD_CURRENT to be applied for the current timeframe
- name: to specify the string name of the indicator and its path.
- After that specify the inputs of the indicator which is here the period of the indicator.
donchianChannel=iCustom(_Symbol,PERIOD_CURRENT,"My Files\\Donchian_Channel\\Donchian_Channel",indPeriod);
In the OnDeinit() part, we will use the Print function to return a message in the expert advisor with "Donchian Channel EA Removed" when removing the EA.
Print("Donchian Channel EA Removed");
In the OnTick() part, we will create three arrays of channelBuff, channelBuff1, middleBuff
double channelBuff[],channelBuff1[], middleBuff[]; Using the CopyBuffer function to get data of every buffer of the custom Donchian Channel indicator. Its parameters:
- indicator_handle: to specify the indicator handle, we will use the created donchianChannel handle for all three buffers.
- buffer_num: to specify the buffer number, we will 0 for channelBuff, 1 for channelBuff1, and 2 for middleBuff.
- start_pos: to specify the position of the first element to copy, we will 0 for all three buffers.
- count: to specify the data count to copy, we will use 3 for all three buffers.
- buffer[]: to specify the target array to copy, we will specify the three buffers (channelBuff, channelBuff1, and middleBuff).
   CopyBuffer(donchianChannel,0,0,3,channelBuff);
   CopyBuffer(donchianChannel,1,0,3,channelBuff1);
   CopyBuffer(donchianChannel,2,0,3,middleBuff);
Defining the current values of every line after creating a double variable for everyone.
   double channelHigh=channelBuff1[0];
   double channelMiddle=middleBuff[0];
   double channelLow=channelBuff[0];
Use the Comment function to return a comment on the chart with three values and each one in a separate line.
Comment("Channel High: ",channelHigh,"\nChannel Middle: ",channelMiddle,"\nChannel Low: ",channelLow);
The following is the full code in one block
input int indPeriod=20; //Period
int donchianChannel;
int OnInit()
  {
   donchianChannel=iCustom(_Symbol,PERIOD_CURRENT,"My Files\\Donchian_Channel\\Donchian_Channel",indPeriod);
   return(INIT_SUCCEEDED);
  }
void OnDeinit(const int reason)
  {
   Print("Donchian Channel EA Removed");
  }
void OnTick()
  {
   double channelBuff[],channelBuff1[], middleBuff[];
   CopyBuffer(donchianChannel,0,0,3,channelBuff);
   CopyBuffer(donchianChannel,1,0,3,channelBuff1);
   CopyBuffer(donchianChannel,2,0,3,middleBuff);
   double channelHigh=channelBuff1[0];
   double channelMiddle=middleBuff[0];
   double channelLow=channelBuff[0];
   Comment("Channel High: ",channelHigh,"\nChannel Middle: ",channelMiddle,"\nChannel Low: ",channelLow);
  }
After compiling this code without errors or warnings we can find it in the Navigator window under the Expert Advisor folder. By executing it to the desired chart, we can find the window of inputs the same as the following:

After execution we can find the EA is attached to the chart in addition to the levels of the Donchian Channel indicator as a comment the same as the following:

As we can see that we have the desired signal on the chart which is the comment of three values of the indicator (Channel High, Channel Middle, and Channel Low) each value in a separate line.
For the sake of confirmation we can compare between signals values of EA and the indicator's values, we can find the following picture to find the indicator is inserted and values of it in the data window are the same of the signals values of EA the same as the following picture:

If we want to improve this EA to find signals based on the indicator movements and levels, this is what we will try to do through the following trading systems (EAs) by try to set conditions based on the indicator's concept to receive signals of buying and selling.
Donchian Channel Breakout EA:
In this version of EA we need the program to continuously check all three values of the indicators and if the price (ask) breaks the channel high, we need to receive a buy signal as a comment on the chart. The other scenario, if the price (bid) breaks the channel low, we need to receive a sell signal as a comment on the chart also. If there is something else, we need to receive nothing.
The following is the full code to create this type of trading system (EA):
input int indPeriod=20; //Period
int donchianChannel;
int OnInit()
  {
   donchianChannel=iCustom(_Symbol,PERIOD_CURRENT,"My Files\\Donchian_Channel\\Donchian_Channel",indPeriod);
   return(INIT_SUCCEEDED);
  }
void OnDeinit(const int reason)
  {
   Print("Donchian Channel EA Removed");
  }
void OnTick()
  {
   double channelBuff[],channelBuff1[], middleBuff[];
   CopyBuffer(donchianChannel,0,0,3,channelBuff);
   CopyBuffer(donchianChannel,1,0,3,channelBuff1);
   CopyBuffer(donchianChannel,2,0,3,middleBuff);
   double channelHigh=channelBuff1[0];
   double channelMiddle=middleBuff[0];
   double channelLow=channelBuff[0];
   double ask=SymbolInfoDouble(_Symbol,SYMBOL_ASK);
   double bid=SymbolInfoDouble(_Symbol,SYMBOL_BID);
   if(ask>channelHigh)
     {
      Comment("Buy Signal");
     }
     else if(bid<channelLow)
     {
      Comment("Sell Signal");
     }
     else Comment(" ");
  }
Differences in this code are the same as the following:
Defining the ask, and bid by using the SymbolInfoDouble function to return the property (ask, bid) values after creating double variables for them.
   double ask=SymbolInfoDouble(_Symbol,SYMBOL_ASK);
   double bid=SymbolInfoDouble(_Symbol,SYMBOL_BID);
Conditions of the strategy:
In case of buy
We need the program to check the ask and the channel high to determine their positions. If the ask is greater than the channel high, this will be the buy condition and we need the EA to return a buy signal as a comment on the chart once this condition is met.
   if(ask>channelHigh)
     {
      Comment("Buy Signal");
     }
In case of sell
We need the program to check the bid and the channel low to determine their positions. If the bid price is less than the channel low level, this will be the sell condition and we need the EA to return a sell signal as a comment on the chart once this condition is met.
     else if(bid<channelLow)
     {
      Comment("Sell Signal");
     }
In case of nothing
We need the EA to return nothing if there is something except the buy or sell conditions.
else Comment(" ");
After compiling this code without errors or warnings, we can execute it to the chart by dragging and dropping it to the desired chart to get signals based on the strategy the same as the following examples:
In case of buy signal

As we can see in the top left corner of the previous chart we have a buy signal after breaking the channel high to the upside.
In case of sell signal

As we can see in the top left corner of the previous chart we have a sell signal after breaking the channel low to the downside.
In case of nothing

As we can see there is no signal as the price moves within the channel which means the price is below the channel high and above the channel low.
Donchian Channel and MA Breakout:
Now, we need to improve the EA a little bit by filtering signals by adding the moving average to the conditions of the strategy, and this is what we will do in this trading system. So, we need to receive a buy signal when the price (ask) breaks above the channel high in case the 200-period EMA (Exponential Moving Average) is below the ask. In the case of a sell signal, we need to make sure that the bid price breaks below the channel low and at the same time the 200-Period EMA is above the bid. In case of anything else we need to receive nothing.
The following is for the full code to create this type of trading system:
input int indPeriod=20; //Period
input int maPeriod=200; //Moving Average Period
int donchianChannel;
int EMA;
double emaArray[];
int OnInit()
  {
   donchianChannel=iCustom(_Symbol,PERIOD_CURRENT,"My Files\\Donchian_Channel\\Donchian_Channel",indPeriod);
   EMA = iMA(_Symbol,_Period,maPeriod,0,MODE_EMA,PRICE_CLOSE);
   return(INIT_SUCCEEDED);
  }
void OnDeinit(const int reason)
  {
   Print("Donchian Channel EA Removed");
  }
void OnTick()
  {
   double channelBuff[],channelBuff1[], middleBuff[];
   CopyBuffer(donchianChannel,0,0,3,channelBuff);
   CopyBuffer(donchianChannel,1,0,3,channelBuff1);
   CopyBuffer(donchianChannel,2,0,3,middleBuff);
   ArraySetAsSeries(emaArray,true);
   CopyBuffer(EMA,0,0,3,emaArray);
   double channelHigh=channelBuff1[0];
   double channelMiddle=middleBuff[0];
   double channelLow=channelBuff[0];
   double EMAValue=NormalizeDouble(emaArray[0],_Digits);
   double ask=SymbolInfoDouble(_Symbol,SYMBOL_ASK);
   double bid=SymbolInfoDouble(_Symbol,SYMBOL_BID);
   if(ask>channelHigh&&ask>EMAValue)
     {
      Comment("Buy Signal","\nAsk above Channel High","\nAsk above (",maPeriod,") EMA");
     }
     else if(bid<channelLow&&bid<EMAValue)
     {
      Comment("Sell Signal","\nBid below Channel Low","\nBid Below (",maPeriod,") EMA");
     }
     else Comment(" ");
  }
Differences in this code are the same as the following:
Create another input of integer variable of the maPeriod with a default value (200) but the user can update it as per his preferences
input int maPeriod=200; //Moving Average Period
Create a global integer variable of EMA
int EMA; Create an array of emaArray[]
double emaArray[]; Update the EMA variable by using the iMA function to return the handle of the moving average indicator and its parameters are:
- symbol: to specify the symbol and we will use (_Symbol) to be applied to the current symbol.
- period: to specify the timeframe we will use (_period) to be applied to the current timeframe.
- ma_period: to specify the averaging period, we will use the user input (maPeriod).
- ma_shift: to specify if there is a shift, we will use (0) as we do not need shifting.
- ma_method: to specify the moving average smoothing type, we will use (MODE_EMA) as we need the exponential moving average.
- applied_price: to specify the type of price, we will use (PRICE_CLOSE).
EMA = iMA(_Symbol,_Period,maPeriod,0,MODE_EMA,PRICE_CLOSE);
Using the ArraySetAsSeries function to set the AS_SERIES, its parameters are:
- array[]: to specify the array, we will use the emaArray.
- flag: to specify the array indexing direction, we will use true.
ArraySetAsSeries(emaArray,true);
Using the CopyBuffer function to get data from the buffer of the moving average
CopyBuffer(EMA,0,0,3,emaArray);
Defining the EMA value and normalizing it
double EMAValue=NormalizeDouble(emaArray[0],_Digits);
Conditions of the strategy:
In case of buy
If the price> high of the channel, we need the following comment on the chart
- Buy signal
- Ask above Channel High
- Ask above (period) EMA
   if(ask>channelHigh&&ask>EMAValue)
     {
      Comment("Buy Signal","\nAsk above Channel High","\nAsk above (",maPeriod,") EMA");
     }
In case of sell
If the price< low of the channel, we need the following comment on the chart
- Sell signal
- Bid below Channel Low
- Bid below (period) EMA
     else if(bid<channelLow&&bid<EMAValue)
     {
      Comment("Sell Signal","\nBid below Channel Low","\nBid Below (",maPeriod,") EMA");
     }
In case of no signal
else Comment(" ");
After compiling this code without errors or warnings, we can find signals of this trading system the same as the following
In case of buy signal

As we can see in the previous example, we have the buy signal and conditions of this signal which is the price is above the channel high and 200 EMA is met comment on the charts as we need.
In case of sell signal

As we can see in the previous example, we have the sell signal and conditions of this signal which is the price is below the channel low and 200 EMA is met comments on the chart as we need.
In case of no signal

As we can see there is no signal on the chart indicating that conditions are not met because the price is above the channel low and below the channel high even if we have a sell setup because the price is below the 200 EMA.
Conclusion
As we learned through the mentioned topic of this article, we identified how much the Donchian Channel Indicator can be a useful and valuable tool, especially after creating it by ourselves as a custom indicator in addition to creating trading systems based on the indicator's concept. It supposed that you are able to create your custom Donchian Channel indicator as per your preferences and what serves as a good tool for your trading, in addition, to be able to create a trading system using the iCustom function to trade or get signals based on the indicator interpreting not only that but you supposed to be able to improve this trading system (EA) based on what enhancing its results by adding specific conditions and using another technical tool to get better insights.
I hope that you found this article useful for your trading journey in terms of getting better results and insights or at least you found this article useful and gave you good insights about any other related concept. I will not forget also again to confirm that you do not use the content of this article in your real account before testing it to make sure it will be profitable for you as there is no tool suitable for all people.
If you found this article useful and you want to read more articles for me you can read my other articles from this publication link, you can find a series of articles about how to create trading systems based on the most popular technical indicators and others I hope you found them useful also.
Warning: All rights to these materials are reserved by MetaQuotes Ltd. Copying or reprinting of these materials in whole or in part is prohibited.
This article was written by a user of the site and reflects their personal views. MetaQuotes Ltd is not responsible for the accuracy of the information presented, nor for any consequences resulting from the use of the solutions, strategies or recommendations described.

- Free trading apps
- Over 8,000 signals for copying
- Economic news for exploring financial markets
You agree to website policy and terms of use
New article How to create a customised Donchian Channel using MQL5 has been published:
Author: Mohamed Abdelmaaboud
you see https://www.mql5.com/en/market/product/31082?source=Unknown