Learn how to design a trading system by Force Index
Introduction
Here is a new article from our series about learning how to design a trading system by the most popular technical indicators. In this article, we will learn how to create a trading system by the Force Index indicator. We will learn what is this indicator in detail by covering the following topics:
- Force Index definition
- Force Index strategy
- Force Index strategy blueprint
- Force Index trading system
- Conclusion
Through the previously mentioned topics, we will learn in more detail about this technical indicator. We will learn what is it, what it measures, and how we can calculate it through the topic of force index definition. After understanding the basic concept behind this indicator, we will learn how to use simple strategies and we will learn that through the topic of force index strategy. When it comes to creating a trading system for any strategy, we find that we need to organize our ideas to do that smoothly, so, we will design a blueprint for each mentioned strategy to help us to achieve our objective smoothly and effectively, we will do that through the topic of force index strategy blueprint. After organizing our ideas through a step-by-step blueprint, we will create our trading system to be executed in the MetaTrader 5 trading platform to generate signals automatically and accurately as we will do that through the topic of force index trading system.
We will use MQL5 (MetaQuotes Language) to write the code for the trading system and this MQL5 which is built in the MetaTrader 5 trading terminal. If you want to learn how to download and use them, you can read the topic of Writing MQL5 code in MetaEditor from a previous article. I need to advise you to apply what you learn as it will help you to deepen your understanding in addition to the necessity of testing any strategy before using it on your real account.
Disclaimer: All information is provided 'as is' only for educational purposes and is not meant for trading purposes or advice. The information does not guarantee any kind of result. If you choose to use these materials on any of your trading accounts, you will do that at your own risk and you will be the only responsible.
Now, let us start our topics to learn about this Force Index indicator.
Force Index definition
In this topic, we will learn in more detail about the Force Index indicator as we will learn what is the Force Index indicator, what it measures, and how we can calculate it. My approach is when we learn and understand the root of things, we will not be able to use these things effectively only but we will get more insights about how to develop more ideas related to these things. The Force Index is developed by Alexander Elder and he provided it in his amazing book "Trading for a living". This indicator measures the power behind the movement or identifies potential turning points. This Force Index indicator uses the price and volume in its calculation and this helps to measure the power behind any movement in the market.
If we want to know how we can calculate this Force Index indicator manually to understand the basic concept behind it, we can do that by the following two simple steps:
1- Force Index of 1-period = (Close of 1-period - Close of previous period) * Volume
2- Force Index of 13-period = 13-period of EMA of Force Index of 1-period
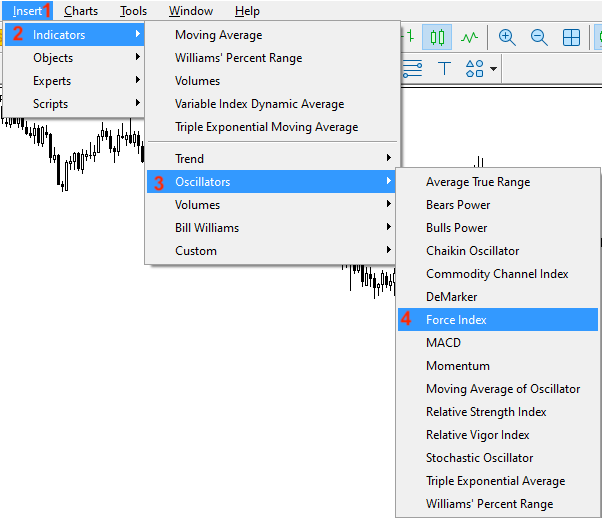
Nowadays, we do not need to calculate that manually as we can find it as a built-in indicator in our MetaTrader 5 trading platform and all we need is to choose it from the available indicators in the MetaTrader 5 trading terminal. While we open the MetaTrader 5, we will press the Insert tab --> Indicators --> Oscillators --> Force Index.
The following is a picture to do that:
After choosing the "Force Index", we will find the parameters of this indicator the same as the following:
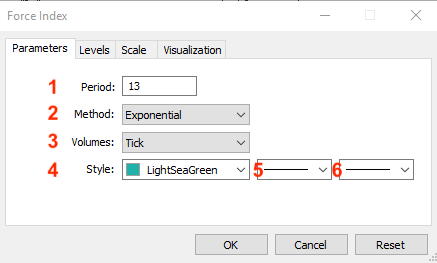
1- To determine the desired period of the Force Index indicator. We will use (13) as the default setting of the indicator.
2- To determine the type of usable moving average. We will use the exponential one.
3- To determine the type of volume. We will use the Tick one.
4- To determine the color of the indicator line.
5- To determine the style of the line.
6- To determine the thickness of the line.
After that, we can find the indicator attached to the chart the same as the following:
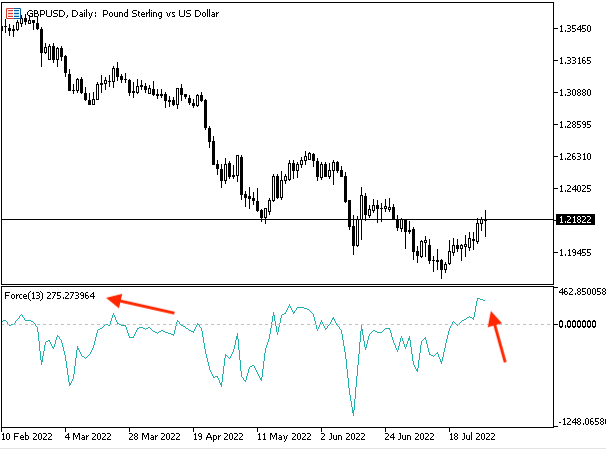
As we can see in the lower window in the previous chart that the Force Index indicator is attached to the chart and its line oscillates above and below zero level.
Force Index strategy
In this topic, we will learn how to use the Force Index based on the basic concept behind it. We will use simple strategies just to understand the basic concept of how you can use this indicator and how you can create a trading system by it. You must test any of these strategies before using them on your real account to make sure that they will be suitable for your trading as the main objective here is education only.
- Strategy one: Force Index - Trend Identifier:
Based on this strategy, we need to get signals of bullish or bearish based on the crossover between the force index indicator and the zero level. If the force index is greater than the zero level, it will be a signal of bullish movement. Vice versa, if the force index is lower than the zero level, it will be a signal of bearish movement.
Simply,
Force index > zero level --> bullish movement.
Force index < zero level --> bearish movement.
- Strategy two: Force Index - Up or Divergence:
Based on this strategy, we need to get a signal when the market experiences a strong up move or divergence. If the current high value is greater than the previous high value and at the same time, the current force index value is greater than the previous force index value, it will be a signal of a strong up move. If the current high is greater than the previous high and at the same time, the current force index is lower than the previous force index value, this will be a signal of bearish divergence.
Simply,
Current high > previous high and current force index > previous force index --> strong up move.
Current high > previous high and current force index < previous force index --> bearish divergence.
- Strategy three: Force Index - Down or Divergence:
According to this strategy, we need to get the opposite signal of strategy two. We need to get a signal of a strong down move or divergence based on specific conditions. If the current low is lower than the previous low and the current force index value is lower than the previous one, it will be a signal of a strong down move. If the current low is lower than the previous one and the current force index is greater than the previous one, it will be a signal of bullish divergence.
Simply,
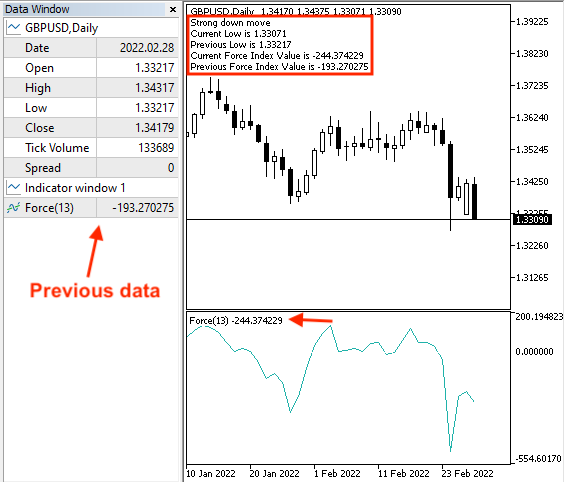
Current low < previous low and current force index < previous force index --> strong down move.
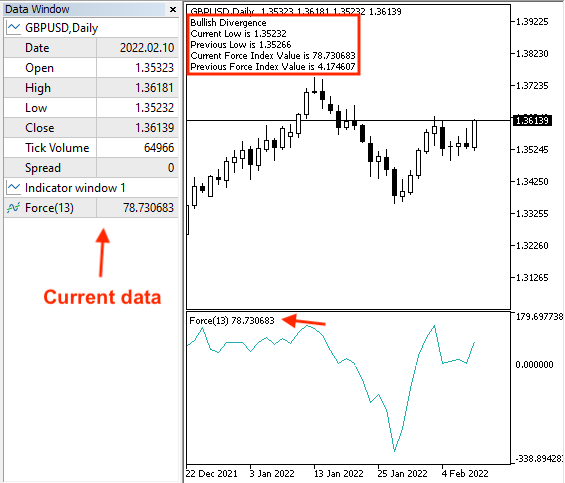
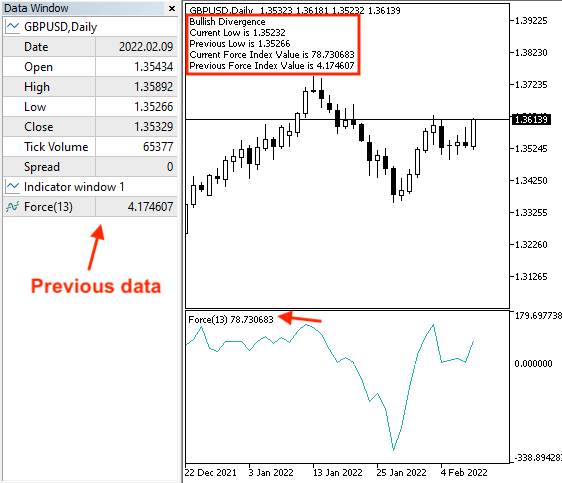
Current low < previous low and current force index > previous force index --> bullish divergence.
- Strategy four: Force Index signals:
According to this strategy, we need to get buy or sell signals based on specific conditions. If the closing price is greater than the exponential moving average, the previous force index is lower than zero, and the current force index is greater than the zero level, this will be a buy signal. If the closing price is below the exponential moving average, the previous force index is greater than the zero level, and the current force index is lower than the zero level, this will be a sell signal.
Simply,
Closing price > EMA, previous force index < zero, and current force index > zero --> buy signal.
Closing price < EMA, previous force index > zero, and current force index < zero --> sell signal.
Force Index strategy blueprint
In this topic, we will design a step-by-step blueprint to help us to create our trading system. In my opinion, this is an important step as it helps us to organize our ideas to complete our objective and create our trading system smoothly.
- Strategy one: Force Index - Trend Identifier:
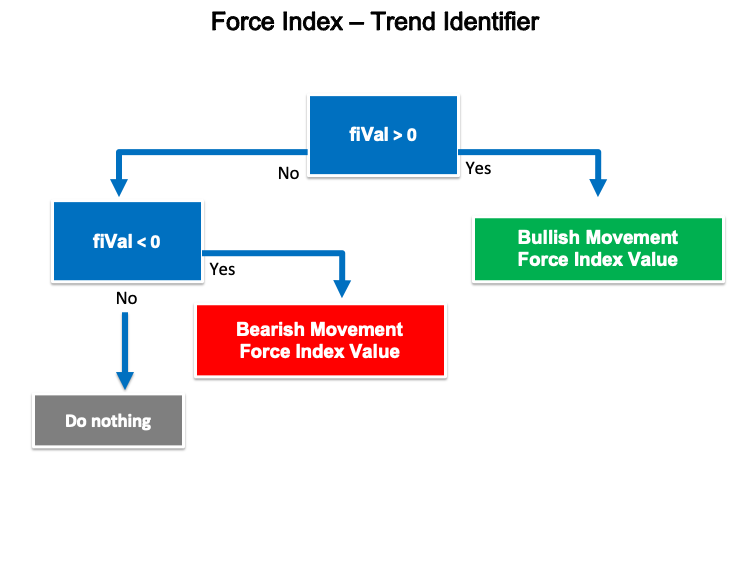
According to this strategy, we need to create a trading system that it gives us automatic signals with bullish or bearish movements as a comment on the chart. We need the expert to check the Current force index for every tick and decide its position from the zero level. If the current force index value is greater than the zero level, we need the expert to return comments on the chart with bullish movement and current force index value. On the other hand, if the current force index value is lower than the zero level, we need the expert to return comments on the chart with bearish movement and current force index value.
- Strategy two: Force Index - Up or Divergence:
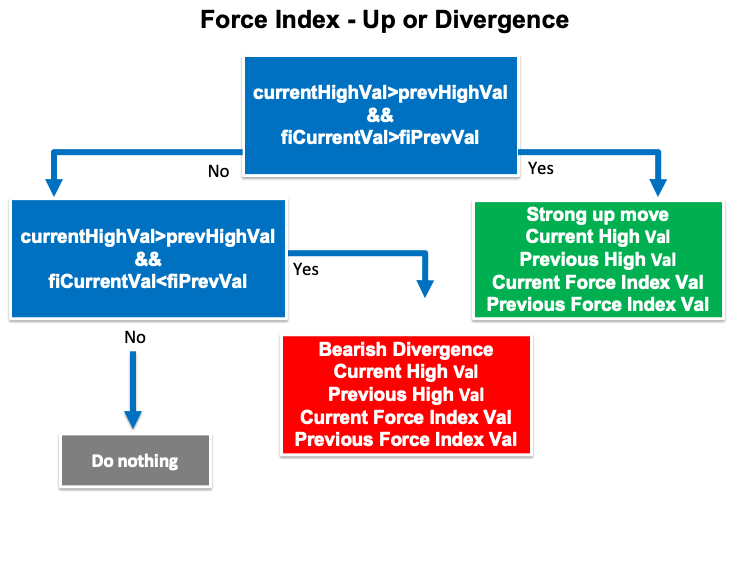
Based on this strategy, we need to create a trading system to give us a signal with a strong up move or bearish divergence. We need the trading system to check four values continuously and these values are the current high, and previous high values, and decide which one is bigger than the other and the same with the current force index, and previous force index values. If the current high is greater than the previous high and the current force index is greater than the previous force index, we need the expert to return the following as a comment on the chart each value in a separate line:
- Strong up move
- Current high value
- Previous high value
- Current force index value
- Previous force index value
If the current high is greater than the previous high and the current force index is lower than the previous force index, we need the expert to return the following as a comment on the chart each value in a separate line:
- Bearish divergence
- Current high value
- Previous high value
- Current force index value
- Previous force index value
The following is a picture for this blueprint:
- Strategy three: Force Index - Down or Divergence:
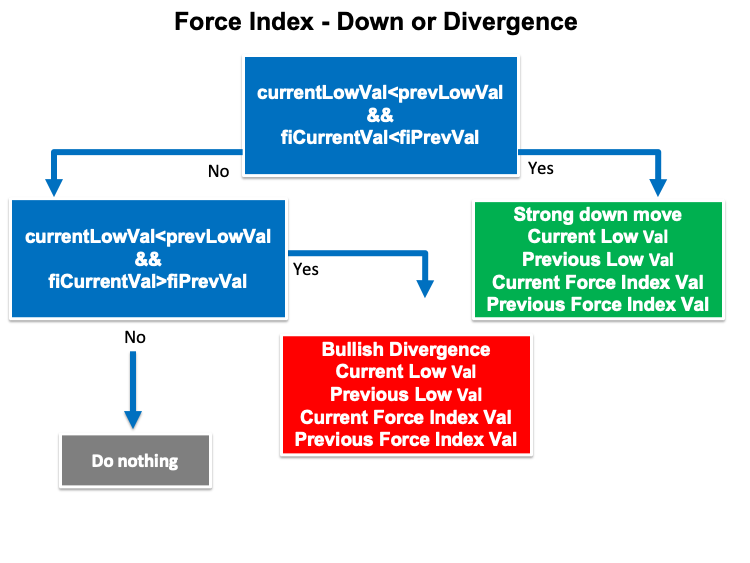
According to this strategy, we need to create a trading system that returns automatic signals of strong down move or bullish divergence. We need the expert to check four values the current low value and the previous low value and decide which one is greater than the other we need the expert also to check the current force index and the previous force index and decide which one is greater than the other. If the current low value is lower than the previous low value and the current force index is lower than the previous force index, we need the expert to return the following values as a comment on the chart each value in a separate line:
- Strong down move
- Current low value
- Previous low value
- Current force index value
- Previous force index value
If the current low is lower than the previous low and the current force index is greater than the previous force index, we need the expert to return the following values in a comment on the chart each value in a separate line:
- bullish divergence
- Current low value
- Previous low value
- Current force index value
- Previous force index value
The following is a picture of this blueprint:
- Strategy four: Force Index signals:
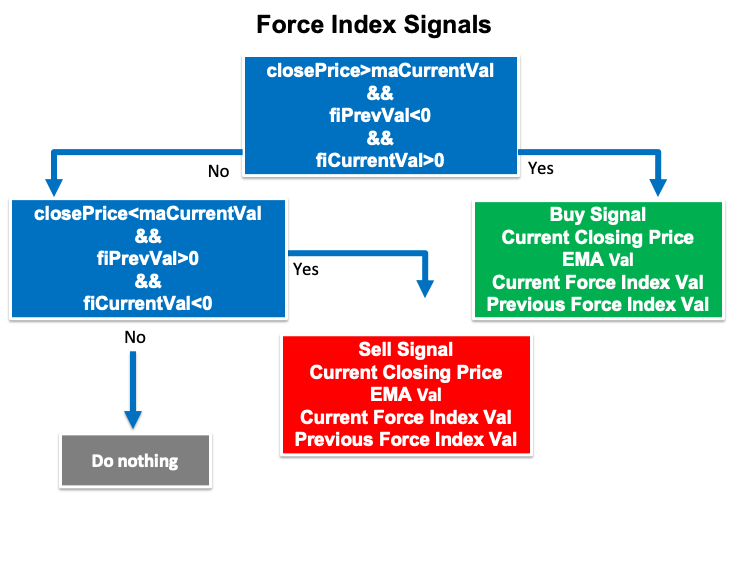
Based on this strategy, we need to create a trading system that returns buy or sell signals based on specific conditions. We need the expert to check four values continuously and these values are closing price, moving average, current force index, and previous force index. If the closing price is greater than the current moving average value, the previous force index is lower than zero, and the current force index is greater than the zero level, we need the expert to return the following values as a comment on the chart each value in a separate line:
- Buy signal
- Current closing price
- Current exponential moving average
- Current force index value
- Previous force index value
If the closing price is lower than the current moving average, the previous force index value is greater than the zero level, and the current force index value is lower than the zero level, we need the expert to return the following values as a comment on the chart each value in a separate line:
- Sell signal
- Current closing price
- Current exponential moving average
- Current force index value
- Previous force index value
The following is a blueprint of this strategy:
Force Index trading system
In this topic, we will learn in detail how to create a trading system for each mentioned strategy to get automatic signals on MetaTrader 5 based on each mentioned strategy after writing codes of MQL5 of these strategies. First, we will create a simple trading strategy that can be used to generate a comment on the chart with the current Force Index value to use as a base for our mentioned strategies.
- Creating an array for the fiArray by using the "double" function.
double fiArray[]; - Sorting the array by using the "ArraySetAsSeries" function which returns a Boolean (true or false). Parameters of this function are:
- array[]
- flag
ArraySetAsSeries(fiArray,true);
- Defining the volume by using the iForce after creating a variable for fiDef. The iForce function returns the handle of the Force Index indicator. Parameters of this function are:
- symbol: we will use (_Symbol) to be applied to the current symbol.
- period: we will use (_Period) to be applied to the current period or time frame.
- ma_period: we will use (13) as the length of the usable moving average.
- ma_method: we will use (MODE_EMA) as a type of usable moving average
- applied_volume: we will use (VOLUME_TICK) as a type of the volume.
int fiDef = iForce(_Symbol,_Period,13,MODE_EMA,VOLUME_TICK);
- Fill the array by using the CopyBuffer function to get the data from the Force Index indicator. Parameters of this function:
- indicator_handle: for indicator handle and we will use (fiDef).
- buffer_num: for indicator buffer number and we will use (0).
- start_pos: for start position and we will use (0).
- count: for the amount to copy and we will use (13).
- buffer[]: for the target array to copy and we will use (fiArray).
CopyBuffer(fiDef,0,0,3,fiArray);
- Defining the current Force Index value by using the NormalizeDouble function after creating a variable for fiVal. The NormalizeDouble function returns the double type value and the parameters are:
- value: we will use (fiArray[0]) as a normalized number.
- digits: we will use (6) as a number of digits after the decimal point.
double fiVal = NormalizeDouble(fiArray[0],6);
- Using the comment function to return the current Force Index value as a comment on the chart.
Comment("Force Index Value is ",fiVal);
The following is for the full code to create this simple trading system:
//+------------------------------------------------------------------+
//|                                           Simple Force Index.mq5 |
//|                                  Copyright 2022, MetaQuotes Ltd. |
//|                                             https://www.mql5.com |
//+------------------------------------------------------------------+
#property copyright "Copyright 2022, MetaQuotes Ltd."
#property link      "https://www.mql5.com"
#property version   "1.00"
//+------------------------------------------------------------------+
void OnTick()
  {
   double fiArray[];

   ArraySetAsSeries(fiArray,true);

   int fiDef = iForce(_Symbol,_Period,13,MODE_EMA,VOLUME_TICK);

   CopyBuffer(fiDef,0,0,3,fiArray);

   double fiVal = NormalizeDouble(fiArray[0],6);

   Comment("Force Index Value is ",fiVal);

  }
//+------------------------------------------------------------------+
After compiling this code we will find the expert of this trading system in the navigator window the same as the following:
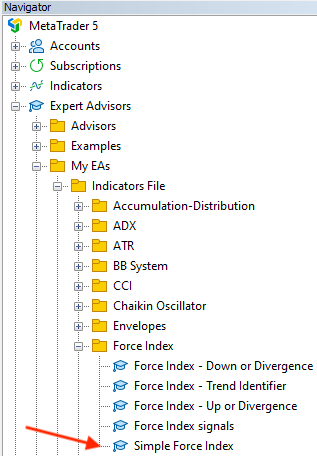
By dragging and dropping it on the chart we will find its window the same as the following:
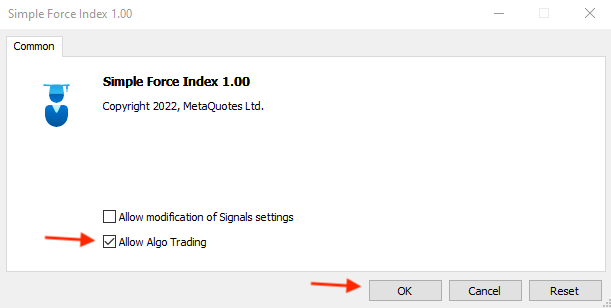
After pressing "OK" we will find the expert will be attached to the chart:
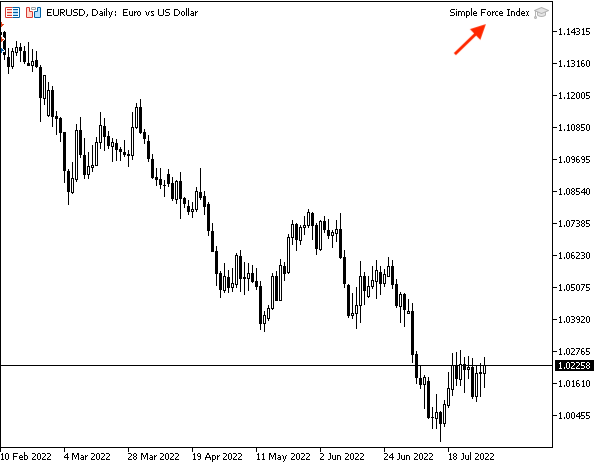
As we can see in the top right of the previous picture that the expert "Simple Force Index" is attached to the chart.
We can find generating signals by this trading system is the same as the following example from testing:
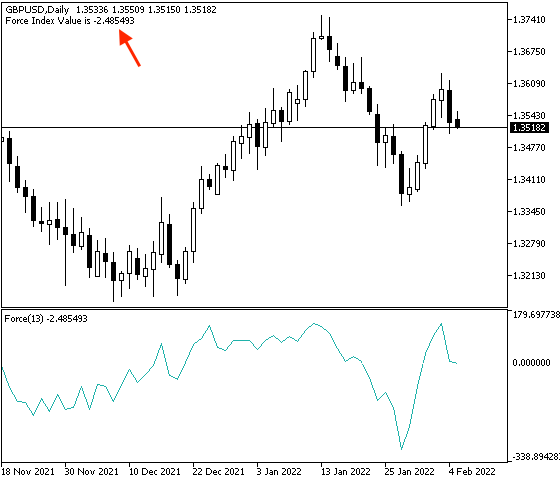
As we can see in the previous picture in the top left we have the signal of the current Force Index value as a comment on the chart.
If we want to confirm that generated signal is the same as the built-in force index indicator in MetaTrader 5. We can do that by inserting the indicator with the same settings of the programmed indicator at the same time of the expert is attached. We will find both signals the same as the following:
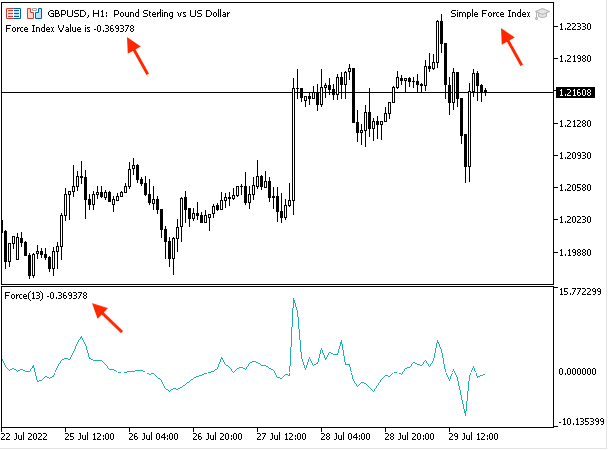
As we can see in the previous chart in the top left that the expert is attached and in the top right we have the comment on the force index value that is generated by this expert and in the lower window we have the inserted built-in force index with its value and we can see clearly that both values are the same.
- Strategy one: Force Index - Trend Identifier:
The following is for how to write the code that creates a trading system based on this strategy.
//+------------------------------------------------------------------+
//|                               Force Index - Trend Identifier.mq5 |
//|                                  Copyright 2022, MetaQuotes Ltd. |
//|                                             https://www.mql5.com |
//+------------------------------------------------------------------+
#property copyright "Copyright 2022, MetaQuotes Ltd."
#property link      "https://www.mql5.com"
#property version   "1.00"
//+------------------------------------------------------------------+
void OnTick()
  {
   double fiArray[];

   ArraySetAsSeries(fiArray,true);

   int fiDef = iForce(_Symbol,_Period,100,MODE_EMA,VOLUME_TICK);

   CopyBuffer(fiDef,0,0,3,fiArray);

   double fiVal = NormalizeDouble(fiArray[0],6);

   if(fiVal>0)
     {
      Comment("Bullish Movement","\n","Force Index Value is ",fiVal);
     }

   if(fiVal<0)
     {
      Comment("Bearish Movement","\n","Force Index Value is ",fiVal);
     }

  }
//+------------------------------------------------------------------+
Differences in this code are conditions of this strategy:
In case of bullish movement
   if(fiVal>0)
     {
      Comment("Bullish Movement","\n","Force Index Value is ",fiVal);
     }
In case of bearish movement
   if(fiVal<0)
     {
      Comment("Bearish Movement","\n","Force Index Value is ",fiVal);
     }
After compiling this code we will find the expert in the navigator window the same as the following:
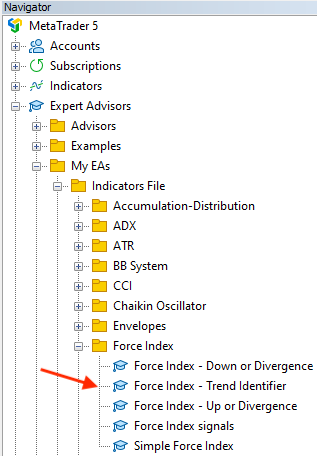
To execute this expert we will drag and drop it on the chart then we will find its window the same as the following:
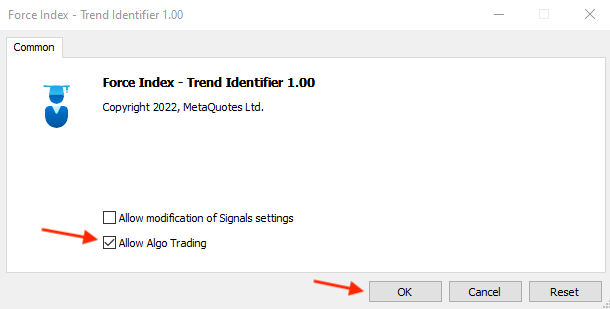
After pressing "OK" we will find that this expert will be attached to the chart the same as the following:
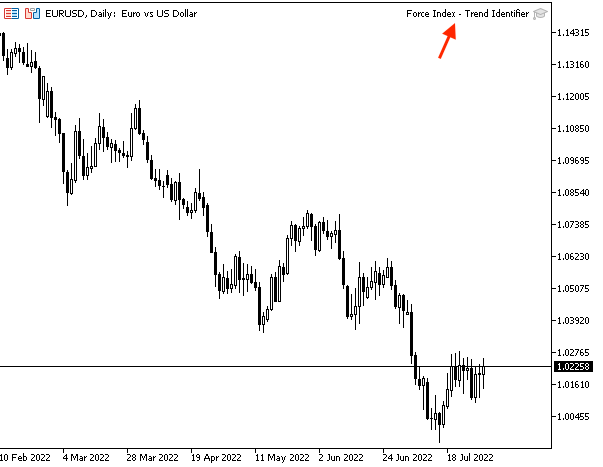
As we can in the top right of the chart that the expert is attached to the chart.
We can find generated signals based on this strategy the same as the following examples from testing.
In case of bullish movement:
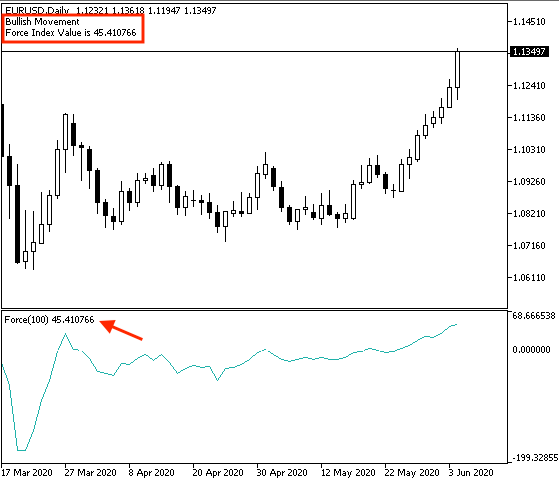
As we can see in the previous chart in the top left that we have a comment with bullish movement and the current value of the force index indicator.
In case of bearish movement:
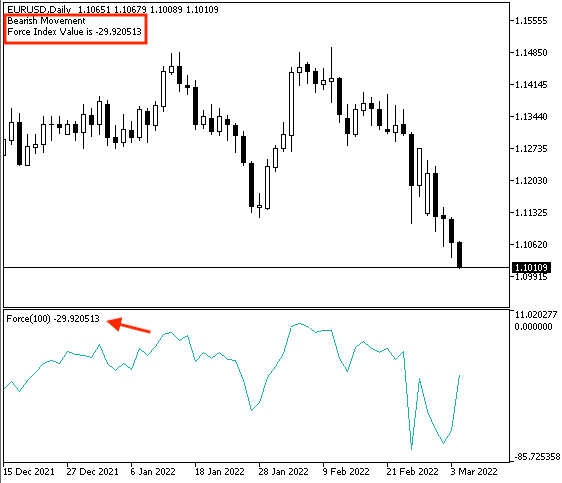
As we can see in the previous chart in the top left that we have a comment with bearish movement and the current value of the force index indicator.
- Strategy two: Force Index - Up or Divergence:
The following is how to code a trading system for this strategy.
//+------------------------------------------------------------------+
//|                               Force Index - Up or Divergence.mq5 |
//|                                  Copyright 2022, MetaQuotes Ltd. |
//|                                             https://www.mql5.com |
//+------------------------------------------------------------------+
#property copyright "Copyright 2022, MetaQuotes Ltd."
#property link      "https://www.mql5.com"
#property version   "1.00"
//+------------------------------------------------------------------+
void OnTick()
  {
   double fiArray[];
   MqlRates pArray[];

   ArraySetAsSeries(fiArray,true);
   int Data=CopyRates(_Symbol,_Period,0,3,pArray);

   int fiDef = iForce(_Symbol,_Period,13,MODE_EMA,VOLUME_TICK);

   CopyBuffer(fiDef,0,0,3,fiArray);

   double fiCurrentVal = NormalizeDouble(fiArray[0],6);
   double fiPrevVal = NormalizeDouble(fiArray[1],6);

   double currentHighVal=NormalizeDouble(pArray[2].high,6);
   double prevHighVal=NormalizeDouble(pArray[1].high,6);

   if(currentHighVal>prevHighVal && fiCurrentVal>fiPrevVal)
     {
      Comment("Strong up move","\n",
      "Current High is ",currentHighVal,"\n",
      "Previous High is ",prevHighVal,"\n",
      "Current Force Index Value is ",fiCurrentVal,"\n",
      "Previous Force Index Value is ",fiPrevVal);
     }

   if(currentHighVal>prevHighVal && fiCurrentVal<fiPrevVal)
     {
      Comment("Bearish Divergence","\n",
      "Current High is ",currentHighVal,"\n",
      "Previous High is ",prevHighVal,"\n",
      "Current Force Index Value is ",fiCurrentVal,"\n",
      "Previous Force Index Value is ",fiPrevVal);
     }

  }
//+------------------------------------------------------------------+
Differences in this code are:
Creating two arrays one for fiArray by using the "double" function as we did before and the other for pArray by using the "MqlRates" function which stores information about the prices, volumes, and spread.
   double fiArray[];
   MqlRates pArray[];
Sorting these created arrays, for fiArray we will use using the "ArraySetAsSeries" function the same as we learned before. For pArray, we will use the "CopyRates" function to get historical data of "MqlRates" and its parameters are:
- symbol name: we will use (_Symbol).
- timeframe: we will use (_Period).
- start time: we will use (0).
- stop time: we will use (3).
- rates array: we will use (pArray).
   ArraySetAsSeries(fiArray,true);
   int Data=CopyRates(_Symbol,_Period,0,3,pArray);
Defining current and previous values of the Force Index
   double fiCurrentVal = NormalizeDouble(fiArray[0],6);
   double fiPrevVal = NormalizeDouble(fiArray[1],6);
Defining current high and previous high values
   double currentHighVal=NormalizeDouble(pArray[2].high,6);
   double prevHighVal=NormalizeDouble(pArray[1].high,6);
Conditions of strategy
In case of strong up move:
   if(currentHighVal>prevHighVal && fiCurrentVal>fiPrevVal)
     {
      Comment("Strong up move","\n",
      "Current High is ",currentHighVal,"\n",
      "Previous High is ",prevHighVal,"\n",
      "Current Force Index Value is ",fiCurrentVal,"\n",
      "Previous Force Index Value is ",fiPrevVal);
     }
In case of bearish divergence
   if(currentHighVal>prevHighVal && fiCurrentVal<fiPrevVal)
     {
      Comment("Bearish Divergence","\n",
      "Current High is ",currentHighVal,"\n",
      "Previous High is ",prevHighVal,"\n",
      "Current Force Index Value is ",fiCurrentVal,"\n",
      "Previous Force Index Value is ",fiPrevVal);
     }
After compiling this code we will find it in the navigator window the same as the following:
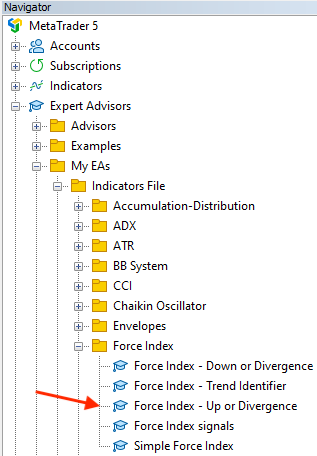
By dragging and dropping it on the chart we will find the window of this expert the same as the following:

After pressing "OK" we will find the expert is attached to the chart the same as the following:
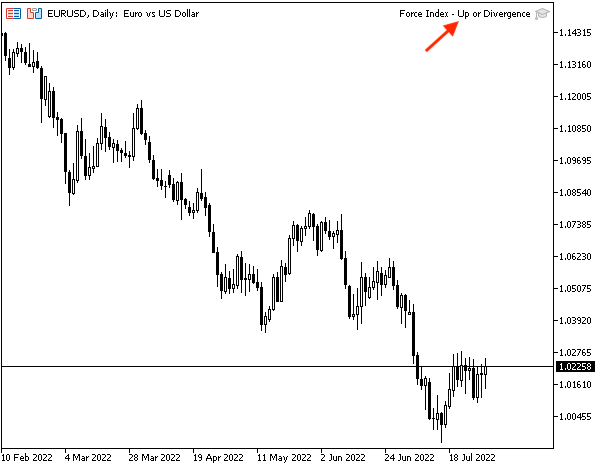
As we can see on the previous chart in the top right corner that the expert is attached.
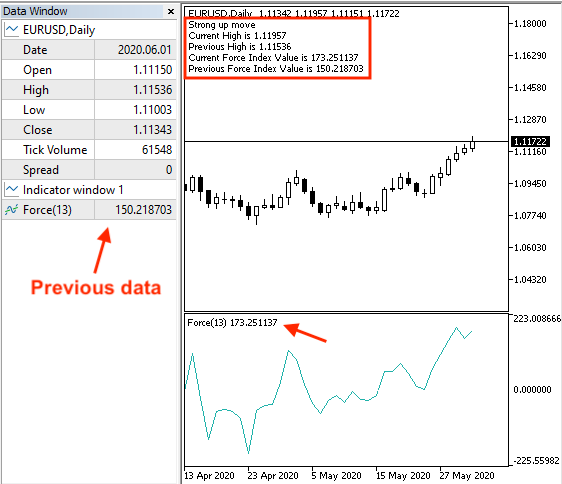
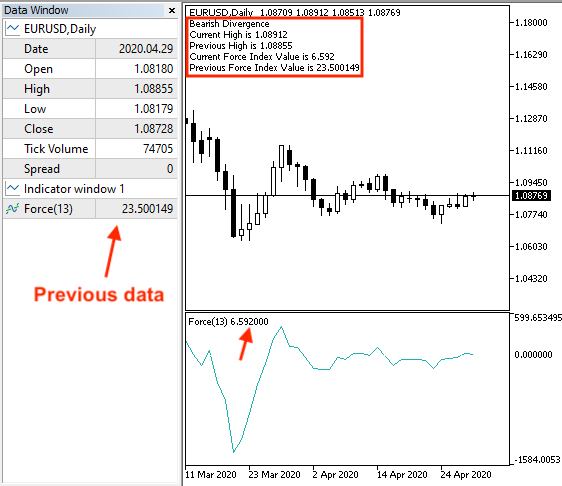
After that, we can get signals based on the market conditions if they matched with this strategy conditions. The following are examples from testing.
In case of strong up move with current data window:
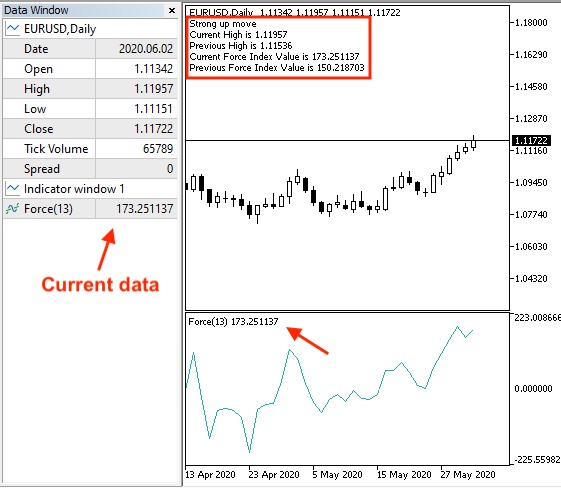
With previous data window:
In case of bearish divergence with current data window:
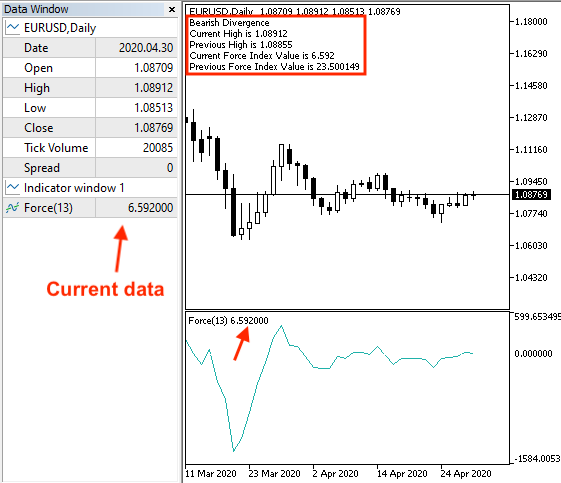
With previous data window:
- Strategy three: Force Index - Down or Divergence:
The following is for the full code to create a trading system based on this strategy:
//+------------------------------------------------------------------+
//|                             Force Index - Down or Divergence.mq5 |
//|                                  Copyright 2022, MetaQuotes Ltd. |
//|                                             https://www.mql5.com |
//+------------------------------------------------------------------+
#property copyright "Copyright 2022, MetaQuotes Ltd."
#property link      "https://www.mql5.com"
#property version   "1.00"
//+------------------------------------------------------------------+
void OnTick()
  {
   double fiArray[];
   MqlRates pArray[];

   ArraySetAsSeries(fiArray,true);
   int Data=CopyRates(_Symbol,_Period,0,3,pArray);

   int fiDef = iForce(_Symbol,_Period,13,MODE_EMA,VOLUME_TICK);

   CopyBuffer(fiDef,0,0,3,fiArray);

   double fiCurrentVal = NormalizeDouble(fiArray[0],6);
   double fiPrevVal = NormalizeDouble(fiArray[1],6);

   double currentLowVal=NormalizeDouble(pArray[2].low,6);
   double prevLowVal=NormalizeDouble(pArray[1].low,6);

   if(currentLowVal<prevLowVal && fiCurrentVal<fiPrevVal)
     {
      Comment("Strong down move","\n",
      "Current Low is ",currentLowVal,"\n",
      "Previous Low is ",prevLowVal,"\n",
      "Current Force Index Value is ",fiCurrentVal,"\n",
      "Previous Force Index Value is ",fiPrevVal);
     }

   if(currentLowVal<prevLowVal && fiCurrentVal>fiPrevVal)
     {
      Comment("Bullish Divergence","\n",
      "Current Low is ",currentLowVal,"\n",
      "Previous Low is ",prevLowVal,"\n",
      "Current Force Index Value is ",fiCurrentVal,"\n",
      "Previous Force Index Value is ",fiPrevVal);
     }

  }
//+------------------------------------------------------------------+
Differences in this code are:
Defining the current low and previous low values:
   double currentLowVal=NormalizeDouble(pArray[2].low,6);
   double prevLowVal=NormalizeDouble(pArray[1].low,6);
Conditions of this strategy:
In case of Strong down move:
   if(currentLowVal<prevLowVal && fiCurrentVal<fiPrevVal)
     {
      Comment("Strong down move","\n",
      "Current Low is ",currentLowVal,"\n",
      "Previous Low is ",prevLowVal,"\n",
      "Current Force Index Value is ",fiCurrentVal,"\n",
      "Previous Force Index Value is ",fiPrevVal);
     }
In case of bullish divergence:
   if(currentLowVal<prevLowVal && fiCurrentVal>fiPrevVal)
     {
      Comment("Bullish Divergence","\n",
      "Current Low is ",currentLowVal,"\n",
      "Previous Low is ",prevLowVal,"\n",
      "Current Force Index Value is ",fiCurrentVal,"\n",
      "Previous Force Index Value is ",fiPrevVal);
     }
After compiling this code we will find the expert of this trading system in the navigator window the same as the following:
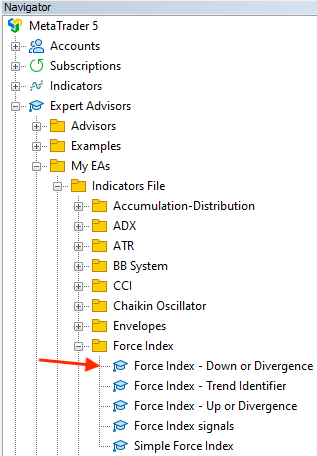
After dragging and dropping it on the chart we will find the window of this expert the same as the following:
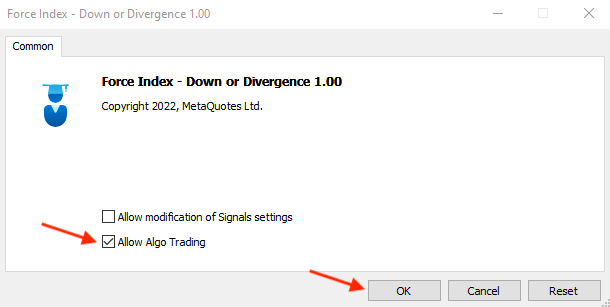
After pressing "OK" we will find the expert is attached to the chart the same as the following:
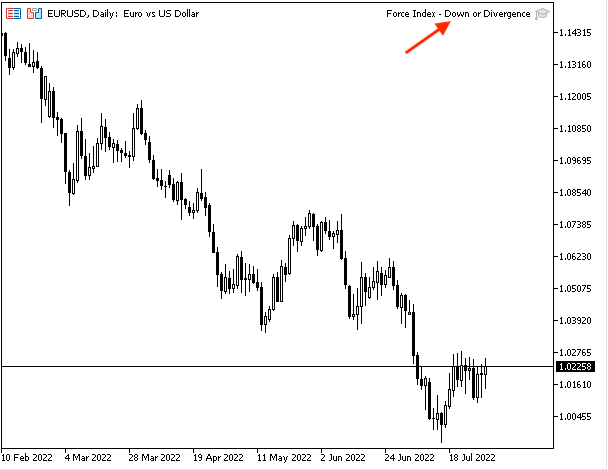
As we can see in the previous chart in the top right that the expert is attached.
Now, we can see generated signals based on this strategy the same as the following examples from testing.
In case of strong down with current data:
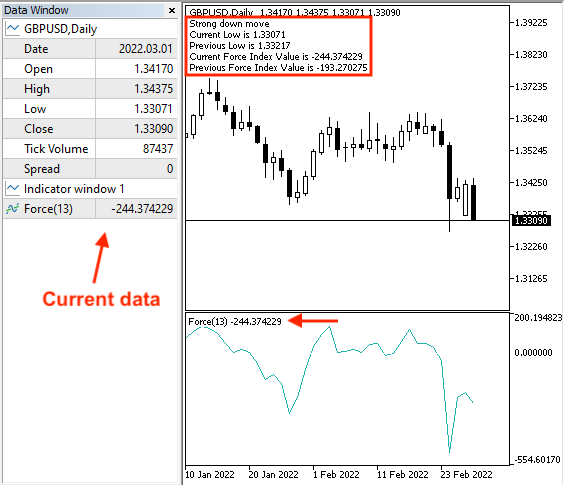
With previous data:
In case of bullish divergence with current data:
With previous data:
- Strategy four: Force Index signals:
The following is for the full code to create a trading system based on this strategy.
//+------------------------------------------------------------------+
//|                                          Force Index signals.mq5 |
//|                                  Copyright 2022, MetaQuotes Ltd. |
//|                                             https://www.mql5.com |
//+------------------------------------------------------------------+
#property copyright "Copyright 2022, MetaQuotes Ltd."
#property link      "https://www.mql5.com"
#property version   "1.00"
//+------------------------------------------------------------------+
//| Expert initialization function                                   |
//+------------------------------------------------------------------+
void OnTick()
  {
   double fiArray[];
   double maArray[];
   MqlRates pArray[];


   ArraySetAsSeries(fiArray,true);
   ArraySetAsSeries(maArray,true);


   int fiDef = iForce(_Symbol,_Period,13,MODE_EMA,VOLUME_TICK);
   int maDef = iMA(_Symbol,_Period,50,0,MODE_EMA,PRICE_CLOSE);
   int Data=CopyRates(_Symbol,_Period,0,3,pArray);

   CopyBuffer(fiDef,0,0,3,fiArray);
   CopyBuffer(maDef,0,0,3,maArray);

   double fiCurrentVal = NormalizeDouble(fiArray[0],6);
   double fiPrevVal = NormalizeDouble(fiArray[1],6);

   double maCurrentVal = NormalizeDouble(maArray[0],6);
   double closePrice = NormalizeDouble(pArray[2].close,6);


   if(closePrice>maCurrentVal && fiPrevVal<0 && fiCurrentVal>0)
     {
      Comment("Buy Signal","\n",
              "Current Closing Price ",closePrice,"\n",
              "EMA is ",maCurrentVal,"\n",
              "Current Force Index Value is ",fiCurrentVal,"\n",
              "Previous Force Index Value is ",fiPrevVal);
     }

   if(closePrice<maCurrentVal && fiPrevVal>0 && fiCurrentVal<0)
     {
      Comment("Sell Signal","\n",
              "Current Closing Price ",closePrice,"\n",
              "EMA is ",maCurrentVal,"\n",
              "Current Force Index Value is ",fiCurrentVal,"\n",
              "Previous Force Index Value is ",fiPrevVal);
     }

  }
//+------------------------------------------------------------------+
Differences in this code:
Creating three arrays for fiArray, maArray, and MqlRates
   double fiArray[];
   double maArray[];
   MqlRates pArray[];
Sorting Arrays of fiArray and maArray
   ArraySetAsSeries(fiArray,true);
   ArraySetAsSeries(maArray,true);
Defining fiDef for force index , maDef for moving average
   int fiDef = iForce(_Symbol,_Period,13,MODE_EMA,VOLUME_TICK);
   int maDef = iMA(_Symbol,_Period,50,0,MODE_EMA,PRICE_CLOSE);
Sorting pArray by the "CopyRates" function the same as we learned
int Data=CopyRates(_Symbol,_Period,0,3,pArray);
Filling arrays
   CopyBuffer(fiDef,0,0,3,fiArray);
   CopyBuffer(maDef,0,0,3,maArray);
Defining four values of current force index, previous force index, current moving average, and closing price
   double fiCurrentVal = NormalizeDouble(fiArray[0],6);
   double fiPrevVal = NormalizeDouble(fiArray[1],6);

   double maCurrentVal = NormalizeDouble(maArray[0],6);
   double closePrice = NormalizeDouble(pArray[2].close,6);
Conditions of strategy:
In case of buy signal:
   if(closePrice>maCurrentVal && fiPrevVal<0 && fiCurrentVal>0)
     {
      Comment("Buy Signal","\n",
              "Current Closing Price ",closePrice,"\n",
              "EMA is ",maCurrentVal,"\n",
              "Current Force Index Value is ",fiCurrentVal,"\n",
              "Previous Force Index Value is ",fiPrevVal);
     }
In case of sell signal:
   if(closePrice<maCurrentVal && fiPrevVal>0 && fiCurrentVal<0)
     {
      Comment("Sell Signal","\n",
              "Current Closing Price ",closePrice,"\n",
              "EMA is ",maCurrentVal,"\n",
              "Current Force Index Value is ",fiCurrentVal,"\n",
              "Previous Force Index Value is ",fiPrevVal);
     }
After compiling this code we will find it in the navigator window the same as the following:
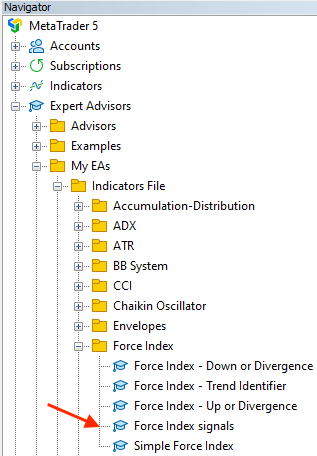
By dragging and dropping it on the chart we will find the window of this expert the same as the following:
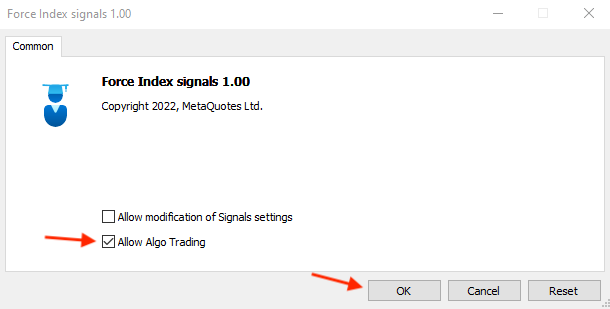
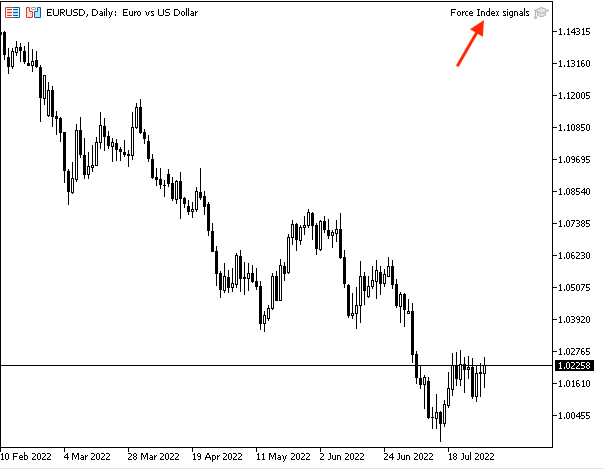
After pressing "OK" we will find the expert is attached to the chart the same as the following:
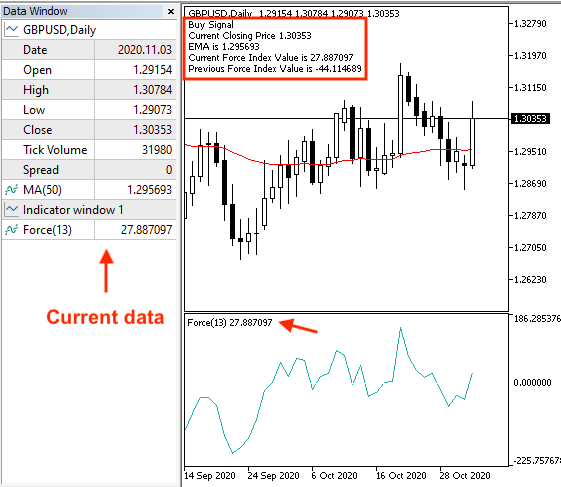
After that, we can find examples of generated signals from testing the same as the following.
In case of buy signal with current data:
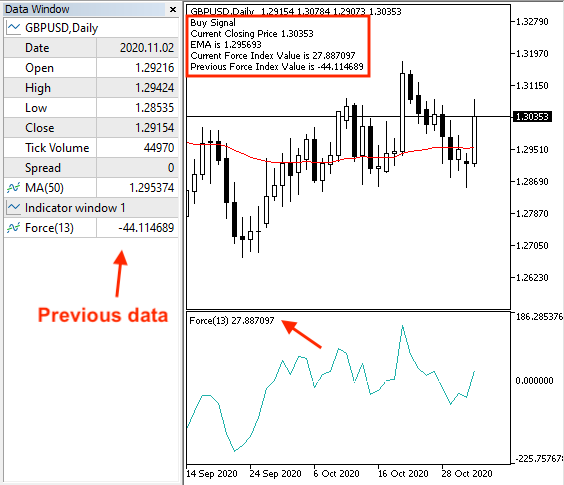
With previous data:
In case of sell signal with current data:
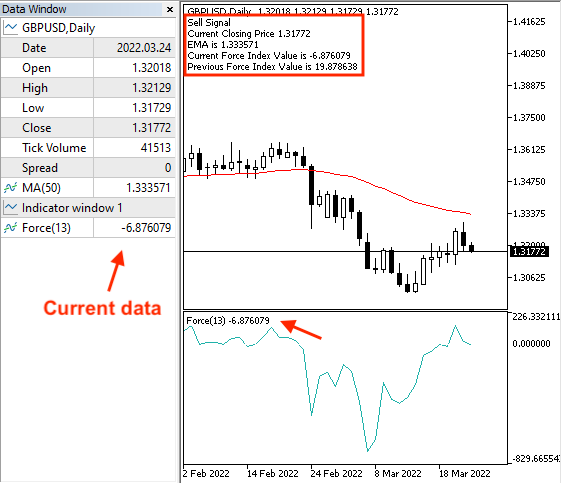
With previous data:
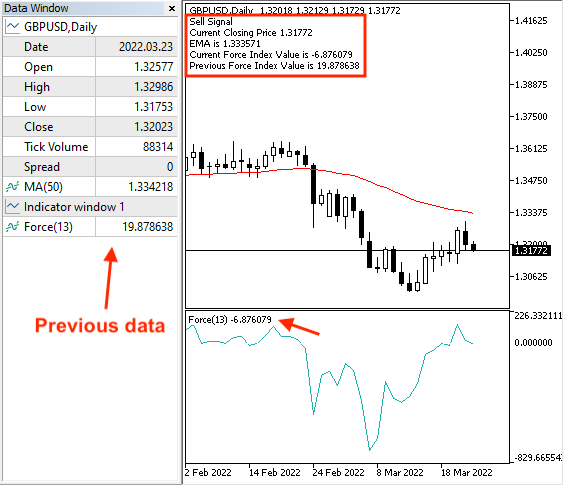
Conclusion
The Force Index indicator is a great technical tool that is giving us good insights into take a suitable decision. We covered this indicator through this article in detail and we learned what it is, what it measures, and how we can calculate it manually to understand the concept behind it. We learned also how we can use it through simple strategies which are:
- Force Index - Trend Identifier: to get signals of bullish and bearish movement.
- Force Index - Up or Divergence: to get signals of strong up move or bearish divergence.
- Force Index - Down or Divergence: to get signals of strong down move or bullish divergence.
- Force Index signals: to get buy or sell signals based on evaluating the closing price, force index value, and exponential moving average.
After that, we designed a step-by-step blueprint to create a trading system for each mentioned strategy and the importance of this step is helping us to create this trading system smoothly and effectively after organizing our ideas. We created a trading system for each mentioned strategy to be executed in the MetaTrader 5 to get automatic signals.
I need to confirm again here to make sure to test any strategy before using it on your real account to make sure that it is suitable for you as there is nothing suitable for everyone. I hope that you applied what you learned by yourself as practicing is a very important factor in any learning journey. I advise you also to think about how you can use this indicator with another technical tool in a way that enhances our decisions and trading results as this is one of the most amazing features of the technical analysis approach.In my opinion, it is important to learn or at least to give attention to programming as its importance increases day after day in different fields. When it comes to trading, programming has a lot of features that drive us to give attention to it the same as that programming saves our time by using programs that trade for us or at least what helps us to trade effectively. In addition to that programming helps to get accurate signals based on what we coded. The most beneficial thing is to reduce and avoid harmful emotions.
I hope that you find this article useful for you to enhance your trading result and get new ideas around this topic or any related topic. If you found this article useful and you want to read more similar articles, you can read my other articles in this series.
Warning: All rights to these materials are reserved by MetaQuotes Ltd. Copying or reprinting of these materials in whole or in part is prohibited.
This article was written by a user of the site and reflects their personal views. MetaQuotes Ltd is not responsible for the accuracy of the information presented, nor for any consequences resulting from the use of the solutions, strategies or recommendations described.
 Complex indicators made easy using objects
 Neural networks made easy (Part 17): Dimensionality reduction
- Free trading apps
- Over 8,000 signals for copying
- Economic news for exploring financial markets
You agree to website policy and terms of use