
Universal regression model for market price prediction (Part 2): Natural, technological and social transient functions

Introduction
As it turns out, the transient functions /1/ meant to analyze the material balance of the trading process are able to adequately describe other processes, both dynamic and static, in all areas of human life. The theory is based on three functions with three parameters. One of them (current C function) is differential, while two others are integral forms of the Gamma function distribution density. The past function P is obtained from C by integrating it from 0 to infinity with the n+1 parameter, while the future function F is used with the n parameter.
All three functions satisfy the normalization and material balance P+C+F=1 conditions with computer accuracy. Separately, each of them describes all conceivable and unthinkable regularities of natural or man-made origin since the Big Bang. The equations provided in the first article have been found for all parameters. The n parameter refers to the automatic control area, the tau parameter means time, temperature, concentration and similar concepts in their measurement units, while the D parameter unambiguously indicates the potential of a system or process. For example, in relation to a price, it indicates the maximum change amplitude.
There are three transient functions describing three stages of dynamic transients defined in the form of various modifications of the Gamma distribution function that determine the behavior of a studied parameter. In particular, the dependence of the market price on time in the past (P), current time (C) and future (F). Moreover, it was shown that their sum remains constant and equal to one at any moment of time. The current article is devoted to a more detailed study of this chain of three functions, conventionally called "PCF functions", and their role in establishing the patterns of the process flows occurring in nature and having both natural and technology-related character. Nevertheless, the main emphasis is to be placed on the study of trading processes, as well as creating and applying indicators based on them.
Natural, technology-related and social transient functions (PCF)
The image below shows the functions of the past (P), current (C) and future (F), as well as the function graphs demonstrating that their sum is always equal to one, i.e.
P+C+F=1:
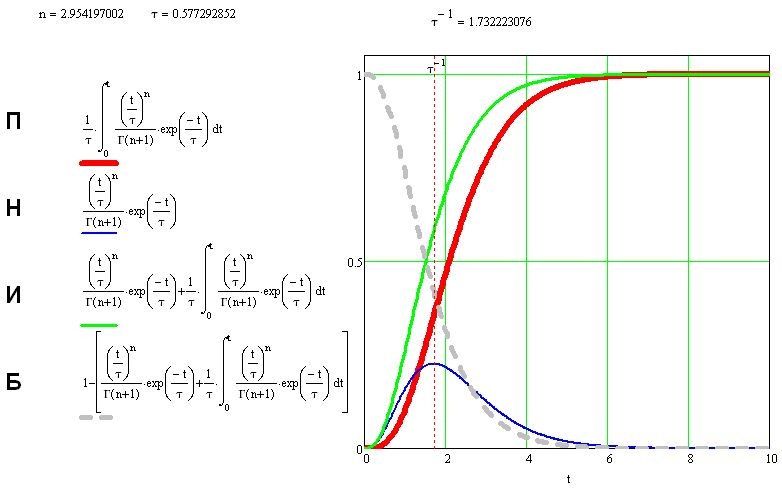
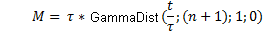
In this chain of functions, the current (C) function is the main one since all other functions are derived from it. P is obtained by integrating C. When deriving F, P is integrated by parts as shown in /1/. At the same time, applying the incomplete Euler's Gamma distribution yields the following:
![]() =past P
=past P
 =current C
 =future F
![]()
![]()
Eventually, we get:
F=1-(P+C)
Applying PCF functions in the oil, mining, metallurgy and power industries
PCF functions were successfully applied to forecast the dynamics of oil and gas extraction from the production well #5 of the Mahram field in Northern Tajikistan making it possible to detect hundreds of thousands of tons of oil in the production well area. Besides, PCF functions were used to describe the heap leaching of gold from the waste ores of the Hirshona production well belonging to JV Zeravshan LLC. Namely, it was proved that it is possible to additionally extract 13 kg of gold bringing the degree of its extraction to 91% without preliminary ore grinding. The functions were also successfully used in predicting economic indicators of the Republic of Tajikistan.
PCF was used as a basis for developing the math models of the ferrous metallurgy production dynamics, autoclave leaching of gold and silver from concentrate depending on various factors and gold ore flotation depending on the time and nature of various reagents in hydrometallurgy. Changes in the properties of heat-insulating composites featuring lime were also adequately described. PCF functions turned out to be extremely accurate in describing the dependence of dynamic patterns of the specific heat capacity of alloys, in particular Zn5Al alloyed with chromium, manganese and molybdenum, on temperature. This made it possible to obtain equations for defining the acceptable load factor of distribution and power transformers meant for continuous operation at different cooling agent temperatures.
PCF functions also demonstrated their capabilities when describing the microworld patterns. In particular, they accurately described the regularity of the mutual arrangement of interatomic planes in metal and mineral crystals, which makes it possible to identify them by the characteristic equations inherent in each metal and mineral. PCF equations also predicted 2019-nCov coronavirus spread, recoveries and deaths dynamics in China and the United States. This was a partial list of tasks, in which PCF showed its strength.
MetaTrader 4 and MetaTrader 5 indicators
PCF functions were used to develop the indicators /2,3/ for MetaTrader 4 and MetaTrader 5. You can find them in MQL5 CodeBase.
The indicator consists of three lines — Sell (red), Buy (blue) and trader line (yellow).
It predicts the expected price movement by analyzing the history in the form of a given retrospective.
When performing deals, we should adhere to the yellow line, which is the predominant line of price movement. It also indicates a possible trend change by jumping from one line to another at the stage of a trend formation.
After the trend has formed, all the lines are combined and show the trend target. The graph bifurcation indicates the unstable nature of the market.
The second indicator version shows entry signals according to the rule of all lines matching on the current bar and on history (the history depth is adjustable). You can choose the price the forecast is built for. By default, the version is set to use open prices. Therefore, the signal appears with the opening of a bar and does not change afterwards.
The third indicator version implements a "tracking" mode.

If there are many red arrows, they indicate the direction of a downtrend. If there are many blue arrows, they indicate the direction of an uptrend (the word "many" should always be used when there are more than one single-status orders. Otherwise, they should be recognized as a community of orders indicating a trend direction outside the bar but being unable to change a trend direction of future bars).
A single blue arrow among red ones indicates that an uptrend has been replaced by a downtrend according to the previous bar results. A single red arrow among blue ones indicates that a downtrend has been replaced by an uptrend according to the previous bar results. However, it is unable to change a trend of future bars.
When trading a basket of several currency pairs, a resonance phenomenon occurs in the market enriching or destroying any deposit.
Experimental EA trading a currency basket using a PCF-based indicator
Now let's see the results of an experiment aimed at arranging a real automated trading using a single order without SL and TP on all 33 available currency pairs, including gold and silver on D1 at a cent account with the lot of 0.06 by analyzing 300 last D1 history bars with the initial deposit of USD 98.
The experiment started with the balance, equity and system potential growth as shown on the graph below:
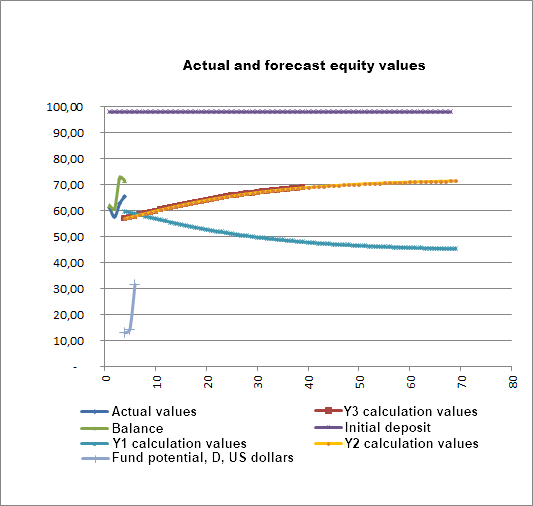
Trading went along the growing PCF Y1 line. However, PCF also exceeded the descending Y2 line, which indicates the likelihood of a decrease in equity in the future and, indeed, very soon the trading process switched to the descending PCF Y2 line:
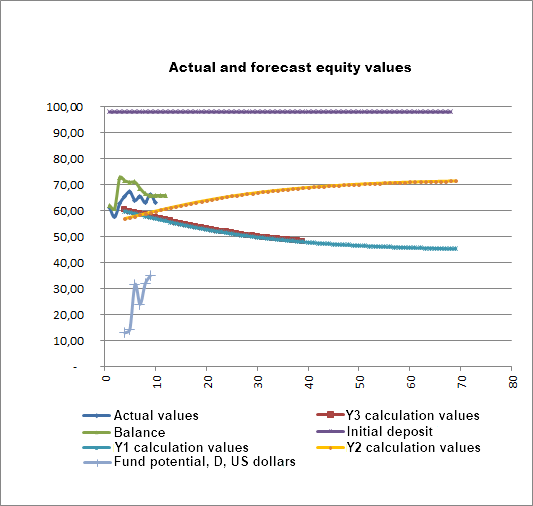
Further on, the trading process started following the descending Y2 line as shown on the graph:

According to the graph, the point 16 saw an event which dramatically changed the course of the trading process for the worse leading to an almost two-fold collapse in the potential of the D covered funds, from USD 76 to USD 42. The event led to a further decrease in equity down to USD 30 despite the increase in the potential of D covered funds up to USD 93.5. This increase eventually led to the recovery of funds:
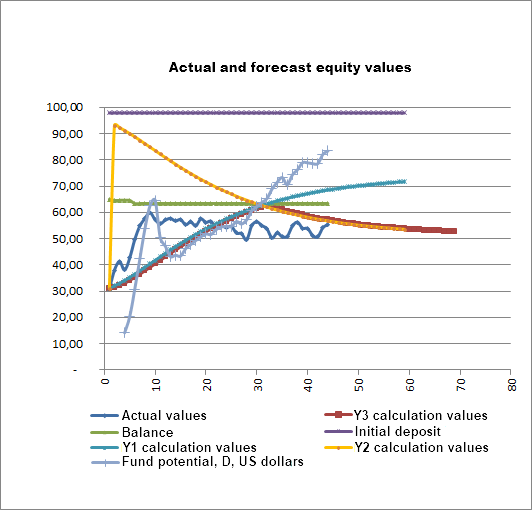
According to the graph, the funds recovery started from USD 30 and went along the ascending PCF Y1 line. At the same time, the possibility of an alternative scenario (reducing funds according to PCF Y2 descending line) remained. However, as the account funds were recovered, the trading process switched to PCF Y2 descending line while the balance remained relatively unchanged. The possibility of increasing equity along the SML Y1 line remains and the equity forecast excludes the threat of a deposit drain in the near future. This intermediate conclusion is a very important incentive for traders to conduct trading.
As shown in /1/, the PCF function describing the process dynamics depends on three factors — one parameter and two ratios. Let's try to clarify their roles in the trading process.
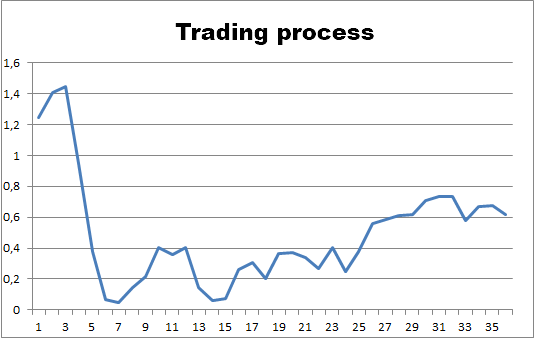
Trading process
The 'n' trading process remains the most mysterious factor. Its influence has not yet been fully revealed.
Trading process time constant
It turned out that every dynamic process in nature develops within the allocated time. This time is different for each process. It does not depend on "our" time. The pace of the process time is set by "Т time constant". If the process conditions remain unchanged during this time, T remains a constant, just like in the cases of static and steady processes (for example, electron orbits of minerals and metals mentioned above).
In real market conditions, the process pace changes and T changes accordingly. The reciprocal of Т is called the system impedance or the system resistance to the process. During the PCF development, I found the equations for defining T unambiguously. The influence of the T constant is shown below. Let's study the price dynamics or, in this case, changes in the equity depending on its value.
We can evaluate the influence by analyzing T and equity graphs. In the way as it is shown above, the equity graph tells a lot about its future values. According to the graph, the actual and forecast equity match. This ensures traders' confidence. Moreover, the increase in T leads to an increase in equity:

System potential
According to the above graphs, the current equity directly depends on the D system potential.
Conclusion
The detailed study of transient functions yielded three stages of dynamic transients defined in the form of various gamma distribution modifications. These modifications define the behavior of a studied parameter depending on the past (P), current (C) and future (F) periods from the start of its destabilization.
Moreover, it was shown that their sum remains constant and equal to one at any moment of time. The article was devoted to a more detailed study of this chain of three functions, conventionally called "PCF functions". Specific examples showed their role in establishing the patterns of the process flows occurring in nature and having both natural and technology-related character. PCF-based indicators are successfully applied in Forex trading.
Reference
- Sultonov Y., Universal regression model for market price prediction, https://www.mql5.com/en/articles/250;
- Sultonov's indicator for MetaTrader 4, https://www.mql5.com/ru/code/10339 (in Russian);
- Sultonov's indicator for MetaTrader 5, https://www.mql5.com/ru/code/32939 (in Russian);
- Experiment, https://www.mql5.com/ru/forum/367874 (in Russian).
Translated from Russian by MetaQuotes Ltd.
Original article: https://www.mql5.com/ru/articles/9868
Warning: All rights to these materials are reserved by MetaQuotes Ltd. Copying or reprinting of these materials in whole or in part is prohibited.
This article was written by a user of the site and reflects their personal views. MetaQuotes Ltd is not responsible for the accuracy of the information presented, nor for any consequences resulting from the use of the solutions, strategies or recommendations described.

 Combinatorics and probability for trading (Part IV): Bernoulli Logic
 Learn Why and How to Design Your Algorithmic Trading System
- Free trading apps
- Over 8,000 signals for copying
- Economic news for exploring financial markets
You agree to website policy and terms of use
He was trolled so much, I think he will not appear soon. And no one has been punished.
So he's been trolled, I don't think he'll show up anytime soon. And no one's been punished.
He drained his account using PNB, that's all.
He drained his account using PNB, that's all.
EOR can be used in different variations, so draining/not draining is not an argument for disappearance.
In the process of research I became convinced that mathematical models developed for analysing financial markets (taking into account non-stationarity of the market) are also relevant for other non-stationary processes.
In particular, information and behavioural systems, as well as technological processes. Of course, taking into account the peculiarities of each process.
The author of this article, in fact, shows examples of such universality of his methods.