
Building and testing Aroon Trading Systems
Introduction
In the field of trading and technical analysis, there are many tools that we can use, but definitely, we will not use them all and choose one or a combination of profitable tools after testing and optimizing them. The purpose of this article is to try to provide a method that can be helpful in this context or to give you an insight into a different point of view or an idea that you can apply and see which automated trading system suits you.
This type of article is very helpful to you because it can be consumed in a little time than you need to do the work by yourself to find a good setup of the trading system, but you still need to work after finding what is interesting for your way to dive more and optimize until reaching to the ultimate results that can be profitable for your trading. We just try to present here trading tools that can be used individually or in combination with other tools to save you time in finding what you need to focus on and develop it more in your favor. It also provides how to code these systems to be tested in the Strategy Tester, which means you can save a lot of time by automating your testing process instead of testing manually.
In this article, we are going to use the Aroon technical indicator and we are going to test more than one strategy based on its concepts and see its results, what will be much more valuable is that we are going to learn how we can code the indicator from MQL5 and use it in our trading system based on the strategy. All of this will happen after we have learned what the Aroon indicator is and how we can calculate and use it.
We will cover the following topics in this article:
- Aroon indicator definition
- Aroon strategies
- Aroon trading systems
- Testing Aroon trading systems
- Conclusion
After the previous topics we will be able to understand much more about the Aroon indicator, how we can use it, what we need to build a trading system, Aroon trading strategies, building trading systems based on these strategies and testing them, and see how much they are useful in trading.
It is important to mention here that you need to do your testing with different perspectives to get the best and better results that suit your trading style or your trading system if you are going to add any tool to your existing trading system because I can not get or provide all perspectives here as everyone is different and no one strategy or trading system is suitable for all traders but I can contribute with a part of them which can help save some time in your work.
Aroon indicator definition
In this part, we will identify the Aroon technical indicator to be able to understand its main concept. We will understand that through understanding how this indicator can be calculated and this approach can be helpful in our objective to understand the main concept of the indicator and not only using what is mentioned but to be able to develop our approach to use it appropriately.
The Aroon was created and designed by Tushar S. Chande in 1995. The main idea of the indicator is to detect the change in trend and also to measure the strength of the trend. The indicator can do this by measuring how much time has passed between highs and how much time has passed between lows over a period of time. By measuring this we can say that the strong uptrend is that we can see that it is regularly making new highs, but the strong downtrend is that it is regularly making new lows and the indicator gives us signals for this.
The Aroon indicator consists of two lines, the Aroon up, which measures the strength of the uptrend, and the Aroon down, which measures the strength of the downtrend. In this context, we can say that when the Aroon Up is above the Aroon Down, this indicates a bullish signal. When the Aroon Down is above the Aroon Up, it is a bearish signal. The Aroon indicators also move or oscillate between zero and 100 levels.
The following is about how we can calculate the Aroon technical indicator:
Aroon Up = 100 * ((n-H)/n)
Aroon Down = 100 * ((n-L)/n)
Where:
- Aroon Up: Expressed as a percentage of the total number of n-periods, it represents the number of periods since the last n-period high.
- Aroon Down: Expressed as a percentage of the total number of n-periods, it represents the number of periods since the last n-period low.
- H: the number of periods within a given time of n-periods since the last n-period high.
- L: the number of periods within a given time of n-periods since the last n-period low.
- n: the period.
Aroon strategies
In this part, we will mention two simple strategies to use the Aroon indicator based on its concept. These strategies will also be coded by MQL5 to be tested by the Strategy Tester and see the results of each one and compare between them, the same as we will see in the topic Testing Aroon Trading Systems.
We will use two main strategies the same as the following:
- Aroon Crossover Strategy
- Aroon Levels Strategy
Aroon Crossover Strategy:
Based on this strategy we need to place the order when the up and down lines of the Aroon indicator made crossover between each other. So, we need to place a buy order when we see that the up-line crossover is above the down line and place a sell order when we see the down-line crossover above the up line.
Upline > Downline ==> buy
Downline > Upline ==> sell
Aroon Levels Strategy:
Based on this strategy we need to place the order when the down line of the Aroon indicator makes a crossover with 10 and 50 levels of the Aroon indicator. So, we need to place a buy order when we see that the down line crossover is below the 10 level and place a sell order when we see the down line crossover above the 50 level of the Aroon indicator.
Downline < 10 ==> buy
Downline > 50 ==> sell
Aroon trading systems
In this part, we will learn how to code the mentioned Aroon strategies in MQL5 in order to test them with the Tester and evaluate their results. First of all, we need to code our Aroon custom indicator to be able to use it in our trading strategies, as shown below:
In the global scope of the MQL5, set the properties of the indicators using the property preprocessor
//properties of the indicator
#property indicator_separate_window // the place of the indicator
#property indicator_buffers 2 // number of buffers
#property indicator_plots 2 // number of plots

//up line
#property indicator_type1  DRAW_LINE      // type of the up values to be drawn is a line
#property indicator_color1 clrGreen       // up line color
#property indicator_style1 STYLE_DASH     // up line style
#property indicator_width1 2              // up line width
#property indicator_label1 "Up"           // up line label

// down line
#property indicator_type2  DRAW_LINE      // type of the down values to be drawn is a line
#property indicator_color2 clrRed         // down line color
#property indicator_style2 STYLE_DASH     // down line style
#property indicator_width2 2              // down line width
#property indicator_label2 "Down"         // down line label

// drawing some levels to be used later 10 and 50
#property indicator_level1 10.0
#property indicator_level2 50.0
#property indicator_levelcolor clrSilver
#property indicator_levelstyle STYLE_DOT
Creating two integer inputs for the indicator which are the period and the horizontal shift by using the input keyword
//inputs
input int                      periodInp = 25; // Period
input int                      shiftInp  = 0;  // horizontal shift
Creating two double arrays for up and down values of the indicator
//buffers of the indicator
double                         upBuffer[];
double                         downBuffer[];
In the OnInit(), Using the SetIndexBuffer function to link the indicator buffers with the double arrays the parameters are:
- index: to specify the buffer index, we will use 0 for the upBuffer and 1 for the downBuffer.
- buffer[]: to specify the array, we will use the upBuffer and downBuffer arrays.
- data_type: to specify the the data type that we need to store and it can be one of the ENUM_INDEXBUFFR_TYPE, we will use the INDICATOR_DATA for both up and down.
   SetIndexBuffer(0, upBuffer, INDICATOR_DATA);
   SetIndexBuffer(1, downBuffer, INDICATOR_DATA);
Setting the values of the corresponding property and the corresponding indicator lines of up and down by using the PlotIndexSetInteger function by using the variant of call indicating the identifier of the property and the parameters are the same as the following:
- plot_index: it is an integer value of the plotting style index, it will be 0 for up and 1 for down.
- prop_id:: it is an integer value of property identifier, it can be one of the ENUM_PLOT_PROPERTY_INTEGER. We will use PLOT_SHIFT for up and down values. We will use PLOT_DRAW_BEGIN for up and down.
- prop_value: it is an integer value to be set, it will be shiftInp for up and down, periodInp for up and down.
   PlotIndexSetInteger(0, PLOT_SHIFT, shiftInp);
   PlotIndexSetInteger(1, PLOT_SHIFT, shiftInp);
   PlotIndexSetInteger(0, PLOT_DRAW_BEGIN, periodInp);
   PlotIndexSetInteger(1, PLOT_DRAW_BEGIN, periodInp);
Setting the AS_SERIES flag to arrays for up and down
   ArraySetAsSeries(upBuffer, true);
   ArraySetAsSeries(downBuffer, true);
Setting the string name and the integer values of the indicator after declaring a string variable of indicatorName and assigning the StringFormat function to set the format of what we need to see in the indicator window
   string indicatorName = StringFormat("Aroon Indicator (%i,%i) - ", periodInp, shiftInp);
   IndicatorSetString(INDICATOR_SHORTNAME, indicatorName);
   IndicatorSetInteger(INDICATOR_DIGITS, 0);
Return the INIT_SUCCEEDED as a part of OnInit() event.
return INIT_SUCCEEDED;
OnCalculate event,
int OnCalculate(const int       rates_total,
                const int       prev_calculated,
                const datetime &time[],
                const double   &open[],
                const double   &high[],
                const double   &low[],
                const double   &close[],
                const long     &tick_volume[],
                const long     &volume[],
                const int      &spread[])
In the body of the event, we will calculate the indicator, returning 0 if there is not enough data
   if(rates_total < periodInp - 1)
      return (0);
Creating an integer count variable and calculate it to be the result of subtracting rate_total and prev_calculated
int count = rates_total - prev_calculated; If the prev_calculated is greater than 0 which means that we have new data then we will update the count by adding 1
   if(prev_calculated > 0)
      count++;
Creating another condition to update the count value
   if(count > (rates_total - periodInp + 1))
      count = (rates_total - periodInp + 1);
Creating a for loop to calculate and update the values of up and down of the indicator after calculating the highest and lowest values
   for(int i = count - 1; i >= 0; i--)
     {
      int highestVal   = iHighest(Symbol(), Period(), MODE_HIGH, periodInp, i);
      int lowestVal    = iLowest(Symbol(), Period(), MODE_LOW, periodInp, i);
      upBuffer[i]   = (periodInp - (highestVal - i)) * 100 / periodInp;
      downBuffer[i] = (periodInp - (lowestVal - i)) * 100 / periodInp;
     }
Returning rate_total as a part of the OnCalculate event
return (rates_total); So, the following is the full code for creating our Aroon custom indicator in one block of code
//+------------------------------------------------------------------+
//|                                                        Aroon.mq5 |
//+------------------------------------------------------------------+
#property indicator_separate_window // the place of the indicator
#property indicator_buffers 2 // number of buffers
#property indicator_plots 2 // number of plots
#property indicator_type1  DRAW_LINE      // type of the up values to be drawn is a line
#property indicator_color1 clrGreen       // up line color
#property indicator_style1 STYLE_DASH     // up line style
#property indicator_width1 2              // up line width
#property indicator_label1 "Up"           // up line label
#property indicator_type2  DRAW_LINE      // type of the down values to be drawn is a line
#property indicator_color2 clrRed         // down line color
#property indicator_style2 STYLE_DASH     // down line style
#property indicator_width2 2              // down line width
#property indicator_label2 "Down"         // down line label
#property indicator_level1 10.0
#property indicator_level2 50.0
#property indicator_levelcolor clrSilver
#property indicator_levelstyle STYLE_DOT
input int periodInp = 25; // Period
input int shiftInp  = 0;  // horizontal shift
double    upBuffer[];
double    downBuffer[];
int OnInit()
  {
   SetIndexBuffer(0, upBuffer, INDICATOR_DATA);
   SetIndexBuffer(1, downBuffer, INDICATOR_DATA);
   PlotIndexSetInteger(0, PLOT_SHIFT, shiftInp);
   PlotIndexSetInteger(1, PLOT_SHIFT, shiftInp);
   PlotIndexSetInteger(0, PLOT_DRAW_BEGIN, periodInp);
   PlotIndexSetInteger(1, PLOT_DRAW_BEGIN, periodInp);
   ArraySetAsSeries(upBuffer, true);
   ArraySetAsSeries(downBuffer, true);
   string indicatorName = StringFormat("Aroon Indicator (%i,%i) - ", periodInp, shiftInp);
   IndicatorSetString(INDICATOR_SHORTNAME, indicatorName);
   IndicatorSetInteger(INDICATOR_DIGITS, 0);
   return INIT_SUCCEEDED;
  }
int OnCalculate(const int       rates_total,
                const int       prev_calculated,
                const datetime &time[],
                const double   &open[],
                const double   &high[],
                const double   &low[],
                const double   &close[],
                const long     &tick_volume[],
                const long     &volume[],
                const int      &spread[])
  {
   if(rates_total < periodInp - 1)
      return (0);
   int count = rates_total - prev_calculated;
   if(prev_calculated > 0)
      count++;
   if(count > (rates_total - periodInp + 1))
      count = (rates_total - periodInp + 1);
   for(int i = count - 1; i >= 0; i--)
     {
      int highestVal   = iHighest(Symbol(), Period(), MODE_HIGH, periodInp, i);
      int lowestVal    = iLowest(Symbol(), Period(), MODE_LOW, periodInp, i);
      upBuffer[i]   = (periodInp - (highestVal - i)) * 100 / periodInp;
      downBuffer[i] = (periodInp - (lowestVal - i)) * 100 / periodInp;
     }
   return (rates_total);
  }
//+------------------------------------------------------------------+
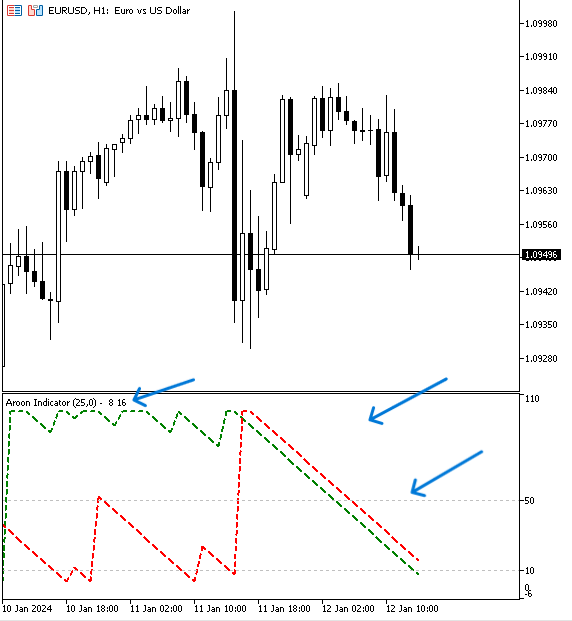
After compiling this code we will find our custom indicator the same as the following graph when inserting it into the chart
After creating our custom indicator we are ready to build our trading strategies. So, we will start with the first one which the Aroon crossover then the Aroon levels but before that we will create a simple program that can be able to display the Aroon values up and down and the following is a method to do that:
First, in the global scope, we will create two user inputs of the period and shift by using the input keyword
input int         periodInp = 25; // Period
input int         shiftInp  = 0; // Shift
Declare an integer variable for the aroon to assign the indicator handle to it later
int aroon; In the OnInit(), we will assign the iCustom function to attach or return the handle of the created Aroon custom indicator to the EA, parameters are the same as the following:
- Symbol: to specify the symbol name and we will use the _Symbol to return the current one.
- period: to specify the period and we will use _Period to return the current one also.
- name: to specify the exact name of your custom indicator with its exact directory of path in the Indicators folder.
- ... then we specify the list of input parameters of the custom indicator. We will use only our created two inputs (period and shift).
aroon = iCustom(_Symbol,PERIOD_CURRENT,"Aroon",periodInp,shiftInp);
Then, return the (INIT_SUCCEEDED) when the EA has been successfully initialized.
return(INIT_SUCCEEDED);
In the OnDeinit, we will print "EA is removed" by using the Print keyword when the Deinit event occurs to deinitialize the running MQL5 program.
void OnDeinit(const int reason)
  {
   Print("EA is removed");
  }
In the OnTick() event, we will declare two double arrays of upBuffer and downBuffer
double upBuffer[], downBuffer[]; Getting the created buffers data of the Aroon indicator by using the CopyBuffer function with the variant of calling by the first position and the number of required elements and its parameters are:
- indicator_handle: to specify the handle of the Aroon custom indicator.
- buffer_num: to specify the buffer number of the indicator.
- start_pos: to specify the position of starting to count.
- count: to specify the amount of count starting from the start_pos.
- buffer[]: to specify the target array.
   CopyBuffer(aroon,0,0,3,upBuffer);
   CopyBuffer(aroon,1,0,3,downBuffer);
Using the ArraySetAsSeries to set the AS_SERIES flag to the specified flag which will be true to reverse order of indexing of the arrays.
   ArraySetAsSeries(upBuffer,true);
   ArraySetAsSeries(downBuffer,true);
Declaring two double variables of upValue and downValue to assign the current values of the Aroon indicator from arrays by indexing [0]
   double upValue = upBuffer[0];
   double downValue = downBuffer[0];
Using the Comment function to output a comment on the chart with up and down values of the Aroon indicator
Comment("upValue: ",upValue,"\ndownValue: ",downValue);
The following is the full code in one block to do that:
//+------------------------------------------------------------------+
//|                                                AroonValuesEA.mq5 |
//+------------------------------------------------------------------+
input int         periodInp = 25; // Period
input int         shiftInp  = 0; // Shift
int aroon;
int OnInit()
  {
   aroon = iCustom(_Symbol,PERIOD_CURRENT,"Aroon",periodInp,shiftInp);
   return(INIT_SUCCEEDED);
  }
void OnDeinit(const int reason)
  {
   Print("EA is removed");
  }
void OnTick()
  {
   double upBuffer[], downBuffer[];
   CopyBuffer(aroon,0,0,3,upBuffer);
   CopyBuffer(aroon,1,0,3,downBuffer);
   ArraySetAsSeries(upBuffer,true);
   ArraySetAsSeries(downBuffer,true);
   double upValue = upBuffer[0];
   double downValue = downBuffer[0];
   Comment("upValue: ",upValue,"\ndownValue: ",downValue);
  }
//+------------------------------------------------------------------+
After compiling the code without errors and executing the EA on the chart we can find its output the same as the following example:
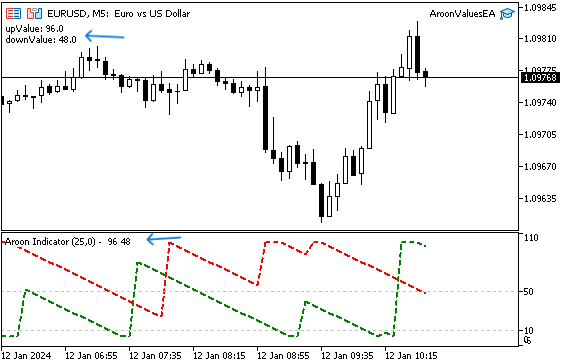
As we can see in the previous chart we can find the up and down values as a comment and we can find also the created custom indicator inserted into the chart to make sure that the EA returns the same values of the indicator (96, 48).
The Aroon crossover strategy:
Now, it is time to code our mentioned trading strategies, we will start with the Aroon crossover strategy.
In the global scope, we will use the #include preprocessor to include trading functions to our EA to place orders automatically based on our strategy
#include <trade/trade.mqh> Creating five inputs period, horizontal shift, lotSize, slLvl, and tpLvl and assign default values for each
input int         periodInp = 25; // Period
input int         shiftInp  = 0; // Shift
input double      lotSize=1;
input double      slLvl=200;
input double      tpLvl=600;
Creating the following variables:
- An integer (Aroon) variable to be used later for the indicator definition.
- An integer (barstotal) variable is to be used to limit opening orders for each bar.
- A CTrade trade object to be used in placing orders.
int aroon;
int barsTotal;
CTrade trade;
In the OnInit() event, we will define the declared (barsTotal) variable by using the iBars functions that return available bars of the symbol and period in history.
barsTotal=iBars(_Symbol,PERIOD_CURRENT);
Defining the Aroon variable by using iCustom to include our created Aroon custom indicator
aroon = iCustom(_Symbol,PERIOD_CURRENT,"Aroon",periodInp,shiftInp);
In the OnDeinit() event, we will print what refers to the EA removed
Print("EA is removed");
In the OnTick() event, we will declare an integer bars variable to store bars number for every tick
int bars=iBars(_Symbol,PERIOD_CURRENT);
Checking if the barsTotal is not equal to the bars
if(barsTotal != bars) Then, we will update the barsTotal with bars buffers
barsTotal=bars;
Declaring two double arrays of up and down, getting data of the buffers of the indicator, setting the AS_SERIES flag to the selected array, declaring, and defining four double variables for previous and current up and down values
      double upBuffer[], downBuffer[];
      CopyBuffer(aroon,0,0,3,upBuffer);
      CopyBuffer(aroon,1,0,3,downBuffer);
      ArraySetAsSeries(upBuffer,true);
      ArraySetAsSeries(downBuffer,true);
      double prevUpValue = upBuffer[1];
      double prevDownValue = downBuffer[1];
      double upValue = upBuffer[0];
      double downValue = downBuffer[0];
Then setting conditions of buy order which is that the prevUpValue is less than prevDownValue and at the same time upValue is greater than downValue
if(prevUpValue<prevDownValue && upValue>downValue) When this condition is met, declaring a double ask variable and defining it to be the current ask price of the current symbol, declaring and defining double slVal and tpVal, and placing a buy position with the predefined lotSize by user, on the current symbol, at the current ask price, stop loss will be the same predefined of slVal, and take profit will be the same predefined of tpVal
         double ask = SymbolInfoDouble(_Symbol,SYMBOL_ASK);
         double slVal=ask - slLvl*_Point;
         double tpVal=ask + tpLvl*_Point;
         trade.Buy(lotSize,_Symbol,ask,slVal,tpVal);
Then setting conditions of the sell order which is that the prevUpValue is greater than prevDownValue and at the same time upValue is less than downValue
if(prevUpValue>prevDownValue && upValue<downValue)When this condition is met, declaring a double bid variable and defining it to be the current bid price of the current symbol, declaring and defining double slVal and tpVal, and placing a sell position with the predefined lotSize by user, on the current symbol, at the current bid price, stop loss will be the same predefined of slVal, and take profit will be the same predefined of tpVal double bid = SymbolInfoDouble(_Symbol,SYMBOL_BID); double slVal=bid + slLvl*_Point; double tpVal=bid - tpLvl*_Point; trade.Sell(lotSize,_Symbol,bid,slVal,tpVal);
So, the following is the full code in one block to code the Aroon crossover strategy:
//+------------------------------------------------------------------+
//|                                             AroonCrossoverEA.mq5 |
//+------------------------------------------------------------------+
#include <trade/trade.mqh>
input int         periodInp = 25; // Period
input int         shiftInp  = 0; // Shift
input double      lotSize=1;
input double      slLvl=200;
input double      tpLvl=600;
int aroon;
int barsTotal;
CTrade trade;
int OnInit()
  {
   barsTotal=iBars(_Symbol,PERIOD_CURRENT);
   aroon = iCustom(_Symbol,PERIOD_CURRENT,"Aroon",periodInp,shiftInp);
   return(INIT_SUCCEEDED);
  }
void OnDeinit(const int reason)
  {
   Print("EA is removed");
  }
void OnTick()
  {
   int bars=iBars(_Symbol,PERIOD_CURRENT);
   if(barsTotal != bars)
     {
      barsTotal=bars;
      double upBuffer[], downBuffer[];
      CopyBuffer(aroon,0,0,3,upBuffer);
      CopyBuffer(aroon,1,0,3,downBuffer);
      ArraySetAsSeries(upBuffer,true);
      ArraySetAsSeries(downBuffer,true);
      double prevUpValue = upBuffer[1];
      double prevDownValue = downBuffer[1];
      double upValue = upBuffer[0];
      double downValue = downBuffer[0];
      if(prevUpValue<prevDownValue && upValue>downValue)
        {
         double ask = SymbolInfoDouble(_Symbol,SYMBOL_ASK);
         double slVal=ask - slLvl*_Point;
         double tpVal=ask + tpLvl*_Point;
         trade.Buy(lotSize,_Symbol,ask,slVal,tpVal);
        }
      if(prevUpValue>prevDownValue && upValue<downValue)
        {
         double bid = SymbolInfoDouble(_Symbol,SYMBOL_BID);
         double slVal=bid + slLvl*_Point;
         double tpVal=bid - tpLvl*_Point;
         trade.Sell(lotSize,_Symbol,bid,slVal,tpVal);
        }
     }
  }
//+------------------------------------------------------------------+
After compiling this code without any errors we can find samples of placing orders based on the strategy the same as the following:
Buy order example:
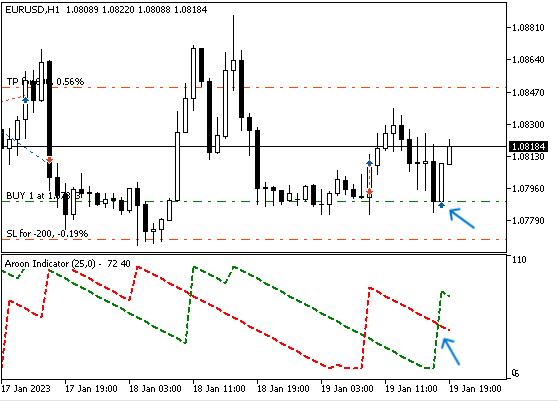
As we can see in the previous example we have a buy order after the crossover between the up and down lines.
Sell order example:
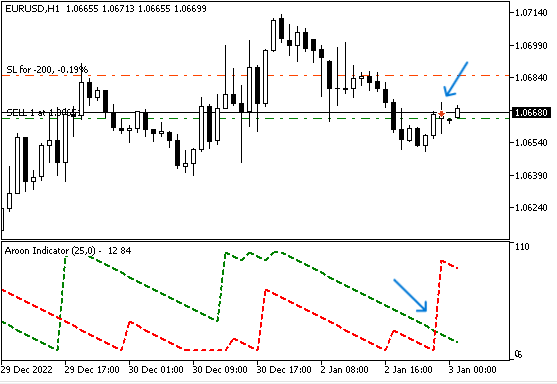
As we can see in the previous example we have a sell order after the down line made the crossover to up with the up line.
The Aroon levels strategy:
In this part, we will code the Aroon levels strategy mentioned in the Aroon strategies which will let the EA open order based on the crossover between down line with 10 and 50 levels of the Aroon indicator itself. The following is how we can code it in the MQL5. It is the same as what we coded in the Aroon crossover with some differences so we will provide the full code them mention only differences between this code and the previous code of the Aroon crossover strategy.
The following is the full code to code the Aroon levels strategy in one block of code:
//+------------------------------------------------------------------+
//|                                                AroonLevelsEA.mq5 |
//+------------------------------------------------------------------+
#include <trade/trade.mqh>
input int         periodInp = 25; // Period
input int         shiftInp  = 0; // Shift
input double      lotSize=1;
input double      slLvl=200;
input double      tpLvl=600;
int aroon;
int barsTotal;
CTrade trade;
int OnInit()
  {
   barsTotal=iBars(_Symbol,PERIOD_CURRENT);
   aroon = iCustom(_Symbol,PERIOD_CURRENT,"Aroon",periodInp,shiftInp);
   return(INIT_SUCCEEDED);
  }
void OnDeinit(const int reason)
  {
   Print("EA is removed");
  }
void OnTick()
  {
   int bars=iBars(_Symbol,PERIOD_CURRENT);
   if(barsTotal != bars)
     {
      barsTotal=bars;
      double upBuffer[], downBuffer[];
      CopyBuffer(aroon,0,0,3,upBuffer);
      CopyBuffer(aroon,1,0,3,downBuffer);
      ArraySetAsSeries(upBuffer,true);
      ArraySetAsSeries(downBuffer,true);
      double prevDownValue = downBuffer[1];
      double downValue = downBuffer[0];
      if(prevDownValue> 10 && downValue<10)
        {
         double ask = SymbolInfoDouble(_Symbol,SYMBOL_ASK);
         double slVal=ask - slLvl*_Point;
         double tpVal=ask + tpLvl*_Point;
         trade.Buy(lotSize,_Symbol,ask,slVal,tpVal);
        }
      if(prevDownValue < 50 && downValue>50)
        {
         double bid = SymbolInfoDouble(_Symbol,SYMBOL_BID);
         double slVal=bid + slLvl*_Point;
         double tpVal=bid - tpLvl*_Point;
         trade.Sell(lotSize,_Symbol,bid,slVal,tpVal);
        }
     }
  }
Differences in this code are the same as the following:
We need only to define the previous and the current values
      double prevDownValue = downBuffer[1];
      double downValue = downBuffer[0];
Condition of the strategy, if the prevDownValue is greater than the 10 level and at the same time the current downValue is less than the 10 level. We need the EA to place a buy order after defining the ask, stop loss, and take profit
      if(prevDownValue> 10 && downValue<10)
        {
         double ask = SymbolInfoDouble(_Symbol,SYMBOL_ASK);
         double slVal=ask - slLvl*_Point;
         double tpVal=ask + tpLvl*_Point;
         trade.Buy(lotSize,_Symbol,ask,slVal,tpVal);
        }
If the prevDownValue is less than the 50 level and at the same time the current downValue is greater than the 50 level. We need the EA to place a sell order after defining the current bid, stop loss, and take profit
      if(prevDownValue < 50 && downValue>50)
        {
         double bid = SymbolInfoDouble(_Symbol,SYMBOL_BID);
         double slVal=bid + slLvl*_Point;
         double tpVal=bid - tpLvl*_Point;
         trade.Sell(lotSize,_Symbol,bid,slVal,tpVal);
        }
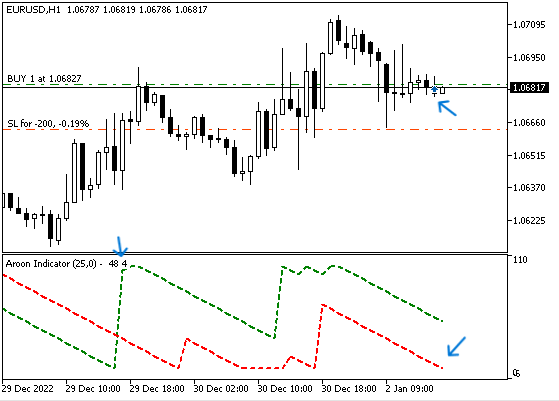
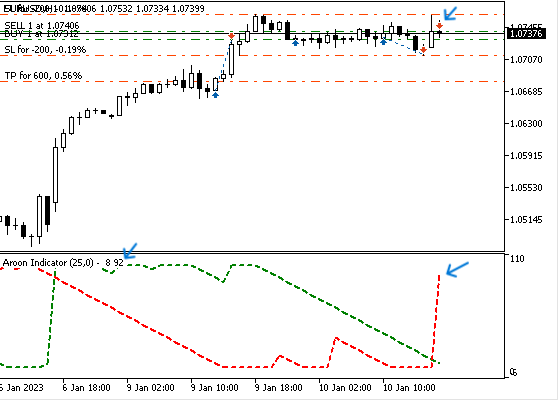
After compiling this code without any errors we can find that the EA can place orders the same as in the following examples:
Buy order example:
Sell order example:
Testing Aroon trading system
In this part, we will test each strategy to see its results and I cannot confirm enough that you may need more optimizations for these strategies to get better results, so you need to do your homework to see what suits your way or what can be more valuable.
We will focus on the following key measurements to make a comparison between the two:
- Net Profit: This is calculated by subtracting the gross loss from the gross profit. The highest value is the best.
- Balance DD relative: This is the maximum loss that the account experience during trades. The lowest is the best.
- Profit factor: This is the ratio of gross profit to gross loss. The highest value is the best
- Expected payoff: Which is the average profit or loss of a trade. The highest value is the best.
- Recovery factor: Which measures how well the tested strategy will recover after experiencing losses. The highest one is the best.
- Sharpe Ratio: It determines the risk and stability of the tested trading system by comparing the return versus the risk-free return. The highest Sharpe Ratio is the best.
We will also test the same period when testing both strategies and the period is one year from 1 January 2023 to 31 December 2023 and we will test two time frames, 15 minutes and one hour.
The Aroon crossover strategy:
Now we will start to see the results of the Aroon crossover strategy with two time frames 15 minutes and 1 hour to see which one is better based on what we will focus on from the previously mentioned figures.
Testing the strategy on 15 minutes timeframe:
The following graphs are for results:
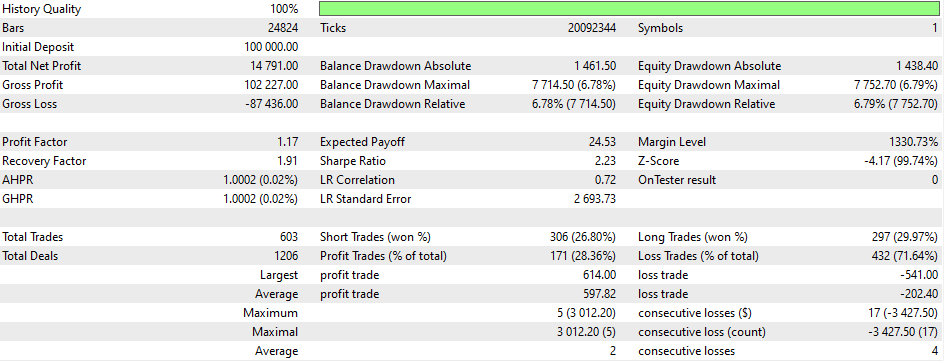
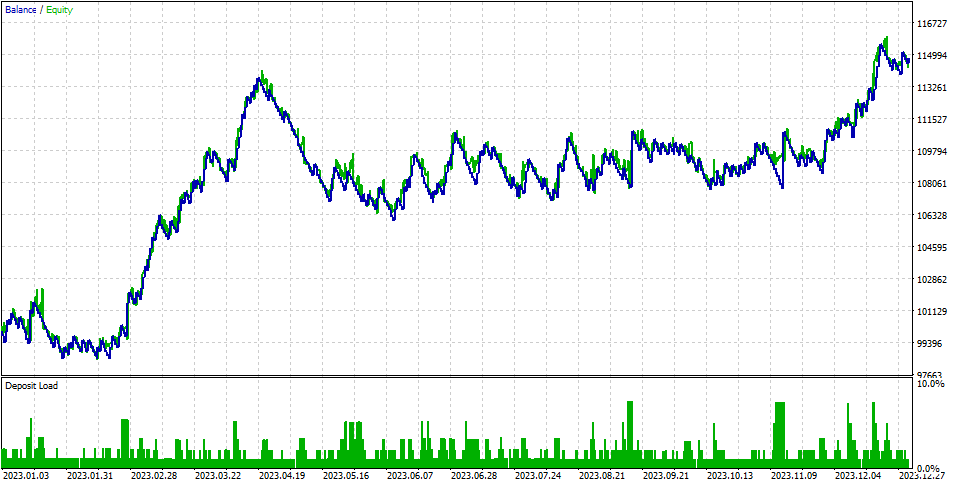
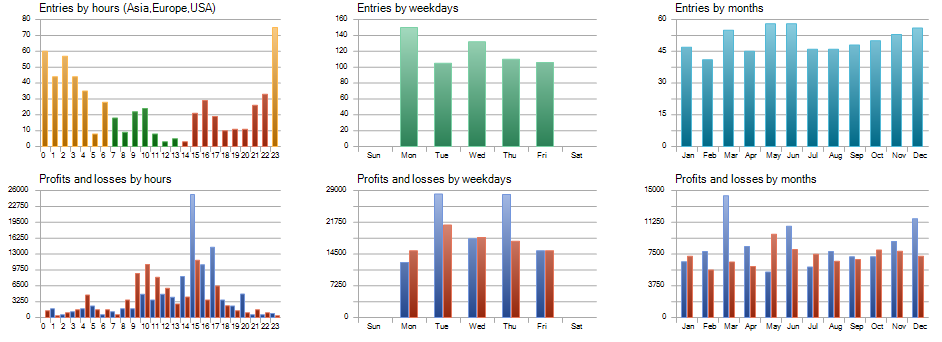
Based on the previous results, we have the following figures from this testing:
- Net Profit: 14791
- Balance DD Relative: 6.78%
- Profit Factor: 1.17
- Expected Payoff: 24.53
- Recovery Factor: 1.91
- Sharpe Ratio: 2.23
Testing the strategy on 1 hour timeframe:
 br>
br>
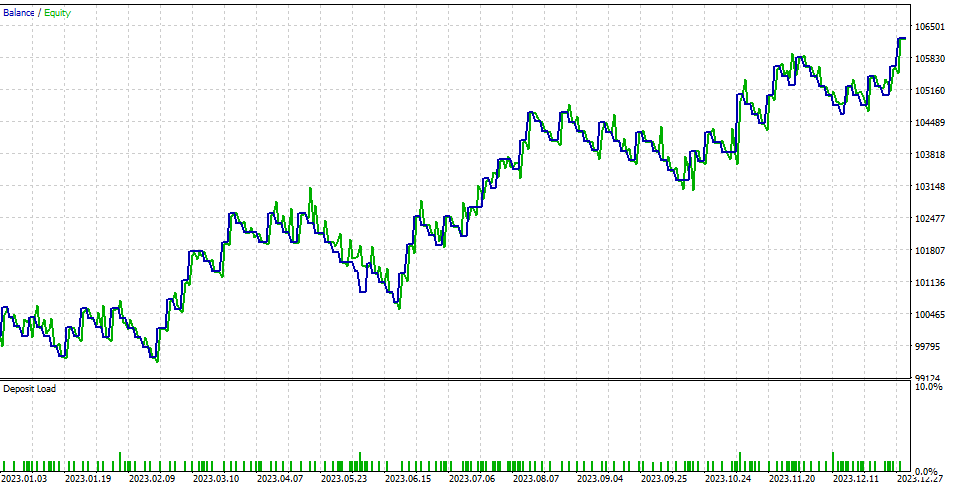
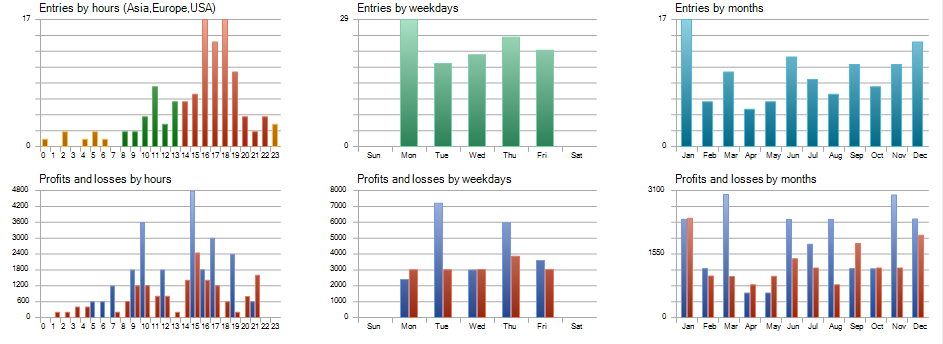
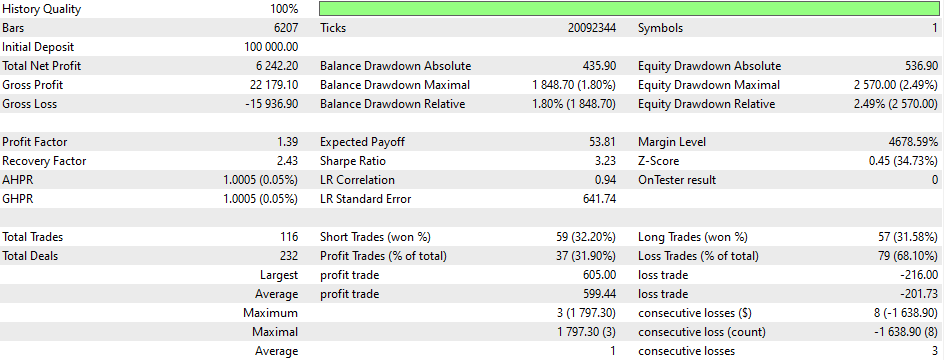
Based on the previous results, we have the following figures from this testing:
- Net Profit: 6242.20
- Balance DD Relative: 1.80%
- Profit Factor: 1.39
- Expected Payoff: 53.81
- Recovery Factor: 2.43
- Sharpe Ratio: 3.23
The Aroon Levels strategy:
In this part, we will test the Aroon levels strategy based on the same concept we will test the same strategy on two time frames 15 minutes and 1 hour to compare between the same figures for both of two time frames.
Testing the strategy on 15 minutes timeframe:
The following graphs are for the results of testing:
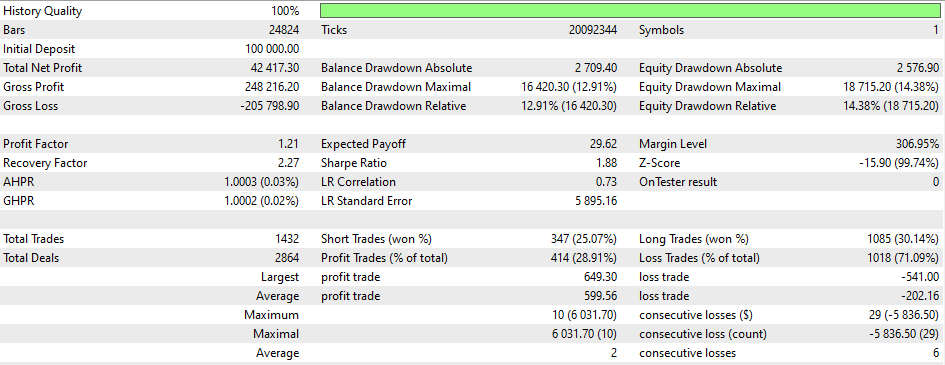
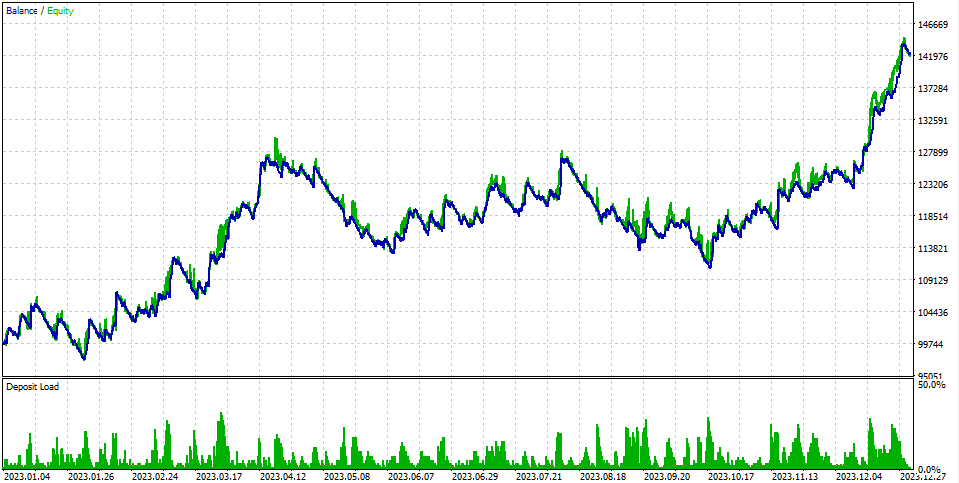
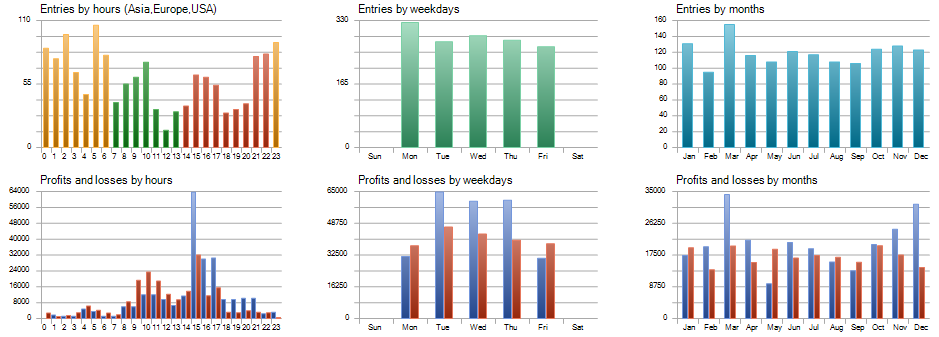
Based on the previous results, we have the following figures from this testing:
- Net Profit: 42417.30
- Balance DD Relative: 12.91%
- Profit Factor: 1.21
- Expected Payoff: 29.62
- Recovery Factor: 2.27
- Sharpe Ratio: 1.88
Testing the strategy on 1 hour timeframe:
The following graphs are for the results of testing:
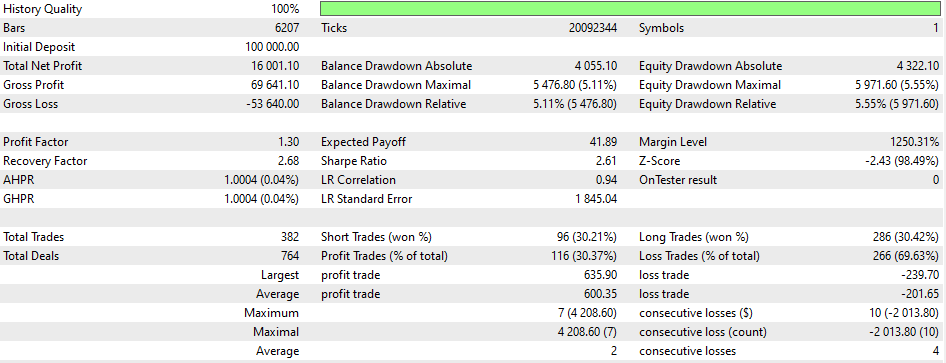
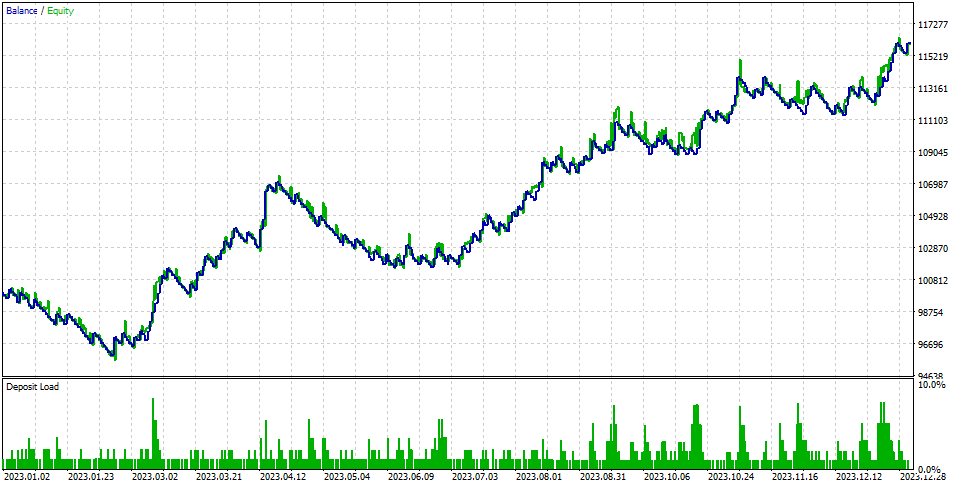
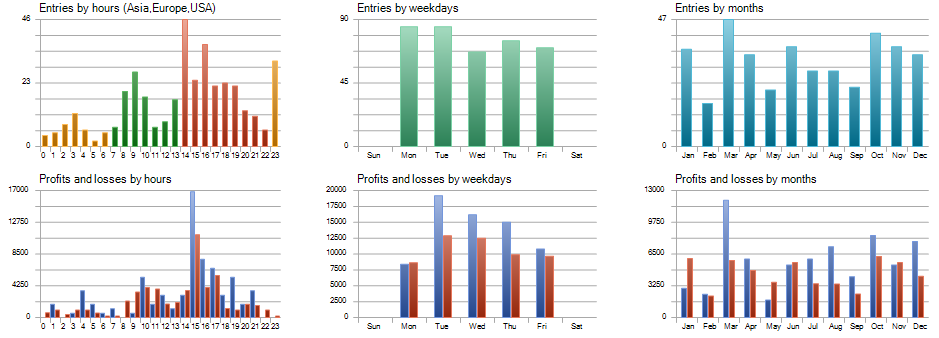
Based on the previous results, we have the following figures from this testing:
- Net Profit: 16001.10
- Balance DD Relative: 5.11%
- Profit Factor: 1.30
- Expected Payoff: 41.89
- Recovery Factor: 2.68
- Sharpe Ratio: 2.61
The following figure is for all results in one place for better comparison:

Based on the above, we can find the best figures that correspond to the strategy tested and the time frame the same as the following:
- Net Profit: The best higher figure (42417.30 USD) is shown with the Aroon levels strategy when tested on the 15-minute time frame.
- Balance DD Relative: The best lower figure (1.80%) is shown with the Aroon crossover strategy when tested on the 1-hour time frame.
- Profit Factor: The best higher figure (1.39) is shown with the Aroon crossover strategy when tested on the 1-hour time frame.
- Expected Payoff: The higher figure (53.81) is shown with the Aroon crossover strategy when tested on the 1-hour time frame.
- Recovery Factor: The higher figure (2.68) is shown with the Aroon levels strategy when tested on the 1-hour time frame.
- Sharpe Ratio: The higher figure (3.23) is shown with the Aroon crossover strategy when tested on the 1-hour time frame.
Using the previous figures, we can choose an appropriate strategy based on our trading objectives and which figures can achieve these objectives.
Conclusion
Building and testing a trading system is a crucial task for any trader who is serious about trading. In this article, we have tried to give an idea of the Aroon indicator, which can be used in any trading system, either on its own or in combination with other tools. This can be helpful for your trading or give you insights into building a good trading system.
We have identified the Aroon indicator in detail, how it can be used based on its main concept, and how we can calculate it. We have identified two simple strategies that can be used:
- Aroon crossover strategy: This strategy allows us to automatically place a buy position when the Aroon up line is above the Aroon down line, or a sell position when the Aroon down line is above the Aroon up line.
- Aroon levels strategy: This strategy lets us place a buy position if the Aroon down is below the 10 level of the indicator or place a sell position if the Aroon down is above the 50 level of the indicator automatically.
We coded these strategies by creating EA for each one, after creating our Aroon custom indicator by the MQL5 and coding a simple program that can generate Aroon Up and Aroon Down values on the chart by inserting the indicator into the chart, we tested them and identified important figures based on the results of testing for each strategy for two-time frames 15 minutes and 1 hour time frames. We can use them based on our trading objectives and the results of each strategy.
We also need to understand that these mentioned strategies may be found that we need more optimization and more effort to find better results. The main objective of this article is to share what we can do by sharing some ideas about different trading systems that can open our minds to build or develop better trading systems.
I hope you found this article useful in your trading and development journey to get better and more effective results, if you found this article interesting and you need to read more about building trading systems based on different strategies and different technical indicators you can read my previous articles by checking my publication page to find many articles in this regard about the most popular technical indicators and I hope you find them useful for you.
Warning: All rights to these materials are reserved by MetaQuotes Ltd. Copying or reprinting of these materials in whole or in part is prohibited.
This article was written by a user of the site and reflects their personal views. MetaQuotes Ltd is not responsible for the accuracy of the information presented, nor for any consequences resulting from the use of the solutions, strategies or recommendations described.
 How to create a simple Multi-Currency Expert Advisor using MQL5 (Part 6): Two RSI indicators cross each other's lines
 Deep Learning Forecast and ordering with Python and MetaTrader5 python package and ONNX model file
 Data label for time series mining (Part 6):Apply and Test in EA Using ONNX
- Free trading apps
- Over 8,000 signals for copying
- Economic news for exploring financial markets
You agree to website policy and terms of use