
Learn how to design a trading system by DeMarker

Introduction
This new article from our series is about learning how to design trading systems based on the most popular technical indicators. We will learn a new technical tool or indicator in detail that can be used in our favor in trading. This indicator is the DeMarker indicator, we will cover it through the following topics:
- DeMarker definition
- DeMarker strategy
- DeMarker strategy blueprint
- DeMarker trading system
- Conclusion
We will use the MetaTrader 5 trading terminal and MQL5 which is built-in in the terminal to write the trading system code and to test it. If you do not know how to download and use MetaTrader 5, you can read the Writing MQL5 code in MetaEditor topic from a previous article to learn more about that.
I advise you to apply what you learn in this article by yourself if you want to develop your trading and programming skills and get the maximum benefit because practice is a very important factor in any learning step. I like to mention and confirm that the main objective of mentioned strategies is to learn the main concept behind the indicator. So, the main objective is educational only and you must test any strategy before using it in a real account to make sure that it will be profitable or suitable for your trading.
Disclaimer: All information provided 'as is' only for educational purposes and is not prepared for trading purposes or advice. The information does not guarantee any kind of result. If you choose to use these materials on any of your trading accounts, you will do that at your own risk and you will be the only responsible.
DeMarker definition
If we want to identify and learn in more detail about the DeMarker indicator, we will need to learn what it is, what it measures, how we can calculate it, and how we can read it to use it in our favor. The DeMarker indicator is an oscillator technical tool and it was created by the technical analyst Thomas DeMark. It is clear that the name of this indicator is derived from its creator and it is also known as the "DeM" indicator. This technical indicator measures the demand for the instrument and evaluates the directional trend of the market by comparing the current maximum and minimum prices to the previous prices.
To calculate this indicator manually, we can do that by the following steps:
DMark (i) = SMA (DeMax, N) / (SMA (DeMax, N) + SMA (DeMin, N))
Where:
- DMark (i) = the current DeMark value.
- SMA = simple moving average
- DeMax = the maximum value of DeMark
- N = the used period
- DeMin = the minimum value of DeMark
The DeMax can be calculated by:
DeMax (i) = HIGH (i) - HIGH (i - 1)
Otherwise:
DeMax (i) = 0
The DeMin can be calculate by:
DeMin (i) = LOW (i - 1) - LOW (i)
Otherwise:
DeMin (i) = 0
After calculating the indicator, we can find that it produces an oscillator line between 0 to 1 to measure the demand of the instrument as we mentioned. Nowadays, we do not need to calculate it manually because it is built-in to the MetaTrader 5 trading platform and all we need is to choose it from the available indicators to insert it into the chart and read it.
Here is how we can insert this DeMarker technical indicator in MetaTrader 5:
While opening the MetaTrader 5 trading terminal, we will press Insert --> Indicators --> Oscillators --> DeMarker

After that, we will see the window of parameters of this indicator the same as the following:

1 - to determine the period.
2 - to set the color of the indicator's line.
3 - to set the indicator's line style.
4 - to set the indicator's line thickness.
After setting the previous parameters and pressing "OK", we will see the indicator inserted to the chart the same as the following:

As we see in the previous chart in the lower part, we have the indicator attached and we have an oscillator line between 0 and 1. We can read this indicator by determining the position of the line in the mentioned area. If the indicator approaches 0.70, it means that we have an overbought situation but if the indicator approaches 0.30, it means that we have an oversold situation.
DeMarker strategy
Now, we need to learn how we can use the DeMarker indicator based on the main concept behind it. So, we will learn how to use it by three simple strategies.
Based on this strategy, we need to get signals of strong or weak DeMarker by watching the DeMarker value and the last 5- period average of the indicator. If the current value of the DeMarker indicator is greater than the last 5- periods of DeMarker, this will be a signal of strength. In the other case, if the current value of the indicator is lower than the last 5- periods of DeMarker, this will be a signal of weakness.
Simply,
DeMarker value >= 5- period AVG of DeMarker --> DeMarker is strong
DeMarker value <= 5- period AVG of DeMarker --> DeMarker is weak
Based on this strategy, we need to get signals when the indicator reaches overbought and oversold zones. If the current DeMarker value is greater than or equal to the 0.70 level, this will be a signal of approaching an overbought zone. If the current value of DeMarker is lower than 0.30 level, this will be a signal of approaching an oversold zone.
Simply,
DeMarker value >= 0.70 --> Overbought
DeMarker value <= 0.30 --> Oversold
Based on this strategy, we need to get signals of bullish or bearish divergence which give an insight that there is a probability of changing the current movement. We need to get these signals by watching four values the current high, the previous high, the current DeMarker, and the previous DeMarker. It is good to mention that this is a simple situation of the divergence but the most effective one is when comparing and watching the highs and lows of prices with the highs and lows of the indicator. In this simple situation, we need to get a bearish divergence signal, if the current high is greater than the previous high at the same time that the current DeMarker is lower than the previous DeMarker value. In the other case, if the current low is lower than the previous low at the same time that the current DeMarker value is greater than the previous one, this will be a signal of bullish divergence.
Simply,
Current high > previous high, and, current DeMarker < previous one --> Bearish divergence
Current low < previous low, and, current DeMarker > previous one --> Bullish divergence
DeMarker strategy blueprint
After learning how to use the DeMarker indicator through simple strategies. In this topic, we will create a simple blueprint for each strategy to help us to create a trading system for it smoothly.
According to this strategy, we need to create a trading system that can be used to check two values automatically after creating or defining them. These values are the current DeMarker values and the last five DeMarker average values. If the current value is greater than the average, we need the trading system to return the following values as a comment on the chart:
- DeMarker is strong
- Current DeMarker value
- 5 -period AVG DeMarker value
In the other scenario, if the current value is lower than the average, we need the trading system to return the following values based on this condition:
- DeMarker is weak
- Current DeMarker value
- 5 -period AVG DeMarker value

According to this strategy, we need to create a trading system that can be used to generate our signals based on specific conditions. We need the trading system to check three values continuously which are the current DeMarker value, 0.70 level on the indicator, and 0.30 level on the indicator. If the current DeMarker value is greater than or equal to the 0.70 level, we need the trading system to return the following values as a comment on the chart:
- Overbought
- DeMarker value
In the other scenario, if the current DeMarker value is lower than or equal to the 0.30 level, we need the trading system to return the following values on the chart:
- Oversold
- DeMarker value

According to this strategy, we need to create a trading system that can be used to generate signals of bullish or bearish divergences by checking four values continuously. If the current high is greater than the previous high and at the same time, the current DeMarker value is lower than the previous DeMarker value, we need the trading system to return the following values as a comment on the chart:
- Bearish divergence
- Current Low value
- Previous Low value
- Current DeMarker value
- Previous DeMarker value
In the other scenario, if the current low is lower than the previous low at the same time, the current DeMarker value is greater than the previous DeMarker value, we need the system to return the following values on the chart:
- Bullish divergence
- Current high value
- Previous high value
- Current DeMarker value
- Previous DeMarker value

DeMarker trading system
In this part, we will create a trading system for each mentioned strategy t be executed in MetaTrader 5 to generate automation signals. First, we will create a simple trading system to be used as a base for all mentioned strategies. This system will generate the current value of the DeMarker indicator as a comment on the chart and the following is for how to create this system by the following lines of code:
Step one:
Create an array of deMarkerArray by using the "double" function that returns with fractions.
double deMarkerArray[]; Step two:
Use the "ArraySetAsSeries" function to set the AS_SERIES flag to the deMarkerArray, which returns a boolean value that is true or false.
ArraySetAsSeries(deMarkerArray,true);
Step three:
Define the indicator by using the "iDeMarker" function that returns the handle of the DeMarker indicator. Its parameters are:
- symbol: to determine the symbol, we will use (_Symbol) to be applied on the current symbol.
- period: to determine the period or time frame, we will use (_period) to be applied on the current time frame.
- ma_period: to determine the averaging period, we will use (14).
int deMarkerDef = iDeMarker(_Symbol,_Period,14);
Step four:
Get data from the buffer of the DeMarker indicator by using the "CopyBuffer" function. Its parameters are:
- indicator_handle: we will use the (deMarkerDef) of the predefined indicator handle.
- buffer_num: to determine the indicator buffer number, we will use (0).
- start_pos: to determine the starting position, we will use (0).
- count: to determine the amount to copy, we will use (3).
- buffer[]: to determine the target array to copy, we will use (deMarekerArray).
CopyBuffer(deMarkerDef,0,0,3,deMarkerArray);
Step five:
Defining the current deMarker value by using the "NormalizeDouble" function to return a value of double type. Its parameters are:
- value: to determine the normalized number.
- digits: to determine the number digits after the decimal.
double deMarkerVal = NormalizeDouble(deMarkerArray[0],6);
Step six:
Using the "comment" function to return the value of the current DeMarker indicator as a comment on the chart.
Comment("DeMarker Value is ",deMarkerVal);
If you want the full code of this trading system, you can see it the same as the following.
//+------------------------------------------------------------------+
//|                                       Simple DeMarker System.mq5 |
//|                                  Copyright 2022, MetaQuotes Ltd. |
//|                                             https://www.mql5.com |
//+------------------------------------------------------------------+
#property copyright "Copyright 2022, MetaQuotes Ltd."
#property link      "https://www.mql5.com"
#property version   "1.00"
//+------------------------------------------------------------------+void OnTick()
  void OnTick()
  {
   double deMarkerArray[];

   ArraySetAsSeries(deMarkerArray,true);

   int deMarkerDef = iDeMarker(_Symbol,_Period,14);

   CopyBuffer(deMarkerDef,0,0,3,deMarkerArray);

   double deMarkerVal = NormalizeDouble(deMarkerArray[0],6);

   Comment("DeMarker Value is ",deMarkerVal);

  }
//+------------------------------------------------------------------+
After compiling this code, we will find the expert in the navigator the same as the following:

By dragging and dropping the expert on the chart, we will find the window of it the same as the following:

After pressing "OK", we will find that the expert is attached to the chart the same as the following:

As we can see on the chart in the top right corner that the simple DeMarker System is attached to the chart, we are ready now to get the desired signals as per this strategy. The previous steps will be the same to compile all codes of the mentioned strategy to execute them in MetaTrader 5.
The following is for generated signals from testing as per this simple trading system:
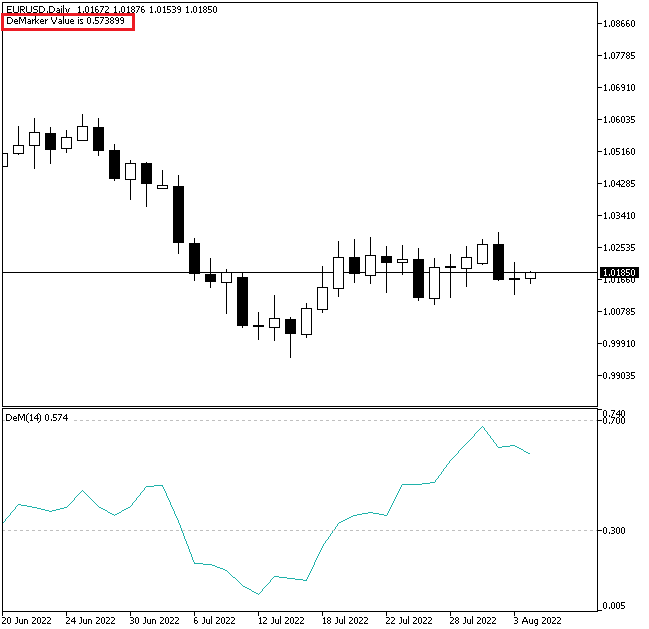
As we can see on the chart in the top left corner, we can see the DeMarker indicator's current value.
The following is the full code to create a trading system based on this strategy.
//+------------------------------------------------------------------+
//|                                            DeMarker Strength.mq5 |
//|                                  Copyright 2022, MetaQuotes Ltd. |
//|                                             https://www.mql5.com |
//+------------------------------------------------------------------+
#property copyright "Copyright 2022, MetaQuotes Ltd."
#property link      "https://www.mql5.com"
#property version   "1.00"
//+------------------------------------------------------------------+
void OnTick()
  {
   double deMarkerArray[];

   ArraySetAsSeries(deMarkerArray,true);

   int deMarkerDef = iDeMarker(_Symbol,_Period,14);

   CopyBuffer(deMarkerDef,0,0,6,deMarkerArray);

   double deMarkerVal = NormalizeDouble(deMarkerArray[0],4);
   double deMarkerVal1 = NormalizeDouble(deMarkerArray[1],4);
   double deMarkerVal2 = NormalizeDouble(deMarkerArray[2],4);
   double deMarkerVal3 = NormalizeDouble(deMarkerArray[3],4);
   double deMarkerVal4 = NormalizeDouble(deMarkerArray[4],4);
   double deMarkerVal5 = NormalizeDouble(deMarkerArray[5],4);

   double deMarkerAvgVal = (deMarkerVal1+deMarkerVal2+deMarkerVal3+deMarkerVal4+deMarkerVal5)/5;


   if(deMarkerVal>deMarkerAvgVal)
     {
      Comment("DeMarker is strong","\n",
              "Current DeMarker Value is ",deMarkerVal,"\n",
              "AVG DeMarker Value is ",deMarkerAvgVal);
     }

   if(deMarkerVal<deMarkerAvgVal)
     {
      Comment("DeMarker is weak","\n",
              "Current DeMarker Value is ",deMarkerVal,"\n",
              "AVG DeMarker Value is ",deMarkerAvgVal);
     }
  }
//+------------------------------------------------------------------+
Differences in this code:
Defining the last five deMarker values by using the "NormalizeDouble" function after defining the current deMarker value by using the same function.
   double deMarkerVal = NormalizeDouble(deMarkerArray[0],4);
   double deMarkerVal1 = NormalizeDouble(deMarkerArray[1],4);
   double deMarkerVal2 = NormalizeDouble(deMarkerArray[2],4);
   double deMarkerVal3 = NormalizeDouble(deMarkerArray[3],4);
   double deMarkerVal4 = NormalizeDouble(deMarkerArray[4],4);
   double deMarkerVal5 = NormalizeDouble(deMarkerArray[5],4);
Calculating deMarkerAvgVal based on the last five deMarker values by using the "double" function to create a variable of deMarkerAvgVal to be equal to the sum of the last five calculated values then divide them by 5 to get the average value.
double deMarkerAvgVal = (deMarkerVal1+deMarkerVal2+deMarkerVal3+deMarkerVal4+deMarkerVal5)/5;
Setting the conditions of the strategy
by comparing the current deMarker by the deMarkerAvg value. In the case of a strong signal of deMarker, we need to see that the current deMarker value is greater than the deMarkerAvg value. We will use the "If" function and its syntax:
if(expression) --> operator
In the case of a strong case, when the deMarkerVal is greater than the deMarkerAvgVal which is the expression in the syntax, we need the trading system to return a strength signal as a comment on the chart which is the operator.
   if(deMarkerVal>deMarkerAvgVal)
     {
      Comment("DeMarker is strong","\n",
              "Current DeMarker Value is ",deMarkerVal,"\n",
              "AVG DeMarker Value is ",deMarkerAvgVal);
     }
In case of weakness of the deMarker, we need to see that the current deMarker value is lower than the deMarker Avg value which is the expression then its operator is to return comment on the chart with the weakness and other values each value in a separate line.
   if(deMarkerVal<deMarkerAvgVal)
     {
      Comment("DeMarker is weak","\n",
              "Current DeMarker Value is ",deMarkerVal,"\n",
              "AVG DeMarker Value is ",deMarkerAvgVal);
     }
After compiling this code and executing it from the navigator the same as what we learned, we can see that the expert of this strategy is attached the same as the following:

As we can see in the top right corner, we have the expert of this strategy is attached to the chart and we're ready to get signals the same as the following examples from testing.
In case of strong signal:

As we can see on the chart in the top left corner, this trading system has generated a signal based on this trading strategy and it is the same as the following:
- DeMarker is strong --> because we have the current value of DeMarker above the last five average values of the DeMarker indicator.
- Current DeMarker value.
- AVG DeMarker value.
In case of weakness signal:

As we can see on the chart in the top left corner, we have a signal the same as the following:
- DeMarker is weak --> because we have the current value of DeMarker below the last five average values of the DeMarker indicator.
- Current DeMarker value.
- AVG DeMarker value.
The following is the full code of this strategy:
//+------------------------------------------------------------------+
//|                                       Simple DeMarker System.mq5 |
//|                                  Copyright 2022, MetaQuotes Ltd. |
//|                                             https://www.mql5.com |
//+------------------------------------------------------------------+
#property copyright "Copyright 2022, MetaQuotes Ltd."
#property link      "https://www.mql5.com"
#property version   "1.00"
//+------------------------------------------------------------------+void OnTick()
void OnTick()
  {
   double deMarkerArray[];

   ArraySetAsSeries(deMarkerArray,true);

   int deMarkerDef = iDeMarker(_Symbol,_Period,14);

   CopyBuffer(deMarkerDef,0,0,3,deMarkerArray);

   double deMarkerVal = NormalizeDouble(deMarkerArray[0],6);


   if(deMarkerVal<=0.30)
     {
      Comment("Oversold","\n",
              "DeMarker Value is ",deMarkerVal);
     }

   if(deMarkerVal>=0.70)
     {
      Comment("Overbought","\n",
              "DeMarker Value is ",deMarkerVal);
     }
   if(deMarkerVal>0.30 && deMarkerVal<0.70)
     {
      Comment("DeMarker Value is ",deMarkerVal);
     }

  }
//+------------------------------------------------------------------+
Differences in this code:
Conditions of this code.
In the case of an oversold signal, when the current value is lower than or equal to 0.30 which is the expression in the "if" function, it will be an oversold signal which is the operator that we need to see it as a comment on the chart.
   if(deMarkerVal<=0.30)
     {
      Comment("Oversold","\n",
              "DeMarker Value is ",deMarkerVal);
     }
In the case of an overbought signal which is the operator, this situation will exist when the current deMarker value is greater than or equal to 0.70 which is the expression.
   if(deMarkerVal>=0.70)
     {
      Comment("Overbought","\n",
              "DeMarker Value is ",deMarkerVal);
     }
In case of no signal or balance (expression), it will be signaled when the current deMarker value is between 0.30 and 0.70 (operator).
   if(deMarkerVal>0.30 && deMarkerVal<0.70)
     {
      Comment("DeMarker Value is ",deMarkerVal);
     }
After compiling this code and executing this expert, we will find it is attached to the chart the same as the following:

Now, we're ready to receive signals based on this strategy and the following are examples from testing.
In case of overbought:

As we can see in the previous chart in the top left corner, the generated signal is the same as the following:
- Overbought
- DeMarker current value
In case of oversold:

As we can see, the generated signal is the same as the following:
- Oversold
- DeMarker current value
In case of no signal or balance:

As we can see, we got a generated signal of DeMarker current value.
The following is the full code to create a trading system for this strategy.
//+------------------------------------------------------------------+
//|                                          DeMarker Divergence.mq5 |
//|                                  Copyright 2022, MetaQuotes Ltd. |
//|                                             https://www.mql5.com |
//+------------------------------------------------------------------+
#property copyright "Copyright 2022, MetaQuotes Ltd."
#property link      "https://www.mql5.com"
#property version   "1.00"
//+------------------------------------------------------------------+
void OnTick()
  {
   double deMarkerArray[];
   MqlRates pArray[];


   ArraySetAsSeries(deMarkerArray,true);
   ArraySetAsSeries(pArray,true);

   int deMarkerDef = iDeMarker(_Symbol,_Period,14);
   int pData = CopyRates(_Symbol,_Period,0,14,pArray);

   CopyBuffer(deMarkerDef,0,0,14,deMarkerArray);

   double deMarkerVal = NormalizeDouble(deMarkerArray[0],4);
   double deMarkerPrevVal = NormalizeDouble(deMarkerArray[1],4);

   double currentHigh = NormalizeDouble(pArray[0].high,6);
   double currentLow = NormalizeDouble(pArray[0].low,6);
   double prevHigh = NormalizeDouble(pArray[1].high,6);
   double prevLow = NormalizeDouble(pArray[1].low,6);

   if(currentHigh>prevHigh && deMarkerVal<deMarkerPrevVal)
     {
      Comment("Bearish divergence","\n",
              "Current High is ",currentHigh,"\n",
              "Prev. High Value is ",prevHigh,"\n",
              "Current DeMarker Value is ",deMarkerVal,"\n",
              "Prev. DeMarker Value is ",deMarkerPrevVal);
     }
   if(currentLow<prevLow && deMarkerVal>deMarkerPrevVal)
     {
      Comment("Bullish divergence","\n",
              "Current Low is ",currentLow,"\n",
              "Prev. Low Value is ",prevLow,"\n",
              "Current DeMarker Value is ",deMarkerVal,"\n",
              "Prev. DeMarker Value is ",deMarkerPrevVal);
     }

  }
//+------------------------------------------------------------------+
Differences in this code.
Creating two arrays, one for deMarkerArray by using the "double" function, the other one for pArray (prices) by using the "MqlRates" function to store information of price, volume, and spread.
   double deMarkerArray[];
   MqlRates pArray[];
Setting the AS_SERIES flag for these two created arrays.
   ArraySetAsSeries(deMarkerArray,true);
   ArraySetAsSeries(pArray,true);
Defining deMarketDef, pData
   int deMarkerDef = iDeMarker(_Symbol,_Period,14);
   int pData = CopyRates(_Symbol,_Period,0,14,pArray);
Filling deMarkerArray
CopyBuffer(deMarkerDef,0,0,14,deMarkerArray);
Defining deMarkerVal, deMarkerPrevVal, current high, current low, prev. high, and prev. low
   double deMarkerVal = NormalizeDouble(deMarkerArray[0],4);
   double deMarkerPrevVal = NormalizeDouble(deMarkerArray[1],4);

   double currentHigh = NormalizeDouble(pArray[0].high,6);
   double currentLow = NormalizeDouble(pArray[0].low,6);
   double prevHigh = NormalizeDouble(pArray[1].high,6);
   double prevLow = NormalizeDouble(pArray[1].low,6);
Conditions of the strategy.
In case of bearish divergence:
   if(currentHigh>prevHigh && deMarkerVal<deMarkerPrevVal)
     {
      Comment("Bearish divergence","\n",
              "Current High is ",currentHigh,"\n",
              "Prev. High Value is ",prevHigh,"\n",
              "Current DeMarker Value is ",deMarkerVal,"\n",
              "Prev. DeMarker Value is ",deMarkerPrevVal);
     }
In case of bullish divergence:
   if(currentLow<prevLow && deMarkerVal>deMarkerPrevVal)
     {
      Comment("Bullish divergence","\n",
              "Current Low is ",currentLow,"\n",
              "Prev. Low Value is ",prevLow,"\n",
              "Current DeMarker Value is ",deMarkerVal,"\n",
              "Prev. DeMarker Value is ",deMarkerPrevVal);
     }
After compiling this code also, we can find it in the navigator to execute it. Then we will find it attached to the chart the same as the following:

As we can see in the top left corner of the previous chart that we have the expert attached to the chart and now, we can receive signals from this expert based on this trading strategy the same as the following.
In case of bullish divergence:

As we can see in top left corner in the previous chart, we have the following generated signal:
- Bullish divergence
- Current high value
- Previous high value
- Current DeMarker value
- Previous DeMarker value
In case of bearish divergence:

As we can see in the top left corner of the previous chart, we have the following generated signal:
- Bearish divergence
- Current high value
- Previous high value
- Current DeMarker value
- Previous DeMarker value
Conclusion
According to what you learned in this article, it is supposed that you already identified this DeMarker technical indicator in detail because we learned what it is, what it measures, how we can calculate it, and how we can read and use it through simple strategies based on the main concept behind it. These simple strategies were:
- DeMarker strength: to receive signals of strength or weakness based on the position of the current DeMarker and the last 5- period average of the DeMarker value.
- DeMarker, OB - OS: to receive signals of overbought or oversold based on the position of current DeMarker value in its scale from 0 to 1.
- DeMarker divergence: to receive signals of bullish or bearish divergences based on the position of current DeMarker, previous DeMarker, current high, and previous high.
In addition to that, we designed a step-by-step blueprint for each mentioned strategy to help us to create a trading system for it smoothly. Then, we learned the most interesting topic because we created a trading system based on what we designed in the blueprints of mentioned strategies to receive signals automatically by the MetaTrader 5.
I confirm again that you must test any strategy before using it to make that it is suitable for your trading because there is no something suitable for all people. I hope that you find this article useful for you and got useful insights about the topic of the article or any related topics if you want to read more similar articles you can read my previous articles in this series for beginners about the most technical indicators and how we can create a simple trading system based on them.
Warning: All rights to these materials are reserved by MetaQuotes Ltd. Copying or reprinting of these materials in whole or in part is prohibited.
This article was written by a user of the site and reflects their personal views. MetaQuotes Ltd is not responsible for the accuracy of the information presented, nor for any consequences resulting from the use of the solutions, strategies or recommendations described.

 CCI indicator. Upgrade and new features
 Neural networks made easy (Part 19): Association rules using MQL5
 Developing a trading Expert Advisor from scratch (Part 21): New order system (IV)
- Free trading apps
- Over 8,000 signals for copying
- Economic news for exploring financial markets
You agree to website policy and terms of use