Articles with MQL5 programming examples
Access a huge collection of articles with code examples showing how to create indicators and trading robots for the MetaTrader platform in the MQL5 language. Source codes are attached to the articles, so you can open them in MetaEditor and run them to see how the applications work.
These articles will be useful both for those who have just started exploring automated trading and for professional traders with programming experience. They feature not only examples, but also contain new ideas.
Add a new article

You are missing trading opportunities:
- Free trading apps
- Over 8,000 signals for copying
- Economic news for exploring financial markets
Registration
Log in
You agree to website policy and terms of use
If you do not have an account, please register

Timeseries in DoEasy library (part 46): Multi-period multi-symbol indicator buffers
In this article, I am going to improve the classes of indicator buffer objects to work in the multi-symbol mode. This will pave the way for creating multi-symbol multi-period indicators in custom programs. I will add the missing functionality to the calculated buffer objects allowing us to create multi-symbol multi-period standard indicators.

From Novice to Expert: Support and Resistance Strength Indicator (SRSI)
In this article, we will share insights on how to leverage MQL5 programming to pinpoint market levels—differentiating between weaker and strongest price levels. We will fully develop a working, Support and Resistance Strength Indicator (SRSI).

Price Action Analysis Toolkit Development (Part 26): Pin Bar, Engulfing Patterns and RSI Divergence (Multi-Pattern) Tool
Aligned with our goal of developing practical price-action tools, this article explores the creation of an EA that detects pin bar and engulfing patterns, using RSI divergence as a confirmation trigger before generating any trading signals.

Tracing, Debugging and Structural Analysis of Source Code
The entire complex of problems of creating a structure of an executed code and its tracing can be solved without serious difficulties. This possibility has appeared in MetaTrader 5 due to the new feature of the MQL5 language - automatic creation of variables of complex type of data (structures and classes) and their elimination when going out of local scope. The article contains the description of the methodology and the ready-made tool.
Indicator for Spindles Charting
The article regards spindle chart plotting and its usage in trading strategies and experts. First let's discuss the chart's appearance, plotting and connection with japanese candlestick chart. Next we analyze the indicator's implementation in the source code in the MQL5 language. Let's test the expert based on indicator and formulate the trading strategy.

Trade transactions. Request and response structures, description and logging
The article considers handling trade request structures, namely creating a request, its preliminary verification before sending it to the server, the server's response to a trade request and the structure of trade transactions. We will create simple and convenient functions for sending trading orders to the server and, based on everything discussed, create an EA informing of trade transactions.
Other classes in DoEasy library (Part 70): Expanding functionality and auto updating the chart object collection
In this article, I will expand the functionality of chart objects and arrange navigation through charts, creation of screenshots, as well as saving and applying templates to charts. Also, I will implement auto update of the collection of chart objects, their windows and indicators within them.
Graphical Interfaces XI: Refactoring the Library code (build 14.1)
As the library grows, its code must be optimized again in order to reduce its size. The version of the library described in this article has become even more object-oriented. This made the code easier to learn. A detailed description of the latest changes will allow the readers to develop the library independently based on their own needs.
Graphics in DoEasy library (Part 81): Integrating graphics into library objects
It is time to start the integration of the already created objects into the previously created library objects. This will ultimately endow each library object with its own graphical object allowing users to interact with the program.

Price Action Analysis Toolkit Development (Part 39): Automating BOS and ChoCH Detection in MQL5
This article presents Fractal Reaction System, a compact MQL5 system that converts fractal pivots into actionable market-structure signals. Using closed-bar logic to avoid repainting, the EA detects Change-of-Character (ChoCH) warnings and confirms Breaks-of-Structure (BOS), draws persistent chart objects, and logs/alerts every confirmed event (desktop, mobile and sound). Read on for the algorithm design, implementation notes, testing results and the full EA code so you can compile, test and deploy the detector yourself.

Graphical Interfaces VIII: The Tree View Control (Chapter 2)
The previous chapter of part VIII on graphical interfaces has focused on the elements of static and drop-down calendar. The second chapter will be dedicated to an equally complex element — a tree view, that is included in every complete library used for creating graphical interfaces. A tree view implemented in this article contains multiple flexible settings and modes, thus allowing to adjust this element of control to your needs.

Develop a Proof-of-Concept DLL with C++ multi-threading support for MetaTrader 5 on Linux
We will begin the journey to explore the steps and workflow on how to base development for MetaTrader 5 platform solely on Linux system in which the final product works seamlessly on both Windows and Linux system. We will get to know Wine, and Mingw; both are the essential tools to make cross-platform development works. Especially Mingw for its threading implementations (POSIX, and Win32) that we need to consider in choosing which one to go with. We then build a proof-of-concept DLL and consume it in MQL5 code, finally compare the performance of both threading implementations. All for your foundation to expand further on your own. You should be comfortable building MT related tools on Linux after reading this article.

From Novice to Expert: Developing a Liquidity Strategy
Liquidity zones are commonly traded by waiting for the price to return and retest the zone of interest, often through the placement of pending orders within these areas. In this article, we leverage MQL5 to bring this concept to life, demonstrating how such zones can be identified programmatically and how risk management can be systematically applied. Join the discussion as we explore both the logic behind liquidity-based trading and its practical implementation.
Library for easy and quick development of MetaTrader programs (part VI): Netting account events
In the previous articles, we started creating a large cross-platform library simplifying the development of programs for MetaTrader 5 and MetaTrader 4 platforms. In the fifth part of the article series, we created trading event classes and the event collection, from which the events are sent to the base object of the Engine library and the control program chart. In this part, we will let the library to work on netting accounts.

Complex indicators made easy using objects
This article provides a method to create complex indicators while also avoiding the problems that arise when dealing with multiple plots, buffers and/or combining data from multiple sources.
Timeseries in DoEasy library (part 45): Multi-period indicator buffers
In this article, I will start the improvement of the indicator buffer objects and collection class for working in multi-period and multi-symbol modes. I am going to consider the operation of buffer objects for receiving and displaying data from any timeframe on the current symbol chart.

Building a Spectrum Analyzer
This article is intended to get its readers acquainted with a possible variant of using graphical objects of the MQL5 language. It analyses an indicator, which implements a panel of managing a simple spectrum analyzer using the graphical objects. The article is meant for readers acquianted with basics of MQL5.
Graphics in DoEasy library (Part 89): Programming standard graphical objects. Basic functionality
Currently, the library is able to track standard graphical objects on the client terminal chart, including their removal and modification of some of their parameters. At the moment, it lacks the ability to create standard graphical objects from custom programs.

Statistical Estimations
Estimation of statistical parameters of a sequence is very important, since most of mathematical models and methods are based on different assumptions. For example, normality of distribution law or dispersion value, or other parameters. Thus, when analyzing and forecasting of time series we need a simple and convenient tool that allows quickly and clearly estimating the main statistical parameters. The article shortly describes the simplest statistical parameters of a random sequence and several methods of its visual analysis. It offers the implementation of these methods in MQL5 and the methods of visualization of the result of calculations using the Gnuplot application.

Monte Carlo Permutation Tests in MetaTrader 5
In this article we take a look at how we can conduct permutation tests based on shuffled tick data on any expert advisor using only Metatrader 5.

DIY technical indicator
In this article, I will consider the algorithms allowing you to create your own technical indicator. You will learn how to obtain pretty complex and interesting results with very simple initial assumptions.
Graphics in DoEasy library (Part 94): Moving and deleting composite graphical objects
In this article, I will start the development of various composite graphical object events. We will also partially consider moving and deleting a composite graphical object. In fact, here I am going to fine-tune the things I implemented in the previous article.

Growing Neural Gas: Implementation in MQL5
The article shows an example of how to develop an MQL5-program implementing the adaptive algorithm of clustering called Growing neural gas (GNG). The article is intended for the users who have studied the language documentation and have certain programming skills and basic knowledge in the area of neuroinformatics.

MQL5 Cookbook — Services
The article describes the versatile capabilities of services — MQL5 programs that do not require binding graphs. I will also highlight the differences of services from other MQL5 programs and emphasize the nuances of the developer's work with services. As examples, the reader is offered various tasks covering a wide range of functionality that can be implemented as a service.

Automated Parameter Optimization for Trading Strategies Using Python and MQL5
There are several types of algorithms for self-optimization of trading strategies and parameters. These algorithms are used to automatically improve trading strategies based on historical and current market data. In this article we will look at one of them with python and MQL5 examples.

From Novice to Expert: Trading the RSI with Market Structure Awareness
In this article, we will explore practical techniques for trading the Relative Strength Index (RSI) oscillator with market structure. Our focus will be on channel price action patterns, how they are typically traded, and how MQL5 can be leveraged to enhance this process. By the end, you will have a rule-based, automated channel-trading system designed to capture trend continuation opportunities with greater precision and consistency.

Population optimization algorithms: Particle swarm (PSO)
In this article, I will consider the popular Particle Swarm Optimization (PSO) algorithm. Previously, we discussed such important characteristics of optimization algorithms as convergence, convergence rate, stability, scalability, as well as developed a test stand and considered the simplest RNG algorithm.

Engineering Trading Discipline into Code (Part 2): Building a Daily Trade Limit Enforcer for All Trades in MQL5
We have developed a system that enforces a daily trade limit to keep you aligned with your trading rules. It monitors all executed trades across the account and automatically intervenes once the defined limit is reached, preventing any further activity. By embedding control directly into the platform, the system ensures discipline is maintained even when market pressure rises.
Prices in DoEasy library (part 60): Series list of symbol tick data
In this article, I will create the list for storing tick data of a single symbol and check its creation and retrieval of required data in an EA. Tick data lists that are individual for each used symbol will further constitute a collection of tick data.
Graphics in DoEasy library (Part 80): "Geometric animation frame" object class
In this article, I will optimize the code of classes from the previous articles and create the geometric animation frame object class allowing us to draw regular polygons with a given number of vertices.

Better Programmer (Part 04): How to become a faster developer
Every developer wants to be able to write code faster, and being able to code faster and effective is not some kind of special ability that only a few people are born with. It's a skill that can be learned by every coder, regardless of years of experience on the keyboard.

Neural networks made easy (Part 14): Data clustering
It has been more than a year since I published my last article. This is quite a lot time to revise ideas and to develop new approaches. In the new article, I would like to divert from the previously used supervised learning method. This time we will dip into unsupervised learning algorithms. In particular, we will consider one of the clustering algorithms—k-means.
Library for easy and quick development of MetaTrader programs (part IX): Compatibility with MQL4 - Preparing data
In the previous articles, we started creating a large cross-platform library simplifying the development of programs for MetaTrader 5 and MetaTrader 4 platforms. In the eighth part, we implemented the class for tracking order and position modification events. Here, we will improve the library by making it fully compatible with MQL4.

Ready-made templates for including indicators to Expert Advisors (Part 3): Trend indicators
In this reference article, we will look at standard indicators from the Trend Indicators category. We will create ready-to-use templates for indicator use in EAs - declaring and setting parameters, indicator initialization and deinitialization, as well as receiving data and signals from indicator buffers in EAs.
Prices in DoEasy library (part 62): Updating tick series in real time, preparation for working with Depth of Market
In this article, I will implement updating tick data in real time and prepare the symbol object class for working with Depth of Market (DOM itself is to be implemented in the next article).
Other classes in DoEasy library (Part 67): Chart object class
In this article, I will create the chart object class (of a single trading instrument chart) and improve the collection class of MQL5 signal objects so that each signal object stored in the collection updates all its parameters when updating the list.
Graphical interfaces X: New features for the Rendered table (build 9)
Until today, the CTable was the most advanced type of tables among all presented in the library. This table is assembled from edit boxes of the OBJ_EDIT type, and its further development becomes problematic. Therefore, in terms of maximum capabilities, it is better to develop rendered tables of the CCanvasTable type even at the current development stage of the library. Its current version is completely lifeless, but starting from this article, we will try to fix the situation.

A Library for Constructing a Chart via Google Chart API
The construction of various types of diagrams is an essential part of the analyses of the market situation and the testing of a trading system. Frequently, in order to construct a nice looking diagram, it is necessary to organize the data output into a file, after which it is used in applications such as MS Excel. This is not very convenient and deprives us of the ability to dynamically update the data. Google Charts API provided the means for creating charts in online modes, by sending a special request to the server. In this article we attempt to automate the process of creating such a request and obtaining a chart from the Google server.
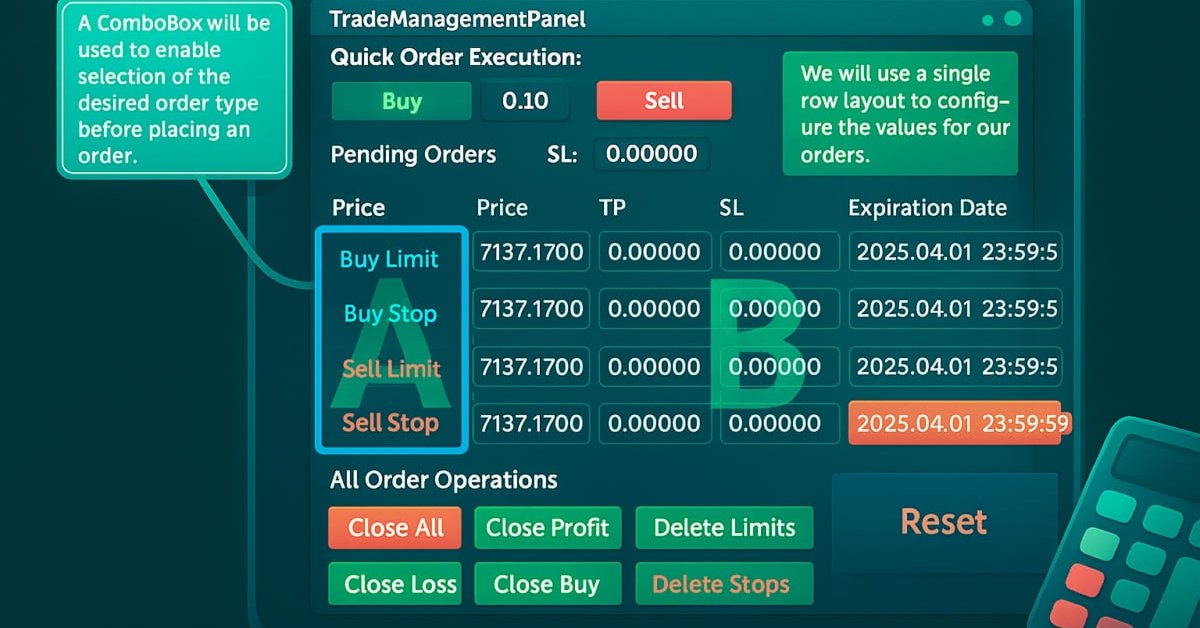
Creating a Trading Administrator Panel in MQL5 (Part XII): Integration of a Forex Values Calculator
Accurate calculation of key trading values is an indispensable part of every trader’s workflow. In this article, we will discuss, the integration of a powerful utility—the Forex Calculator—into the Trade Management Panel, further extending the functionality of our multi-panel Trading Administrator system. Efficiently determining risk, position size, and potential profit is essential when placing trades, and this new feature is designed to make that process faster and more intuitive within the panel. Join us as we explore the practical application of MQL5 in building advanced, trading panels.
Graphics in DoEasy library (Part 87): Graphical object collection - managing object property modification on all open charts
In this article, I will continue my work on tracking standard graphical object events and create the functionality allowing users to control changes in the properties of graphical objects placed on any charts opened in the terminal.