Articles with MQL5 programming examples
Access a huge collection of articles with code examples showing how to create indicators and trading robots for the MetaTrader platform in the MQL5 language. Source codes are attached to the articles, so you can open them in MetaEditor and run them to see how the applications work.
These articles will be useful both for those who have just started exploring automated trading and for professional traders with programming experience. They feature not only examples, but also contain new ideas.
Add a new article

You are missing trading opportunities:
- Free trading apps
- Over 8,000 signals for copying
- Economic news for exploring financial markets
Registration
Log in
You agree to website policy and terms of use
If you do not have an account, please register

DoEasy. Controls (Part 1): First steps
This article starts an extensive topic of creating controls in Windows Forms style using MQL5. My first object of interest is creating the panel class. It is already becoming difficult to manage things without controls. Therefore, I will create all possible controls in Windows Forms style.

Price Action Analysis Toolkit Development (Part 51): Revolutionary Chart Search Technology for Candlestick Pattern Discovery
This article is intended for algorithmic traders, quantitative analysts, and MQL5 developers interested in enhancing their understanding of candlestick pattern recognition through practical implementation. It provides an in‑depth exploration of the CandlePatternSearch.mq5 Expert Advisor—a complete framework for detecting, visualizing, and monitoring classical candlestick formations in MetaTrader 5. Beyond a line‑by‑line review of the code, the article discusses architectural design, pattern detection logic, GUI integration, and alert mechanisms, illustrating how traditional price‑action analysis can be automated efficiently.

Graphical Interfaces XI: Text edit boxes and Combo boxes in table cells (build 15)
In this update of the library, the Table control (the CTable class) will be supplemented with new options. The lineup of controls in the table cells is expanded, this time adding text edit boxes and combo boxes. As an addition, this update also introduces the ability to resize the window of an MQL application during its runtime.

Trailing stop in trading
In this article, we will look at the use of a trailing stop in trading. We will assess how useful and effective it is, and how it can be used. The efficiency of a trailing stop largely depends on price volatility and the selection of the stop loss level. A variety of approaches can be used to set a stop loss.

How to create a simple Multi-Currency Expert Advisor using MQL5 (Part 6): Two RSI indicators cross each other's lines
The multi-currency expert advisor in this article is an expert advisor or trading robot that uses two RSI indicators with crossing lines, the Fast RSI which crosses with the Slow RSI.

Price Action Analysis Toolkit Development (Part 52): Master Market Structure with Multi-Timeframe Visual Analysis
This article presents the Multi‑Timeframe Visual Analyzer, an MQL5 Expert Advisor that reconstructs and overlays higher‑timeframe candles directly onto your active chart. It explains the implementation, key inputs, and practical outcomes, supported by an animated demo and chart examples showing instant toggling, multi‑timeframe confirmation, and configurable alerts. Read on to see how this tool can make chart analysis faster, clearer, and more efficient.

Formulating Dynamic Multi-Pair EA (Part 5): Scalping vs Swing Trading Approaches
This part explores how to design a Dynamic Multi-Pair Expert Advisor capable of adapting between Scalping and Swing Trading modes. It covers the structural and algorithmic differences in signal generation, trade execution, and risk management, allowing the EA to intelligently switch strategies based on market behavior and user input.

Analytical Volume Profile Trading (AVPT): Liquidity Architecture, Market Memory, and Algorithmic Execution
Analytical Volume Profile Trading (AVPT) explores how liquidity architecture and market memory shape price behavior, enabling more profound insight into institutional positioning and volume-driven structure. By mapping POC, HVNs, LVNs, and Value Areas, traders can identify acceptance, rejection, and imbalance zones with precision.
Using Layouts and Containers for GUI Controls: The CGrid Class
This article presents an alternative method of GUI creation based on layouts and containers, using one layout manager — the CGrid class. The CGrid class is an auxiliary control that acts as a container for other containers and controls using a grid layout.

Graphical Interfaces XI: Rendered controls (build 14.2)
In the new version of the library, all controls will be drawn on separate graphical objects of the OBJ_BITMAP_LABEL type. We will also continue to describe the optimization of code: changes in the core classes of the library will be discussed.

Custom Graphical Controls. Part 2. Control Library
The second article of the "Custom Graphical Controls" series introduces a control library for handling the main problems arising in interaction between a program (Expert Advisor, script, indicator) and a user. The library contains a great number of classes (CInputBox, CSpinInputBox, CCheckBox, CRadioGroup, CVSсrollBar, CHSсrollBar, CList, CListMS, CComBox, CHMenu, CVMenu, CHProgress, CDialer, CDialerInputBox, CTable) and examples of their use.

How to create a trading journal with MetaTrader and Google Sheets
Create a trading journal using MetaTrader and Google Sheets! You will learn how to sync your trading data via HTTP POST and retrieve it using HTTP requests. In the end, You have a trading journal that will help you keep track of your trades effectively and efficiently.
Graphics in DoEasy library (Part 77): Shadow object class
In this article, I will create a separate class for the shadow object, which is a descendant of the graphical element object, as well as add the ability to fill the object background with a gradient fill.
Graphics in DoEasy library (Part 95): Composite graphical object controls
In this article, I will consider the toolkit for managing composite graphical objects - controls for managing an extended standard graphical object. Today, I will slightly digress from relocating a composite graphical object and implement the handler of change events on a chart featuring a composite graphical object. Besides, I will focus on the controls for managing a composite graphical object.

Price Action Analysis Toolkit Development (Part 1): Chart Projector
This project aims to leverage the MQL5 algorithm to develop a comprehensive set of analysis tools for MetaTrader 5. These tools—ranging from scripts and indicators to AI models and expert advisors—will automate the market analysis process. At times, this development will yield tools capable of performing advanced analyses with no human involvement and forecasting outcomes to appropriate platforms. No opportunity will ever be missed. Join me as we explore the process of building a robust market analysis custom tools' chest. We will begin by developing a simple MQL5 program that I have named, Chart Projector.

Optimization. A Few Simple Ideas
The optimization process can require significant resources of your computer or even of the MQL5 Cloud Network test agents. This article comprises some simple ideas that I use for work facilitation and improvement of the MetaTrader 5 Strategy Tester. I got these ideas from the documentation, forum and articles.

Introduction to Connexus (Part 1): How to Use the WebRequest Function?
This article is the beginning of a series of developments for a library called “Connexus” to facilitate HTTP requests with MQL5. The goal of this project is to provide the end user with this opportunity and show how to use this helper library. I intended to make it as simple as possible to facilitate study and to provide the possibility for future developments.

Drawing Indicator's Emissions in MQL5
In this article, we will consider the emission of indicators - a new approach to the market research. The calculation of emission is based on the intersection of different indicators: more and more points with different colors and shapes appear after each tick. They form numerous clusters like nebulae, clouds, tracks, lines, arcs, etc. These shapes help to detect the invisible springs and forces that affect the movement of market prices.
Evaluating ONNX models using regression metrics
Regression is a task of predicting a real value from an unlabeled example. The so-called regression metrics are used to assess the accuracy of regression model predictions.

MQL5 Cookbook - Multi-Currency Expert Advisor and Working with Pending Orders in MQL5
This time we are going to create a multi-currency Expert Advisor with a trading algorithm based on work with the pending orders Buy Stop and Sell Stop. This article considers the following matters: trading in a specified time range, placing/modifying/deleting pending orders, checking if the last position was closed at Take Profit or Stop Loss and control of the deals history for each symbol.

Creating Information Boards Using Standard Library Classes and Google Chart API
The MQL5 programming language primarily targets the creation of automated trading systems and complex instruments of technical analyses. But aside from this, it allows us to create interesting information systems for tracking market situations, and provides a return connection with the trader. The article describes the MQL5 Standard Library components, and shows examples of their use in practice for reaching these objectives. It also demonstrates an example of using Google Chart API for the creation of charts.
Prices in DoEasy library (part 63): Depth of Market and its abstract request class
In the article, I will start developing the functionality for working with the Depth of Market. I will also create the class of the Depth of Market abstract order object and its descendants.

Neural networks made easy (Part 6): Experimenting with the neural network learning rate
We have previously considered various types of neural networks along with their implementations. In all cases, the neural networks were trained using the gradient decent method, for which we need to choose a learning rate. In this article, I want to show the importance of a correctly selected rate and its impact on the neural network training, using examples.

Graphical Interfaces II: Setting Up the Event Handlers of the Library (Chapter 3)
The previous articles contain the implementation of the classes for creating constituent parts of the main menu. Now, it is time to take a close look at the event handlers in the principle base classes and in the classes of the created controls. We will also pay special attention to managing the state of the chart depending on the location of the mouse cursor.
Other classes in DoEasy library (Part 72): Tracking and recording chart object parameters in the collection
In this article, I will complete working with chart object classes and their collection. I will also implement auto tracking of changes in chart properties and their windows, as well as saving new parameters to the object properties. Such a revision allows the future implementation of an event functionality for the entire chart collection.

Studying the CCanvas Class. Anti-aliasing and Shadows
An anti-aliasing algorithm of the CCanvas class is the base for all constructions where anti-aliasing is being used. The article contains information about how this algorithm operates, and provides relevant examples of visualization. It also covers drawing shades of graphic objects and has a detailed algorithm developed for drawing shades on canvas. The numerical analysis library ALGLIB is used for calculations.

Programming EA's Modes Using Object-Oriented Approach
This article explains the idea of multi-mode trading robot programming in MQL5. Every mode is implemented with the object-oriented approach. Instances of both mode classes hierarchy and classes for testing are provided. Multi-mode programming of trading robots is supposed to take into account all peculiarities of every operational mode of an EA written in MQL5. Functions and enumeration are created for identifying the mode.

MQL5 Programming Basics: Global Variables of the Terminal
This article highlights object-oriented capabilities of the MQL5 language for creating objects facilitating work with global variables of the terminal. As a practical example I consider a case when global variables are used as control points for implementation of program stages.
Library for easy and quick development of MetaTrader programs (part VII): StopLimit order activation events, preparing the functionality for order and position modification events
In the previous articles, we started creating a large cross-platform library simplifying the development of programs for MetaTrader 5 and MetaTrader 4 platforms. In the sixth part, we trained the library to work with positions on netting accounts. Here we will implement tracking StopLimit orders activation and prepare the functionality to track order and position modification events.

Price Action Analysis Toolkit Development (Part 3): Analytics Master — EA
Moving from a simple trading script to a fully functioning Expert Advisor (EA) can significantly enhance your trading experience. Imagine having a system that automatically monitors your charts, performs essential calculations in the background, and provides regular updates every two hours. This EA would be equipped to analyze key metrics that are crucial for making informed trading decisions, ensuring that you have access to the most current information to adjust your strategies effectively.

Integration of Broker APIs with Expert Advisors using MQL5 and Python
In this article, we will discuss the implementation of MQL5 in partnership with Python to perform broker-related operations. Imagine having a continuously running Expert Advisor (EA) hosted on a VPS, executing trades on your behalf. At some point, the ability of the EA to manage funds becomes paramount. This includes operations such as topping up your trading account and initiating withdrawals. In this discussion, we will shed light on the advantages and practical implementation of these features, ensuring seamless integration of fund management into your trading strategy. Stay tuned!

Price Action Analysis Toolkit Development (Part 49): Integrating Trend, Momentum, and Volatility Indicators into One MQL5 System
Simplify your MetaTrader 5 charts with the Multi Indicator Handler EA. This interactive dashboard merges trend, momentum, and volatility indicators into one real‑time panel. Switch instantly between profiles to focus on the analysis you need most. Declutter with one‑click Hide/Show controls and stay focused on price action. Read on to learn step‑by‑step how to build and customize it yourself in MQL5.

How to Quickly Create an Expert Advisor for Automated Trading Championship 2010
In order to develop an expert to participate in Automated Trading Championship 2010, let's use a template of ready expert advisor. Even novice MQL5 programmer will be capable of this task, because for your strategies the basic classes, functions, templates are already developed. It's enough to write a minimal amount of code to implement your trading idea.

Neural networks made easy (Part 13): Batch Normalization
In the previous article, we started considering methods aimed at improving neural network training quality. In this article, we will continue this topic and will consider another approach — batch data normalization.

Graphical Interfaces VIII: the File Navigator Control (Chapter 3)
In the previous chapters of the eighth part of the series, our library has been reinforced by several classes for developing mouse pointers, calendars and tree views. The current article deals with the file navigator control that can also be used as part of an MQL application graphical interface.

Handling ZIP Archives in Pure MQL5
The MQL5 language keeps evolving, and its new features for working with data are constantly being added. Due to innovation it has recently become possible to operate with ZIP archives using regular MQL5 tools without getting third party DLL libraries involved. This article focuses on how this is done and provides the CZip class, which is a universal tool for reading, creating and modifying ZIP archives, as an example.
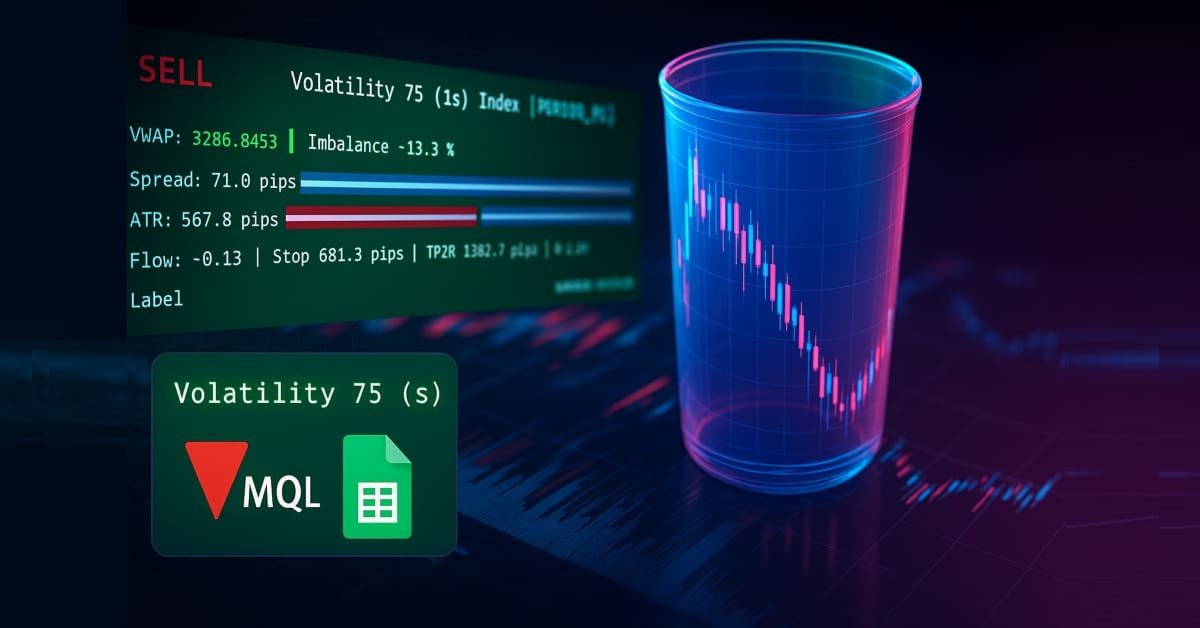
Price Action Analysis Toolkit Development (Part 38): Tick Buffer VWAP and Short-Window Imbalance Engine
In Part 38, we build a production-grade MT5 monitoring panel that converts raw ticks into actionable signals. The EA buffers tick data to compute tick-level VWAP, a short-window imbalance (flow) metric, and ATR-based position sizing. It then visualizes spread, ATR, and flow with low-flicker bars. The system calculates a suggested lot size and a 1R stop, and issues configurable alerts for tight spreads, strong flow, and edge conditions. Auto-trading is intentionally disabled; the focus remains on robust signal generation and a clean user experience.

The Kalman Filter for Forex Mean-Reversion Strategies
The Kalman filter is a recursive algorithm used in algorithmic trading to estimate the true state of a financial time series by filtering out noise from price movements. It dynamically updates predictions based on new market data, making it valuable for adaptive strategies like mean reversion. This article first introduces the Kalman filter, covering its calculation and implementation. Next, we apply the filter to a classic mean-reversion forex strategy as an example. Finally, we conduct various statistical analyses by comparing the filter with a moving average across different forex pairs.

Using Pseudo-Templates as Alternative to C++ Templates
The article describes a way of programming without using templates but keeping the style of programming iherenet to them. It tells about implementation of templates using custom methods and has a ready-made script attached for creating a code on the basis of specified templates.

MQL5 — You too can become a master of this language
This article will be a kind of interview with myself, in which I will tell you how I took my first steps in the MQL5 language. I will show you how you can become a great MQL5 programmer. I will explain the necessary bases for you to achieve this feat. The only prerequisite is a willingness to learn.