

Trade Entry Timing Accuracy Analyzer in MQL5
 229
229
 0
0

Introduction
A strategy report tells you whether a trade won or lost. It does not tell you whether the entry itself was any good. A trade can close in profit after spending most of its life deep underwater, rescued only by a late reversal. A standard report cannot separate that from a trade that moved cleanly in its favor from the moment it opened. Both count as a win. Only one reflects good entry timing.
Maximum Adverse Excursion and Maximum Favorable Excursion make that distinction visible. MAE is how far a trade moved against the position at its worst point before it closed. MFE is how far it moved in the position's favor at its best point. This article defines entry efficiency as a ratio of MFE to (MFE + MAE). It measures how much of a trade's movement was favorable rather than adverse, regardless of whether the trade closed as a win or a loss.
This article builds a dashboard that reads closed-position history, computes MAE and MFE from tick data, and renders two views. The first is a scatter plot of MAE against MFE, one point per trade. The second is a histogram of the entry efficiency ratio across every trade analyzed. A short report also prints exact figures to the Experts tab, the same weekday-summary style used in earlier analytics dashboards in this series.
One caveat applies, as with any exploratory analytics tool. Entry efficiency describes what happened to price after a trade opened. It does not, by itself, prove a trade was entered at a statistically better or worse moment than average. A handful of trades is not a reliable sample. Treat the scatter plot and the histogram as a way to ask whether your entry timing looks distinguishable from average across many trades, not as a verdict on any single trade.
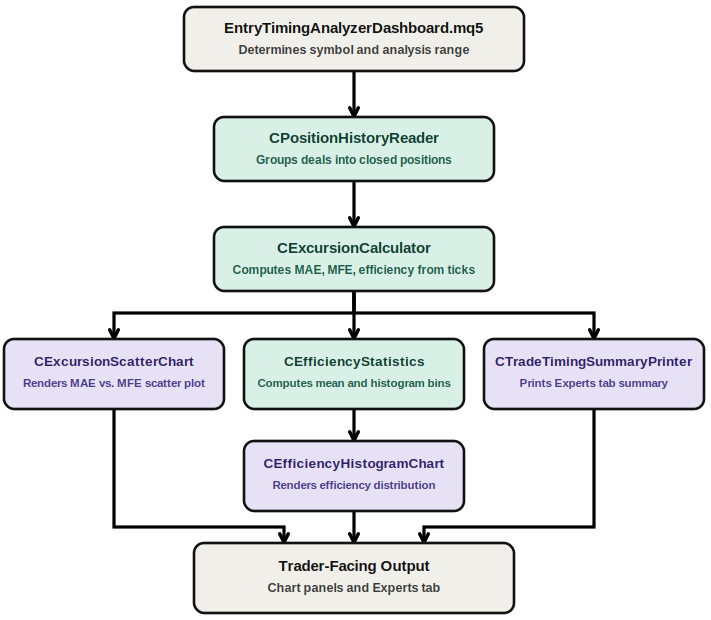
Entry Timing Architecture: Data flows from the main script through the position reader and excursion calculator. Output fans out to the scatter chart, the statistics component, and the summary printer.
Data Model: One Record Per Closed Position — TradeExcursionTypes.mqh
Everything in this pipeline moves through a single structure, CTradeExcursion. It holds both the entry-side facts gathered from deal history and the excursion figures computed from tick data afterward. Keeping both stages in one record means every downstream component only needs to pass around one array of one type.
The entry-side fields are populated first: position identifier, symbol, direction, open time, open price, close time, and realized net profit. The excursion fields start at explicit zero defaults and are filled in by a later stage. A record whose m_tick_count is still zero has not yet had its excursion computed, or has had no ticks available to compute it from.
//+------------------------------------------------------------------+
//|                                          TradeExcursionTypes.mqh |
//+------------------------------------------------------------------+
#ifndef TRADEEXCURSIONTYPES_MQH
#define TRADEEXCURSIONTYPES_MQH

//+-------------------------------------------------------------------+
//| CTradeExcursion                                                   |
//+-------------------------------------------------------------------+
class CTradeExcursion
  {
public:
   ulong             m_position_id;         // MQL5 position identifier grouping the deals
   string            m_symbol;              // symbol this position was traded on
   bool              m_is_long;             // true for a long position, false for a short
   datetime          m_entry_time;          // server-time open of the position
   datetime          m_close_time;          // server-time of the last closing deal
   double            m_entry_price;         // price at which the position was opened
   double            m_net_profit;          // realized profit + swap + commission
   double            m_mae;                 // Maximum Adverse Excursion, in price units, always >= 0
   double            m_mfe;                 // Maximum Favorable Excursion, in price units, always >= 0
   double            m_efficiency;          // MFE / (MFE + MAE), meaningful only when m_efficiency_defined
   bool              m_efficiency_defined;  // false when the trade showed no tick-level price movement
   int               m_tick_count;          // number of ticks used to compute m_mae and m_mfe
                     CTradeExcursion(void);
  };

//+-------------------------------------------------------------------+
//| Constructor                                                       |
//| Initializes every field to an explicit, unambiguous default so    |
//| that a record that has not yet been populated by the reader or the|
//| calculator can never be mistaken for a real, computed result.     |
//+-------------------------------------------------------------------+
CTradeExcursion::CTradeExcursion(void)
  {
   m_position_id        = 0;
   m_symbol             = "";
   m_is_long            = true;
   m_entry_time         = 0;
   m_close_time         = 0;
   m_entry_price        = 0.0;
   m_net_profit         = 0.0;
   m_mae                = 0.0;
   m_mfe                = 0.0;
   m_efficiency         = 0.0;
   m_efficiency_defined = false;
   m_tick_count         = 0;
  }

#endif // TRADEEXCURSIONTYPES_MQH
//+------------------------------------------------------------------+
Grouping Deals into Closed Positions — PositionHistoryReader.mqh
A single closed position can involve more than one deal: an entry deal that opens it, and one or more closing deals if it was closed in pieces through partial closes. MQL5 groups these together with DEAL_POSITION_ID, and CPositionHistoryReader uses that identifier as a grouping key.
//+------------------------------------------------------------------+
//|                                        PositionHistoryReader.mqh |
//+------------------------------------------------------------------+
#ifndef POSITIONHISTORYREADER_MQH
#define POSITIONHISTORYREADER_MQH

#include "TradeExcursionTypes.mqh"

//+--------------------------------------------------------------------+
//| CPositionHistoryReader                                             |
//+--------------------------------------------------------------------+
class CPositionHistoryReader
  {
private:
   int               FindPositionIndex(const CTradeExcursion &trades[], int count, ulong position_id) const;
   void              CopyRecord(CTradeExcursion &dest, const CTradeExcursion &src) const;

public:
                     CPositionHistoryReader(void);
                    ~CPositionHistoryReader(void);
   bool              Read(const string symbol, datetime from, datetime to, CTradeExcursion &trades_out[]);
  };

//+------------------------------------------------------------------+
//| Constructor                                                      |
//| The reader is stateless between calls, so construction performs  |
//| no work beyond default object creation.                          |
//+------------------------------------------------------------------+
CPositionHistoryReader::CPositionHistoryReader(void)
  {
  }

//+------------------------------------------------------------------+
//| Destructor                                                       |
//| No resources are owned by this class, so no cleanup is required. |
//+------------------------------------------------------------------+
CPositionHistoryReader::~CPositionHistoryReader(void)
  {
  }
FindPositionIndex() decides whether an incoming deal belongs to a position already seen or needs a new record. It only reads the array, so it stays a safe const method. CopyRecord() supports a later compaction step. It copies one CTradeExcursion into another, field by field, keeping the operation unambiguous.
//+---------------------------------------------------------------------+
//| FindPositionIndex                                                   |
//+---------------------------------------------------------------------+
int CPositionHistoryReader::FindPositionIndex(const CTradeExcursion &trades[],const int count,const ulong position_id) const
  {
   for(int i = 0; i < count; i++)
     {
      if(trades[i].m_position_id == position_id)
         return(i);
     }
   return(-1);
  }

//+---------------------------------------------------------------------+
//| CopyRecord                                                          |
//+---------------------------------------------------------------------+
void CPositionHistoryReader::CopyRecord(CTradeExcursion &dest,const CTradeExcursion &src) const
  {
   dest.m_position_id        = src.m_position_id;
   dest.m_symbol             = src.m_symbol;
   dest.m_is_long            = src.m_is_long;
   dest.m_entry_time         = src.m_entry_time;
   dest.m_close_time         = src.m_close_time;
   dest.m_entry_price        = src.m_entry_price;
   dest.m_net_profit         = src.m_net_profit;
   dest.m_mae                = src.m_mae;
   dest.m_mfe                = src.m_mfe;
   dest.m_efficiency         = src.m_efficiency;
   dest.m_efficiency_defined = src.m_efficiency_defined;
   dest.m_tick_count         = src.m_tick_count;
  }
Read() selects the terminal's history cache for the requested range and iterates over all deals for the requested symbol. An entry deal, DEAL_ENTRY_IN, supplies open time, open price, and direction. A closing deal, DEAL_ENTRY_OUT or DEAL_ENTRY_INOUT, supplies a close time, and the latest closing deal seen wins, so a position closed through several partial closes ends up with the time of its final close. Net profit accumulates profit, swap, and commission across every deal belonging to the position.
Once every deal has been folded in, Read() compacts the array. Only positions with a valid entry time and a close time strictly after it survive. A position opened before the requested range, or still open at the end of it, is only partially visible and gets dropped rather than scored on an incomplete price path.
//+------------------------------------------------------------------------+
//| Read                                                                   |
//+------------------------------------------------------------------------+
bool CPositionHistoryReader::Read(const string symbol,datetime from,datetime to,CTradeExcursion &trades_out[])
  {
//--- start from an empty output buffer regardless of any prior contents
   ::ArrayResize(trades_out, 0);
//--- ask the terminal to build the history cache for the requested interval
   if(!::HistorySelect(from, to))
     {
      ::Print("CPositionHistoryReader: HistorySelect failed for the requested range.");
      return(false);
     }
//--- walk every deal available in the freshly selected history cache
   int total_deals = ::HistoryDealsTotal();
   for(int i = 0; i < total_deals; i++)
     {
      ulong ticket = ::HistoryDealGetTicket(i);
      if(ticket == 0)
         continue;
      //--- only deals on the requested symbol contribute to this analysis
      string deal_symbol = ::HistoryDealGetString(ticket, DEAL_SYMBOL);
      if(deal_symbol != symbol)
         continue;
      ulong position_id = (ulong)::HistoryDealGetInteger(ticket, DEAL_POSITION_ID);
      long  entry_type   = ::HistoryDealGetInteger(ticket, DEAL_ENTRY);
      double deal_profit = ::HistoryDealGetDouble(ticket, DEAL_PROFIT)
                           + ::HistoryDealGetDouble(ticket, DEAL_SWAP)
                           + ::HistoryDealGetDouble(ticket, DEAL_COMMISSION);
      //--- find or create the working record for this position
      int index = FindPositionIndex(trades_out, ::ArraySize(trades_out), position_id);
      if(index < 0)
        {
         index = ::ArraySize(trades_out);
         ::ArrayResize(trades_out, index + 1);
         trades_out[index].m_position_id = position_id;
         trades_out[index].m_symbol      = symbol;
        }
      trades_out[index].m_net_profit += deal_profit;
      if(entry_type == DEAL_ENTRY_IN)
        {
         //--- the entry deal supplies open time, open price, and direction
         trades_out[index].m_entry_time  = (datetime)::HistoryDealGetInteger(ticket, DEAL_TIME);
         trades_out[index].m_entry_price = ::HistoryDealGetDouble(ticket, DEAL_PRICE);
         long deal_type = ::HistoryDealGetInteger(ticket, DEAL_TYPE);
         trades_out[index].m_is_long = (deal_type == DEAL_TYPE_BUY);
        }
      else
         if(entry_type == DEAL_ENTRY_OUT || entry_type == DEAL_ENTRY_INOUT)
           {
            //--- the latest closing deal determines the final close time
            datetime candidate_close = (datetime)::HistoryDealGetInteger(ticket, DEAL_TIME);
            if(candidate_close > trades_out[index].m_close_time)
               trades_out[index].m_close_time = candidate_close;
           }
     }
//--- compact the array, keeping only positions with a full entry-to-close path
   int write_index = 0;
   int read_count   = ::ArraySize(trades_out);
   for(int read_index = 0; read_index < read_count; read_index++)
     {
      bool is_complete = trades_out[read_index].m_entry_time > 0
                         && trades_out[read_index].m_close_time > trades_out[read_index].m_entry_time;
      if(is_complete)
        {
         if(write_index != read_index)
            CopyRecord(trades_out[write_index], trades_out[read_index]);
         write_index++;
        }
     }
   ::ArrayResize(trades_out, write_index);
   return(true);
  }
Computing MAE, MFE, and Entry Efficiency from Ticks — ExcursionCalculator.mqh
MqlTick bid and ask are the raw materials this stage uses. CExcursionCalculator keeps retrieval separate from arithmetic, so the arithmetic can be tested with a synthetic tick array and no dependency on a live account.
//+------------------------------------------------------------------+
//|                                          ExcursionCalculator.mqh |
//+------------------------------------------------------------------+
#ifndef EXCURSIONCALCULATOR_MQH
#define EXCURSIONCALCULATOR_MQH

#include "TradeExcursionTypes.mqh"

//+---------------------------------------------------------------------+
//| CExcursionCalculator                                                |
//+---------------------------------------------------------------------+
class CExcursionCalculator
  {
public:
                     CExcursionCalculator(void);
                    ~CExcursionCalculator(void);
   bool              ReadTicks(const string symbol, datetime from, datetime to, MqlTick &ticks_out[]) const;
   bool              ComputeExcursionFromTicks(const MqlTick &ticks[], int count, double entry_price,
                                                bool is_long, double &mae_out, double &mfe_out) const;
   bool              ComputeEfficiency(double mae, double mfe, double &efficiency_out) const;
   bool              Compute(CTradeExcursion &trade) const;
  };

//+------------------------------------------------------------------+
//| Constructor                                                      |
//| The calculator holds no state between calls, so construction     |
//| performs no work beyond default object creation.                 |
//+------------------------------------------------------------------+
CExcursionCalculator::CExcursionCalculator(void)
  {
  }

//+------------------------------------------------------------------+
//| Destructor                                                       |
//| No resources are owned by this class, so no cleanup is required. |
//+------------------------------------------------------------------+
CExcursionCalculator::~CExcursionCalculator(void)
  {
  }
ReadTicks() requests every tick for a symbol between a position's entry and close time, using CopyTicksRange, which expects both time boundaries in milliseconds rather than the whole-second datetime values used elsewhere. Returning true with an empty result array is valid. Terminals typically retain tick history for a much shorter period than deal history, so older positions may legitimately have no ticks available. Only a negative result from CopyTicksRange counts as a failure.
//+-------------------------------------------------------------------------+
//| ReadTicks                                                               |
//+-------------------------------------------------------------------------+
bool CExcursionCalculator::ReadTicks(const string symbol,datetime from,datetime to,MqlTick &ticks_out[]) const
  {
   ulong from_msc = (ulong)from * 1000;
   ulong to_msc   = (ulong)to   * 1000;
   int copied = ::CopyTicksRange(symbol, ticks_out, COPY_TICKS_ALL, from_msc, to_msc);
   if(copied < 0)
     {
      ::Print("CExcursionCalculator: CopyTicksRange failed for ", symbol);
      return(false);
     }
   return(true);
  }
ComputeExcursionFromTicks() walks that tick array and tracks the largest favorable and largest adverse move away from the entry price. For a long position, the price it would actually close at is the bid, so favorable movement is the bid rising above entry, and adverse movement is the bid falling below it. For a short position the closing price is the ask, and the direction mirrors. Both figures start at zero and only grow, so a position that never moved favorably reports an MFE of exactly zero rather than a negative number.
//+--------------------------------------------------------------------------+
//| ComputeExcursionFromTicks                                                |
//+--------------------------------------------------------------------------+
bool CExcursionCalculator::ComputeExcursionFromTicks(const MqlTick &ticks[],const int count,const double entry_price,
                                                      const bool is_long,double &mae_out,double &mfe_out) const
  {
   mae_out = 0.0;
   mfe_out = 0.0;
   if(count <= 0)
      return(false);
//--- walk every tick and track the largest favorable and adverse distance
   for(int i = 0; i < count; i++)
     {
      double reference_price = is_long ? ticks[i].bid : ticks[i].ask;
      double excursion = is_long ? (reference_price - entry_price) : (entry_price - reference_price);
      if(excursion > mfe_out)
         mfe_out = excursion;
      if(-excursion > mae_out)
         mae_out = -excursion;
     }
   return(true);
  }
ComputeEfficiency() turns that pair into a single ratio. A value near 1.0 means the trade moved almost entirely in its favor before closing; near 0.0 means the opposite. One case needs its own branch: a trade whose MAE and MFE are both exactly zero, meaning no tick-level movement was observed at all. That ratio is 0/0, so the method reports it as undefined via its return value. This avoids silently returning 0.0, which could be misread as a computed result.
//+------------------------------------------------------------------------+
//| ComputeEfficiency                                                      |
//+------------------------------------------------------------------------+
bool CExcursionCalculator::ComputeEfficiency(const double mae,const double mfe,double &efficiency_out) const
  {
   if(mae + mfe == 0.0)
     {
      efficiency_out = 0.0;
      return(false);
     }
   efficiency_out = mfe / (mfe + mae);
   return(true);
  }
Compute() ties the three previous methods together for one trade. It reads the ticks spanning entry-to-close, derives MAE and MFE, then derives efficiency. The trade's m_tick_count field is set regardless of outcome, so a caller can distinguish "zero ticks available" from any later computed result just by inspecting the record. This method writes into the trade passed by reference, but never touches its own member state, so it stays const.
//+-----------------------------------------------------------------------------+
//| Compute                                                                     |
//+-----------------------------------------------------------------------------+
bool CExcursionCalculator::Compute(CTradeExcursion &trade) const
  {
   MqlTick ticks[];
   if(!ReadTicks(trade.m_symbol, trade.m_entry_time, trade.m_close_time, ticks))
      return(false);
   int tick_total = ::ArraySize(ticks);
   trade.m_tick_count = tick_total;

   double mae = 0.0, mfe = 0.0;
   if(!ComputeExcursionFromTicks(ticks, tick_total, trade.m_entry_price, trade.m_is_long, mae, mfe))
      return(false);
   trade.m_mae = mae;
   trade.m_mfe = mfe;

   double efficiency = 0.0;
   trade.m_efficiency_defined = ComputeEfficiency(mae, mfe, efficiency);
   trade.m_efficiency         = efficiency;
   return(true);
  }
Reducing Trades to Aggregate Statistics — EfficiencyStatistics.mqh
CEfficiencyStatistics turns an array of trade records into three figures a histogram needs: a mean efficiency, a set of bin counts, and a win/loss/breakeven split. Every method is a pure function over plain data.
//+------------------------------------------------------------------+
//|                                         EfficiencyStatistics.mqh |
//+------------------------------------------------------------------+
#ifndef EFFICIENCYSTATISTICS_MQH
#define EFFICIENCYSTATISTICS_MQH

#include "TradeExcursionTypes.mqh"

//+---------------------------------------------------------------------+
//| CEfficiencyStatistics                                               |
//+---------------------------------------------------------------------+
class CEfficiencyStatistics
  {
public:
                     CEfficiencyStatistics(void);
                    ~CEfficiencyStatistics(void);
   bool              ComputeMeanEfficiency(const CTradeExcursion &trades[], int count, double &mean_out) const;
   void              ComputeHistogramBins(const CTradeExcursion &trades[], int count, int bin_count, int &bins_out[]) const;
   void              ComputeWinLossCounts(const CTradeExcursion &trades[], int count,
                                          int &win_count, int &loss_count, int &breakeven_count) const;
  };

//+------------------------------------------------------------------+
//| Constructor                                                      |
//| The statistics helper holds no state between calls, so           |
//| construction performs no work beyond default object creation.    |
//+------------------------------------------------------------------+
CEfficiencyStatistics::CEfficiencyStatistics(void)
  {
  }

//+------------------------------------------------------------------+
//| Destructor                                                       |
//| No resources are owned by this class, so no cleanup is required. |
//+------------------------------------------------------------------+
CEfficiencyStatistics::~CEfficiencyStatistics(void)
  {
  }
ComputeMeanEfficiency() averages efficiency only across trades whose value is defined, skipping any trade with no tick data or no observed movement. If no trade qualifies, it reports failure rather than a mean of zero, which could be mistaken for a genuinely poor average.
//+------------------------------------------------------------------------+
//| ComputeMeanEfficiency                                                  |
//+------------------------------------------------------------------------+
bool CEfficiencyStatistics::ComputeMeanEfficiency(const CTradeExcursion &trades[],const int count,double &mean_out) const
  {
   double sum = 0.0;
   int defined_count = 0;
   for(int i = 0; i < count; i++)
     {
      if(trades[i].m_efficiency_defined)
        {
         sum += trades[i].m_efficiency;
         defined_count++;
        }
     }
   if(defined_count <= 0)
     {
      mean_out = 0.0;
      return(false);
     }
   mean_out = sum / defined_count;
   return(true);
  }
ComputeHistogramBins() distributes each trade's efficiency into equal-width bins spanning 0.0 to 1.0. A trade with no defined efficiency is skipped, rather than folded into bin zero, which would overweight the low end. One boundary needs explicit handling: an efficiency of exactly 1.0, multiplied by the bin count, lands exactly one position past the last valid bin, so that result is clamped back into the final bin.
//+---------------------------------------------------------------------------+
//| ComputeHistogramBins                                                      |
//+---------------------------------------------------------------------------+
void CEfficiencyStatistics::ComputeHistogramBins(const CTradeExcursion &trades[],const int count,
      const int bin_count,int &bins_out[]) const
  {
   ::ArrayResize(bins_out, bin_count);
   ::ArrayInitialize(bins_out, 0);
   for(int i = 0; i < count; i++)
     {
      if(!trades[i].m_efficiency_defined)
         continue;
      int bin_index = (int)(trades[i].m_efficiency * bin_count);
      //--- an efficiency of exactly 1.0 must land in the last bin, not one past it
      if(bin_index >= bin_count)
         bin_index = bin_count - 1;
      if(bin_index < 0)
         bin_index = 0;
      bins_out[bin_index]++;
     }
  }
ComputeWinLossCounts() classifies every trade by the sign of its net profit. A net profit of exactly zero counts as breakeven, its own category, never folded into either the win or the loss count.
//+-----------------------------------------------------------------------+
//| ComputeWinLossCounts                                                  |
//+-----------------------------------------------------------------------+
void CEfficiencyStatistics::ComputeWinLossCounts(const CTradeExcursion &trades[],const int count,
      int &win_count,int &loss_count,int &breakeven_count) const
  {
   win_count       = 0;
   loss_count      = 0;
   breakeven_count = 0;
   for(int i = 0; i < count; i++)
     {
      if(trades[i].m_net_profit > 0.0)
         win_count++;
      else
         if(trades[i].m_net_profit < 0.0)
            loss_count++;
         else
            breakeven_count++;
     }
  }
Rendering the MAE/MFE Scatter Plot with CCanvas — ExcursionScatterChart.mqh
CExcursionScatterChart owns a CCanvas instance and plots MAE on the horizontal axis against MFE on the vertical axis, one point per trade. The constructor stores the object name and default margins; the canvas itself is created lazily on the first call to Draw(). The destructor is intentionally empty, since the rendered panel needs to survive after the script that drew it finishes. Clear() is the one explicit, caller-driven way to tear the panel down.
//+------------------------------------------------------------------+
//|                                        ExcursionScatterChart.mqh |
//+------------------------------------------------------------------+
#ifndef EXCURSIONSCATTERCHART_MQH
#define EXCURSIONSCATTERCHART_MQH

#include <Canvas\Canvas.mqh>
#include "TradeExcursionTypes.mqh"

//--- palette used by the scatter chart, kept at file scope
const color EXCUR_COLOR_BACKGROUND = clrWhite;
const color EXCUR_COLOR_AXIS       = clrBlack;
const color EXCUR_COLOR_TEXT       = clrBlack;
const color EXCUR_COLOR_DIAGONAL   = C'150,150,150';
const color EXCUR_COLOR_WIN        = C'0,140,60';
const color EXCUR_COLOR_LOSS       = C'190,30,30';
const color EXCUR_COLOR_BREAKEVEN  = C'140,140,140';

//+---------------------------------------------------------------------+
//| CExcursionScatterChart                                              |
//+---------------------------------------------------------------------+
class CExcursionScatterChart
  {
private:
   CCanvas           m_canvas;
   string            m_object_name;
   bool              m_canvas_created;
   int               m_left_margin;
   int               m_bottom_margin;
   int               m_top_margin;
   int               m_right_margin;
   int               m_point_radius;

   void              FindAxisMaximums(const CTradeExcursion &trades[], int count, double &max_mae, double &max_mfe) const;
   color             PointColor(double net_profit) const;
   void              DrawAxes(int plot_x, int plot_y, int plot_w, int plot_h, double max_mae, double max_mfe, int price_digits);
   void              DrawDiagonal(int plot_x, int plot_y, int plot_w, int plot_h, double max_mae, double max_mfe);

public:
                     CExcursionScatterChart(const string object_name);
                    ~CExcursionScatterChart(void);
   bool              Draw(const CTradeExcursion &trades[], int count, int x, int y, int width, int height);
   void              Clear(void);
  };

//+---------------------------------------------------------------------+
//| Constructor                                                         |
//| Stores the chart object name and establishes the default layout     |
//| geometry. As with the other CCanvas-owning classes in this project, |
//| the canvas itself is created lazily on the first call to Draw().    |
//+---------------------------------------------------------------------+
CExcursionScatterChart::CExcursionScatterChart(const string object_name)
  {
   m_object_name    = object_name;
   m_canvas_created = false;
   m_left_margin    = 70;
   m_bottom_margin  = 50;
   m_top_margin     = 40;
   m_right_margin   = 20;
   m_point_radius   = 4;
  }

//+---------------------------------------------------------------------+
//| Destructor                                                          |
//| Intentionally empty, for the same reason as every other persistent  |
//| chart panel in this project: the dashboard script constructs this   |
//| class as a local object inside OnStart(), and the rendered panel    |
//| must remain visible after OnStart() returns and the object goes out |
//| of scope. Clear() is the explicit, caller-driven way to remove it.  |
//+---------------------------------------------------------------------+
CExcursionScatterChart::~CExcursionScatterChart(void)
  {
  }

//+--------------------------------------------------------------------+
//| Clear                                                              |
//| Explicitly removes the chart panel. This is the only place in this |
//| class where the canvas is torn down.                               |
//+--------------------------------------------------------------------+
void CExcursionScatterChart::Clear(void)
  {
   if(m_canvas_created)
     {
      m_canvas.Destroy();
      m_canvas_created = false;
     }
  }
Two small helpers support the rendering that follows. FindAxisMaximums() scans for the largest observed MAE and MFE, considering only trades with usable tick data. PointColor() maps a trade's net profit to a color: green for a win, red for a loss, and a separate neutral gray for an exact breakeven, so a breakeven trade is never miscolored as a small win or loss.
//+-----------------------------------------------------------------------+
//| FindAxisMaximums                                                      |
//+-----------------------------------------------------------------------+
void CExcursionScatterChart::FindAxisMaximums(const CTradeExcursion &trades[],const int count,
      double &max_mae,double &max_mfe) const
  {
   max_mae = 0.0;
   max_mfe = 0.0;
   for(int i = 0; i < count; i++)
     {
      if(trades[i].m_tick_count <= 0)
         continue;
      if(trades[i].m_mae > max_mae)
         max_mae = trades[i].m_mae;
      if(trades[i].m_mfe > max_mfe)
         max_mfe = trades[i].m_mfe;
     }
  }

//+---------------------------------------------------------------------+
//| PointColor                                                          |
//+---------------------------------------------------------------------+
color CExcursionScatterChart::PointColor(const double net_profit) const
  {
   if(net_profit > 0.0)
      return(EXCUR_COLOR_WIN);
   if(net_profit < 0.0)
      return(EXCUR_COLOR_LOSS);
   return(EXCUR_COLOR_BREAKEVEN);
  }
DrawAxes() draws both axes with their titles and numeric end labels. The vertical title is drawn rotated ninety degrees using the angle parameter of CCanvas::FontSet(). Both numeric labels are measured with TextGetSize before being placed, so neither overlaps the axis or spills outside the panel, regardless of how many digits the symbol's price precision requires. The MFE label specifically sits just above the top of the y-axis, sized to the space its own text actually needs rather than a fixed guess.
//+--------------------------------------------------------------------------+
//| DrawAxes                                                                 |
//+--------------------------------------------------------------------------+
void CExcursionScatterChart::DrawAxes(const int plot_x,const int plot_y,const int plot_w,const int plot_h,
                                      const double max_mae,const double max_mfe,const int price_digits)
  {
   int origin_x = plot_x;
   int origin_y = plot_y + plot_h;
//--- horizontal and vertical axis lines
   m_canvas.Line(origin_x, origin_y, origin_x + plot_w, origin_y, ::ColorToARGB(EXCUR_COLOR_AXIS, 255));
   m_canvas.Line(origin_x, origin_y, origin_x, plot_y, ::ColorToARGB(EXCUR_COLOR_AXIS, 255));
//--- axis titles
   m_canvas.FontSet("Arial", 11, FW_BOLD, 0);
   ::TextSetFont("Arial", 11, FW_BOLD, 0);
   string x_title = "Maximum Adverse Excursion (MAE)";
   uint x_title_w = 0, x_title_h = 0;
   ::TextGetSize(x_title, x_title_w, x_title_h);
   m_canvas.TextOut(origin_x + (plot_w - (int)x_title_w) / 2, origin_y + 34, x_title, ::ColorToARGB(EXCUR_COLOR_TEXT, 255));

   m_canvas.FontSet("Arial", 11, FW_BOLD, 900);
   ::TextSetFont("Arial", 11, FW_BOLD, 900);
   string y_title = "Maximum Favorable Excursion (MFE)";
   uint y_title_w = 0, y_title_h = 0;
   ::TextGetSize(y_title, y_title_w, y_title_h);
   m_canvas.TextOut(18, origin_y - (plot_h - (int)y_title_w) / 2, y_title, ::ColorToARGB(EXCUR_COLOR_TEXT, 255));
//--- numeric end labels for both axes, formatted with the analyzed symbol's own digits
   m_canvas.FontSet("Arial", 10, 0, 0);
   ::TextSetFont("Arial", 10, 0, 0);
   m_canvas.TextOut(origin_x, origin_y + 6, "0", ::ColorToARGB(EXCUR_COLOR_TEXT, 255));
   string mae_label = ::DoubleToString(max_mae, price_digits);
   uint mae_w = 0, mae_h = 0;
   ::TextGetSize(mae_label, mae_w, mae_h);
   m_canvas.TextOut(origin_x + plot_w - (int)mae_w, origin_y + 6, mae_label, ::ColorToARGB(EXCUR_COLOR_TEXT, 255));
   string mfe_label = ::DoubleToString(max_mfe, price_digits);
   uint mfe_w = 0, mfe_h = 0;
   ::TextGetSize(mfe_label, mfe_w, mfe_h);
   m_canvas.TextOut(origin_x + 4, plot_y - (int)mfe_h - 2, mfe_label, ::ColorToARGB(EXCUR_COLOR_TEXT, 255));
  }
DrawDiagonal() draws the reference line marking where MAE equals MFE. That line is not drawn at a fixed forty-five degrees, because the two axes are usually scaled to different maximums. The method maps both endpoints through their own axis scale, so the line stays correct regardless of how the two maximums compare. Everything above it has more favorable than adverse excursion, exactly the region an efficiency above 0.5 corresponds to.
//+-----------------------------------------------------------------------+
//| DrawDiagonal                                                          |
//+-----------------------------------------------------------------------+
void CExcursionScatterChart::DrawDiagonal(const int plot_x,const int plot_y,const int plot_w,const int plot_h,
      const double max_mae,const double max_mfe)
  {
   if(max_mae <= 0.0 || max_mfe <= 0.0)
      return;
   double shared_max = ::MathMin(max_mae, max_mfe);
   int origin_x = plot_x;
   int origin_y = plot_y + plot_h;
   int end_x = origin_x + (int)((shared_max / max_mae) * plot_w);
   int end_y = origin_y - (int)((shared_max / max_mfe) * plot_h);
   m_canvas.LineStyleSet(STYLE_DASH);
   m_canvas.Line(origin_x, origin_y, end_x, end_y, ::ColorToARGB(EXCUR_COLOR_DIAGONAL, 255));
   m_canvas.LineStyleSet(STYLE_SOLID);
  }
Draw() brings it all together. It creates the canvas on first use, handles an empty or all-zero dataset with an explanatory message, computes the axis maximums, and draws the title, both axes, the diagonal, and one point per trade with usable tick data. A trade with no tick data is skipped rather than drawn at a misleading position of zero.
//+-------------------------------------------------------------------------+
//| Draw                                                                    |
//+-------------------------------------------------------------------------+
bool CExcursionScatterChart::Draw(const CTradeExcursion &trades[],const int count,
                                  const int x,const int y,const int width,const int height)
  {
   if(!m_canvas_created)
     {
      if(!m_canvas.CreateBitmapLabel(m_object_name, x, y, width, height, COLOR_FORMAT_ARGB_NORMALIZE))
        {
         ::Print("CExcursionScatterChart: failed to create canvas for object '", m_object_name, "'.");
         return(false);
        }
      m_canvas_created = true;
     }
   m_canvas.Erase(::ColorToARGB(EXCUR_COLOR_BACKGROUND, 255));

   double max_mae = 0.0, max_mfe = 0.0;
   FindAxisMaximums(trades, count, max_mae, max_mfe);

   if(count <= 0 || (max_mae == 0.0 && max_mfe == 0.0))
     {
      m_canvas.FontSet("Arial", 11, 0, 0);
      ::TextSetFont("Arial", 11, 0, 0);
      string message = "No tick-based excursion data available for the selected trades.";
      m_canvas.TextOut(m_left_margin, m_top_margin, message, ::ColorToARGB(EXCUR_COLOR_TEXT, 255));
      m_canvas.Update(true);
      return(true);
     }

   int plot_x = m_left_margin;
   int plot_y = m_top_margin;
   int plot_w = width  - m_left_margin - m_right_margin;
   int plot_h = height - m_top_margin  - m_bottom_margin;

   m_canvas.FontSet("Arial", 12, FW_BOLD, 0);
   ::TextSetFont("Arial", 12, FW_BOLD, 0);
   m_canvas.TextOut(m_left_margin, 10, "MAE vs. MFE by Closed Trade", ::ColorToARGB(EXCUR_COLOR_TEXT, 255));

//--- format axis labels using the analyzed symbol's own digits, not the chart's
   int price_digits = (int)::SymbolInfoInteger(trades[0].m_symbol, SYMBOL_DIGITS);

   DrawAxes(plot_x, plot_y, plot_w, plot_h, max_mae, max_mfe, price_digits);
   DrawDiagonal(plot_x, plot_y, plot_w, plot_h, max_mae, max_mfe);

//--- plot one point per trade with usable tick data
   for(int i = 0; i < count; i++)
     {
      if(trades[i].m_tick_count <= 0)
         continue;
      double mae_fraction = (max_mae > 0.0) ? (trades[i].m_mae / max_mae) : 0.0;
      double mfe_fraction = (max_mfe > 0.0) ? (trades[i].m_mfe / max_mfe) : 0.0;
      int point_x = plot_x + (int)(mae_fraction * plot_w);
      int point_y = plot_y + plot_h - (int)(mfe_fraction * plot_h);
      color point_color = PointColor(trades[i].m_net_profit);
      m_canvas.FillCircle(point_x, point_y, m_point_radius, ::ColorToARGB(point_color, 190));
      m_canvas.Circle(point_x, point_y, m_point_radius, ::ColorToARGB(EXCUR_COLOR_AXIS, 120));
     }

   m_canvas.Update(true);
   return(true);
  }
Rendering the Entry Efficiency Histogram — EfficiencyHistogramChart.mqh
CEfficiencyHistogramChart follows the same shape: lazy canvas creation, empty destructor, explicit Clear(). It takes already-computed bin counts and a mean efficiency as input rather than scanning trade records itself, so it stays a pure rendering component; the arithmetic lives entirely in CEfficiencyStatistics.
//+------------------------------------------------------------------+
//|                                     EfficiencyHistogramChart.mqh |
//+------------------------------------------------------------------+
#ifndef EFFICIENCYHISTOGRAMCHART_MQH
#define EFFICIENCYHISTOGRAMCHART_MQH

#include <Canvas\Canvas.mqh>

//--- palette used by the histogram chart, kept at file scope
const color EFFHIST_COLOR_BACKGROUND = clrWhite;
const color EFFHIST_COLOR_AXIS       = clrBlack;
const color EFFHIST_COLOR_TEXT       = clrBlack;
const color EFFHIST_COLOR_BAR        = C'70,110,180';
const color EFFHIST_COLOR_MEAN_LINE  = C'190,30,30';
const color EFFHIST_COLOR_BASELINE   = C'120,120,120';

//+-----------------------------------------------------------------------+
//| CEfficiencyHistogramChart                                             |
//+-----------------------------------------------------------------------+
class CEfficiencyHistogramChart
  {
private:
   CCanvas           m_canvas;
   string            m_object_name;
   bool              m_canvas_created;
   int               m_left_margin;
   int               m_bottom_margin;
   int               m_top_margin;
   int               m_right_margin;

   int               FindMaxBinCount(const int &bins[], int bin_count) const;
   void              DrawReferenceLine(int plot_x, int plot_y, int plot_w, int plot_h, double position,
                                       color line_color, const string label);

public:
                     CEfficiencyHistogramChart(const string object_name);
                    ~CEfficiencyHistogramChart(void);
   bool              Draw(const int &bins[], int bin_count, double mean_efficiency, bool mean_defined,
                          int x, int y, int width, int height);
   void              Clear(void);
  };

//+--------------------------------------------------------------------+
//| Constructor                                                        |
//| Stores the chart object name and establishes the default layout    |
//| geometry. The canvas is created lazily on the first call to Draw().|
//+--------------------------------------------------------------------+
CEfficiencyHistogramChart::CEfficiencyHistogramChart(const string object_name)
  {
   m_object_name    = object_name;
   m_canvas_created = false;
   m_left_margin    = 50;
   m_bottom_margin  = 50;
   m_top_margin     = 40;
   m_right_margin   = 20;
  }

//+------------------------------------------------------------------+
//| Destructor                                                       |
//| Intentionally empty, for the same persistent-panel reason used   |
//| throughout this project.                                         |
//+------------------------------------------------------------------+
CEfficiencyHistogramChart::~CEfficiencyHistogramChart(void)
  {
  }

//+------------------------------------------------------------------+
//| Clear                                                            |
//| Explicitly removes the chart panel.                              |
//+------------------------------------------------------------------+
void CEfficiencyHistogramChart::Clear(void)
  {
   if(m_canvas_created)
     {
      m_canvas.Destroy();
      m_canvas_created = false;
     }
  }
FindMaxBinCount() scans the bins for the tallest bar, which sets the vertical scale for the whole chart. DrawReferenceLine() draws one vertical dashed line at a given position along the efficiency axis, with a short label above it. Both the 0.5 baseline and the mean-efficiency line reuse this method, differing only in position, color, and label.
//+------------------------------------------------------------------+
//| FindMaxBinCount                                                  |
//+------------------------------------------------------------------+
int CEfficiencyHistogramChart::FindMaxBinCount(const int &bins[],const int bin_count) const
  {
   int max_count = 0;
   for(int i = 0; i < bin_count; i++)
     {
      if(bins[i] > max_count)
         max_count = bins[i];
     }
   return(max_count);
  }

//+----------------------------------------------------------------------+
//| DrawReferenceLine                                                    |
//+----------------------------------------------------------------------+
void CEfficiencyHistogramChart::DrawReferenceLine(const int plot_x,const int plot_y,const int plot_w,const int plot_h,
      const double position,const color line_color,const string label)
  {
   int line_x = plot_x + (int)(position * plot_w);
   m_canvas.LineStyleSet(STYLE_DASH);
   m_canvas.Line(line_x, plot_y, line_x, plot_y + plot_h, ::ColorToARGB(line_color, 255));
   m_canvas.LineStyleSet(STYLE_SOLID);
   m_canvas.FontSet("Arial", 10, FW_BOLD, 0);
   ::TextSetFont("Arial", 10, FW_BOLD, 0);
   uint label_w = 0, label_h = 0;
   ::TextGetSize(label, label_w, label_h);
   m_canvas.TextOut(line_x - (int)label_w / 2, plot_y - (int)label_h - 4, label, ::ColorToARGB(line_color, 255));
  }
Draw() builds the panel: bars scaled to the tallest bin, axis lines and labels, and the two reference lines. When a strategy's mean efficiency lands close to 0.5, the two reference lines sit near enough together that their text labels can overlap and become unreadable. The fix cannot use a fixed distance in efficiency units. A small numeric gap can still be too few pixels once label widths are considered. Instead, Draw() measures both label strings with TextGetSize(), converts both positions into actual pixel coordinates, and only suppresses the baseline's label when the true pixel gap is smaller than half of each label's width combined, plus a small margin. The baseline's dashed line is still drawn either way; only its text is dropped.
//+----------------------------------------------------------------------+
//| Draw                                                                 |
//+----------------------------------------------------------------------+
bool CEfficiencyHistogramChart::Draw(const int &bins[],const int bin_count,const double mean_efficiency,
                                     const bool mean_defined,const int x,const int y,const int width,const int height)
  {
   if(!m_canvas_created)
     {
      if(!m_canvas.CreateBitmapLabel(m_object_name, x, y, width, height, COLOR_FORMAT_ARGB_NORMALIZE))
        {
         ::Print("CEfficiencyHistogramChart: failed to create canvas for object '", m_object_name, "'.");
         return(false);
        }
      m_canvas_created = true;
     }
   m_canvas.Erase(::ColorToARGB(EFFHIST_COLOR_BACKGROUND, 255));

   int max_bin_count = FindMaxBinCount(bins, bin_count);

   if(bin_count <= 0 || max_bin_count <= 0)
     {
      m_canvas.FontSet("Arial", 11, 0, 0);
      ::TextSetFont("Arial", 11, 0, 0);
      string message = "No trades with a defined entry efficiency to display.";
      m_canvas.TextOut(m_left_margin, m_top_margin, message, ::ColorToARGB(EFFHIST_COLOR_TEXT, 255));
      m_canvas.Update(true);
      return(true);
     }

   int plot_x = m_left_margin;
   int plot_y = m_top_margin;
   int plot_w = width  - m_left_margin - m_right_margin;
   int plot_h = height - m_top_margin  - m_bottom_margin;

   m_canvas.FontSet("Arial", 12, FW_BOLD, 0);
   ::TextSetFont("Arial", 12, FW_BOLD, 0);
   m_canvas.TextOut(m_left_margin, 10, "Entry Efficiency Distribution", ::ColorToARGB(EFFHIST_COLOR_TEXT, 255));

//--- axis lines
   int origin_x = plot_x;
   int origin_y = plot_y + plot_h;
   m_canvas.Line(origin_x, origin_y, origin_x + plot_w, origin_y, ::ColorToARGB(EFFHIST_COLOR_AXIS, 255));
   m_canvas.Line(origin_x, origin_y, origin_x, plot_y, ::ColorToARGB(EFFHIST_COLOR_AXIS, 255));

//--- efficiency axis labels
   m_canvas.FontSet("Arial", 10, 0, 0);
   ::TextSetFont("Arial", 10, 0, 0);
   m_canvas.TextOut(origin_x - 4, origin_y + 6, "0.0", ::ColorToARGB(EFFHIST_COLOR_TEXT, 255));
   m_canvas.TextOut(origin_x + plot_w / 2 - 8, origin_y + 6, "0.5", ::ColorToARGB(EFFHIST_COLOR_TEXT, 255));
   m_canvas.TextOut(origin_x + plot_w - 18, origin_y + 6, "1.0", ::ColorToARGB(EFFHIST_COLOR_TEXT, 255));

//--- one bar per bin, scaled to the tallest bin
   double bin_width = (double)plot_w / bin_count;
   for(int i = 0; i < bin_count; i++)
     {
      double bar_fraction = (double)bins[i] / max_bin_count;
      int bar_height = (int)(bar_fraction * plot_h);
      int bar_x0 = plot_x + (int)(i * bin_width);
      int bar_x1 = plot_x + (int)((i + 1) * bin_width) - 2;
      int bar_y0 = origin_y - bar_height;
      if(bar_height > 0)
         m_canvas.FillRectangle(bar_x0, bar_y0, bar_x1, origin_y, ::ColorToARGB(EFFHIST_COLOR_BAR, 220));
     }

//--- fixed reference line: the efficiency a random, direction-blind entry would average
//--- when the mean line sits close enough to the 0.5 line that their two labels would
//--- visually overlap, the baseline line is still drawn but its label is dropped in
//--- favor of the mean's label. Collision is judged in actual pixels, not efficiency
//--- units, since a small numeric gap can still be far too narrow for two text labels
//--- once their own rendered widths are taken into account.
   string baseline_label = "0.5 baseline";
   if(mean_defined)
     {
      m_canvas.FontSet("Arial", 10, FW_BOLD, 0);
      ::TextSetFont("Arial", 10, FW_BOLD, 0);
      uint baseline_label_w = 0, baseline_label_h = 0;
      uint mean_label_w = 0, mean_label_h = 0;
      ::TextGetSize(baseline_label, baseline_label_w, baseline_label_h);
      ::TextGetSize("mean", mean_label_w, mean_label_h);

      int baseline_x = plot_x + (int)(0.5 * plot_w);
      int mean_x     = plot_x + (int)(mean_efficiency * plot_w);
      int required_clearance = (int)(baseline_label_w / 2 + mean_label_w / 2) + 6;
      int pixel_gap = mean_x - baseline_x;
      if(pixel_gap < 0)
         pixel_gap = -pixel_gap;

      if(pixel_gap < required_clearance)
         baseline_label = "";
     }
   DrawReferenceLine(plot_x, plot_y, plot_w, plot_h, 0.5, EFFHIST_COLOR_BASELINE, baseline_label);

//--- mean-efficiency line, only when at least one trade has a defined efficiency
   if(mean_defined)
      DrawReferenceLine(plot_x, plot_y, plot_w, plot_h, mean_efficiency, EFFHIST_COLOR_MEAN_LINE, "mean");

   m_canvas.Update(true);
   return(true);
  }
Weekday-Summary-Style Report to the Experts Tab
CTradeTimingSummaryPrinter backs the two charts with exact numbers: how many positions were analyzed, how many were excluded for lack of tick data, the win/loss/breakeven split, the mean efficiency, and the single best and worst entries. Its constructor and destructor do nothing, since the printer holds no state between calls.
//+------------------------------------------------------------------+
//|                                    TradeTimingSummaryPrinter.mqh |
//+------------------------------------------------------------------+
#ifndef TRADETIMINGSUMMARYPRINTER_MQH
#define TRADETIMINGSUMMARYPRINTER_MQH

#include "TradeExcursionTypes.mqh"

//+----------------------------------------------------------------------+
//| CTradeTimingSummaryPrinter                                           |
//+----------------------------------------------------------------------+
class CTradeTimingSummaryPrinter
  {
public:
                     CTradeTimingSummaryPrinter(void);
                    ~CTradeTimingSummaryPrinter(void);
   void              Print(const CTradeExcursion &trades[], int count) const;
  };

//+--------------------------------------------------------------------+
//| Constructor                                                        |
//| The printer holds no state between calls, so construction performs |
//| no work beyond default object creation.                            |
//+--------------------------------------------------------------------+
CTradeTimingSummaryPrinter::CTradeTimingSummaryPrinter(void)
  {
  }

//+------------------------------------------------------------------+
//| Destructor                                                       |
//| No resources are owned by this class, so no cleanup is required. |
//+------------------------------------------------------------------+
CTradeTimingSummaryPrinter::~CTradeTimingSummaryPrinter(void)
  {
  }
Print() performs a single scan of the trade array. A trade's net profit of exactly zero counts as breakeven. When no trade has a defined efficiency, the method prints an explicit message and returns early, avoiding a read past the end of an empty best-or-worst search.
//+-----------------------------------------------------------------------+
//| Print                                                                 |
//+-----------------------------------------------------------------------+
void CTradeTimingSummaryPrinter::Print(const CTradeExcursion &trades[],const int count) const
  {
   int excluded_no_ticks = 0;
   int win_count = 0, loss_count = 0, breakeven_count = 0;
   double efficiency_sum = 0.0;
   int efficiency_defined_count = 0;
   int best_index  = -1;
   int worst_index = -1;

   for(int i = 0; i < count; i++)
     {
      if(trades[i].m_tick_count <= 0)
         excluded_no_ticks++;

      //--- exact breakeven is its own explicit category, never a win or a loss
      if(trades[i].m_net_profit > 0.0)
         win_count++;
      else
         if(trades[i].m_net_profit < 0.0)
            loss_count++;
         else
            breakeven_count++;

      if(trades[i].m_efficiency_defined)
        {
         efficiency_sum += trades[i].m_efficiency;
         efficiency_defined_count++;
         if(best_index < 0 || trades[i].m_efficiency > trades[best_index].m_efficiency)
            best_index = i;
         if(worst_index < 0 || trades[i].m_efficiency < trades[worst_index].m_efficiency)
            worst_index = i;
        }
     }

   ::Print("Trade Entry Timing Summary");
   ::PrintFormat("Closed positions analyzed: %d  (excluded, no tick data: %d)", count, excluded_no_ticks);
   ::PrintFormat("Outcome breakdown: %d wins, %d losses, %d breakeven", win_count, loss_count, breakeven_count);

   if(efficiency_defined_count <= 0)
     {
      ::Print("No trades have a defined entry efficiency (every trade either lacked tick data or showed zero price movement).");
      return;
     }

   double mean_efficiency = efficiency_sum / efficiency_defined_count;
   ::PrintFormat("Mean entry efficiency across %d trades: %.3f", efficiency_defined_count, mean_efficiency);
   int best_digits  = (int)::SymbolInfoInteger(trades[best_index].m_symbol, SYMBOL_DIGITS);
   int worst_digits = (int)::SymbolInfoInteger(trades[worst_index].m_symbol, SYMBOL_DIGITS);
   ::PrintFormat("Best entry:  position #%.0f   efficiency %.3f   MAE %s   MFE %s",
                 (double)trades[best_index].m_position_id, trades[best_index].m_efficiency,
                 ::DoubleToString(trades[best_index].m_mae, best_digits), ::DoubleToString(trades[best_index].m_mfe, best_digits));
   ::PrintFormat("Worst entry: position #%.0f   efficiency %.3f   MAE %s   MFE %s",
                 (double)trades[worst_index].m_position_id, trades[worst_index].m_efficiency,
                 ::DoubleToString(trades[worst_index].m_mae, worst_digits), ::DoubleToString(trades[worst_index].m_mfe, worst_digits));
  }
MAE and MFE are formatted with SYMBOL_DIGITS looked up per trade, not a fixed digit count, since the analyzed symbol is not guaranteed to match whatever symbol the hosting chart happens to be displaying.
Building the Entry Timing Analyzer Dashboard
EntryTimingAnalyzerDashboard.mq5 wires the six preceding components together. It resolves which symbol to analyze, reads that symbol's closed positions, computes MAE, MFE, and efficiency for each, prints the summary, and renders both panels.
The default lookback is 90 days. Tick history is typically retained for a much shorter span than deal history, so a longer window would simply accumulate positions that get excluded later for lack of tick data. Those excluded positions are still counted; they are left out of the charts and reported separately in the summary.
//+------------------------------------------------------------------+
//|                                 EntryTimingAnalyzerDashboard.mq5 |
//+------------------------------------------------------------------+
#property description "Computes Maximum Adverse and Favorable Excursion and entry "
#property description "efficiency for closed positions from tick data, renders a "
#property description "MAE/MFE scatter plot and an efficiency histogram, and prints "
#property description "a summary to the Experts tab."
#property script_show_inputs

#include <EntryTimingAnalyzer/TradeExcursionTypes.mqh>
#include <EntryTimingAnalyzer/PositionHistoryReader.mqh>
#include <EntryTimingAnalyzer/ExcursionCalculator.mqh>
#include <EntryTimingAnalyzer/EfficiencyStatistics.mqh>
#include <EntryTimingAnalyzer/ExcursionScatterChart.mqh>
#include <EntryTimingAnalyzer/EfficiencyHistogramChart.mqh>
#include <EntryTimingAnalyzer/TradeTimingSummaryPrinter.mqh>

input int    InpLookbackDays  = 90; // calendar days to include, counting back from now
input string InpSymbol        = ""; // symbol to analyze; empty means the current chart symbol
input int    InpHistogramBins = 10; // number of bins in the efficiency histogram

//+---------------------------------------------------------------------+
//| Script program start function                                       |
//| Drives the full pipeline: read closed positions for one symbol,     |
//| compute MAE, MFE, and entry efficiency for each from tick data,     |
//| print the analytical summary, and render the scatter plot and the   |
//| histogram. Both chart objects are local to this function; their     |
//| destructors are intentionally empty, so both rendered panels remain |
//| visible on the chart after this function returns.                   |
//+---------------------------------------------------------------------+
void OnStart(void)
  {
//--- resolve which symbol to analyze
   string symbol = (InpSymbol == "") ? _Symbol : InpSymbol;

//--- determine the analysis window, ending at the current server time
   datetime range_to   = ::TimeCurrent();
   datetime range_from = range_to - (datetime)(InpLookbackDays * 86400);

//--- read closed positions on this symbol and group their deals
   CPositionHistoryReader history_reader;
   CTradeExcursion        trades[];
   if(!history_reader.Read(symbol, range_from, range_to, trades))
     {
      ::Print("EntryTimingAnalyzerDashboard: failed to read position history for the requested range.");
      return;
     }
   int trade_count = ::ArraySize(trades);

//--- compute MAE, MFE, and entry efficiency for every closed position
   CExcursionCalculator excursion_calculator;
   for(int i = 0; i < trade_count; i++)
      excursion_calculator.Compute(trades[i]);

//--- print the analytical summary to the Experts tab
   CTradeTimingSummaryPrinter summary_printer;
   summary_printer.Print(trades, trade_count);

//--- render the MAE vs. MFE scatter plot
   CExcursionScatterChart scatter_chart("EntryTiming_Scatter");
   scatter_chart.Draw(trades, trade_count, 20, 20, 460, 340);

//--- compute the efficiency histogram bins and mean, then render them
   CEfficiencyStatistics statistics;
   int bins[];
   statistics.ComputeHistogramBins(trades, trade_count, InpHistogramBins, bins);
   double mean_efficiency = 0.0;
   bool   mean_defined    = statistics.ComputeMeanEfficiency(trades, trade_count, mean_efficiency);

   CEfficiencyHistogramChart histogram_chart("EntryTiming_Histogram");
   histogram_chart.Draw(bins, ::ArraySize(bins), mean_efficiency, mean_defined, 500, 20, 380, 340);

//--- refresh the chart so both panels are visible immediately
   ::ChartRedraw(0);

   ::PrintFormat("EntryTimingAnalyzerDashboard: analyzed %d closed positions on %s covering %s to %s.",
                 trade_count, symbol, ::TimeToString(range_from, TIME_DATE), ::TimeToString(range_to, TIME_DATE));
  }
//+------------------------------------------------------------------+
Both chart objects are declared as ordinary local variables inside this function. Because their destructors do nothing, both rendered panels stay on the chart after OnStart() returns and both objects go out of scope.
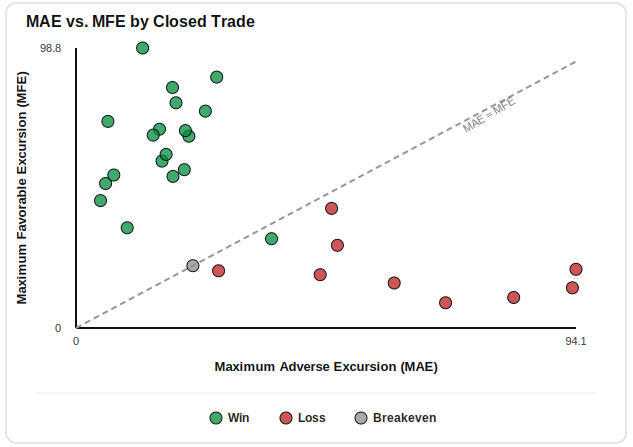
MAE vs. MFE by Closed Trade: Illustrative mock-up, not a live screenshot. Winning trades cluster upper-left with low MAE and high MFE. Losing trades cluster lower-right.
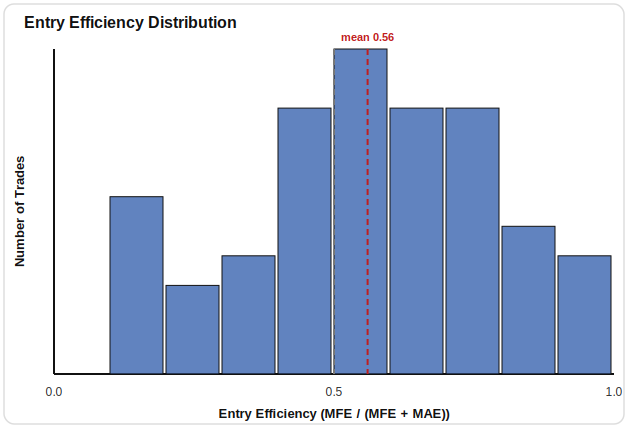
Entry Efficiency Distribution: Illustrative mock-up, not a live screenshot. The mean sits close to the 0.5 baseline, so the baseline's label is dropped to avoid overlap. The dashed line itself still shows.
Verification and Testing
Position grouping and tick retrieval both depend on a live account, so neither can be meaningfully unit tested in a headless script. Everything downstream of that boundary, the excursion arithmetic and the efficiency statistics, is a pure function over plain data instead, and gets exercised directly with synthetic ticks and synthetic trade records.
MakeTick() builds one synthetic MqlTick, setting only bid and ask, the two fields this project's computations actually read. ASSERT() records a pass or failure for one checked condition, printing a diagnostic line with the source line number whenever the condition is false.
//+------------------------------------------------------------------+
//|                                     TestEntryTimingAnalytics.mq5 |
//+------------------------------------------------------------------+
#property description "Verifies MAE/MFE computation, entry efficiency, and the "
#property description "efficiency statistics using synthetic ticks and synthetic "
#property description "trade records, independent of any live account or tick history."
#property script_show_inputs

#include <EntryTimingAnalyzer/TradeExcursionTypes.mqh>
#include <EntryTimingAnalyzer/ExcursionCalculator.mqh>
#include <EntryTimingAnalyzer/EfficiencyStatistics.mqh>

//--- assertion counters, updated by the ASSERT macro used throughout this script
int g_assertion_passes   = 0;
int g_assertion_failures = 0;

//+----------------------------------------------------------------------+
//| ASSERT                                                               |
//+----------------------------------------------------------------------+
#define ASSERT(condition, message)                                          \
   if(!(condition))                                                         \
     {                                                                      \
      ::PrintFormat("ASSERTION FAILED: %s (line %d)", (message), __LINE__); \
      g_assertion_failures++;                                               \
     }                                                                      \
   else                                                                     \
     {                                                                      \
      g_assertion_passes++;                                                 \
     }

//+--------------------------------------------------------------------+
//| MakeTick                                                           |
//+--------------------------------------------------------------------+
MqlTick MakeTick(double bid,double ask)
  {
   MqlTick tick;
   tick.time        = 0;
   tick.bid         = bid;
   tick.ask         = ask;
   tick.last        = 0.0;
   tick.volume      = 0;
   tick.time_msc    = 0;
   tick.flags       = 0;
   tick.volume_real = 0.0;
   return(tick);
  }
The first cluster of tests covers ComputeExcursionFromTicks() directly: a synthetic long sequence checks MFE against the largest rise and MAE against the largest drop, a mirrored short sequence checks the same with bid and ask swapped, and an empty array checks that the method reports failure rather than a computed zero.
//+-----------------------------------------------------------------------+
//| TestComputeExcursionFromTicksLong                                     |
//| Verifies MAE and MFE for a long position: the bid rising above entry  |
//| price is favorable, the bid falling below entry price is adverse, and |
//| both figures are reported as non-negative distances regardless of the |
//| order the ticks arrive in.                                            |
//+-----------------------------------------------------------------------+
void TestComputeExcursionFromTicksLong(void)
  {
   MqlTick ticks[];
   ArrayResize(ticks, 5);
   double entry_price = 1.1000;
   ticks[0] = MakeTick(1.1000, 1.1002);
   ticks[1] = MakeTick(1.1030, 1.1032); // +30 pips favorable so far
   ticks[2] = MakeTick(1.0985, 1.0987); // -15 pips adverse so far
   ticks[3] = MakeTick(1.1050, 1.1052); // +50 pips favorable, new best
   ticks[4] = MakeTick(1.1010, 1.1012); // pulls back, but not past prior extremes

   CExcursionCalculator calculator;
   double mae = 0.0, mfe = 0.0;
   bool ok = calculator.ComputeExcursionFromTicks(ticks, ArraySize(ticks), entry_price, true, mae, mfe);

   ASSERT(ok, "ComputeExcursionFromTicks must succeed for a non-empty tick array.");
   ASSERT(MathAbs(mfe - 0.0050) < 0.00001, "Long MFE must equal the largest bid rise above entry price.");
   ASSERT(MathAbs(mae - 0.0015) < 0.00001, "Long MAE must equal the largest bid drop below entry price.");
  }

//+----------------------------------------------------------------------+
//| TestComputeExcursionFromTicksShort                                   |
//| Verifies the mirrored logic for a short position: the ask falling    |
//| below entry price is favorable, and the ask rising above entry price |
//| is adverse.                                                          |
//+----------------------------------------------------------------------+
void TestComputeExcursionFromTicksShort(void)
  {
   MqlTick ticks[];
   ArrayResize(ticks, 4);
   double entry_price = 1.2000;
   ticks[0] = MakeTick(1.1998, 1.2000);
   ticks[1] = MakeTick(1.1960, 1.1962); // ask down 38 pips, favorable for a short
   ticks[2] = MakeTick(1.2025, 1.2027); // ask up 27 pips, adverse for a short
   ticks[3] = MakeTick(1.1980, 1.1982); // partial retrace, not a new extreme

   CExcursionCalculator calculator;
   double mae = 0.0, mfe = 0.0;
   bool ok = calculator.ComputeExcursionFromTicks(ticks, ArraySize(ticks), entry_price, false, mae, mfe);

   ASSERT(ok, "ComputeExcursionFromTicks must succeed for a non-empty tick array.");
   ASSERT(MathAbs(mfe - 0.0038) < 0.00001, "Short MFE must equal the largest ask drop below entry price.");
   ASSERT(MathAbs(mae - 0.0027) < 0.00001, "Short MAE must equal the largest ask rise above entry price.");
  }

//+----------------------------------------------------------------------+
//| TestComputeExcursionFromTicksEmpty                                   |
//| Verifies that an empty tick array is reported as a failure rather    |
//| than as a computed zero MAE and MFE, so a caller can distinguish "no |
//| ticks available" from "ticks available but no movement occurred."    |
//+----------------------------------------------------------------------+
void TestComputeExcursionFromTicksEmpty(void)
  {
   MqlTick ticks[];
   ArrayResize(ticks, 0);
   CExcursionCalculator calculator;
   double mae = 0.0, mfe = 0.0;
   bool ok = calculator.ComputeExcursionFromTicks(ticks, 0, 1.1000, true, mae, mfe);
   ASSERT(!ok, "ComputeExcursionFromTicks must return false for an empty tick array.");
  }
The second cluster covers ComputeEfficiency(): a typical, nonzero pair checks the standard formula, an all-zero pair confirms the undefined case is reported rather than silently returning 0.0, and the two one-sided boundaries check that a zero on either side gives exactly 1.0 or exactly 0.0.
//+---------------------------------------------------------------------+
//| TestComputeEfficiencyNormal                                         |
//| Verifies the standard efficiency formula for a typical, nonzero MAE |
//| and MFE pair.                                                       |
//+---------------------------------------------------------------------+
void TestComputeEfficiencyNormal(void)
  {
   CExcursionCalculator calculator;
   double efficiency = 0.0;
   bool ok = calculator.ComputeEfficiency(20.0, 80.0, efficiency);
   ASSERT(ok, "ComputeEfficiency must succeed when MAE and MFE are not both zero.");
   ASSERT(MathAbs(efficiency - 0.8) < 0.0001, "Efficiency must equal MFE / (MFE + MAE).");
  }

//+---------------------------------------------------------------------+
//| TestComputeEfficiencyAllZero                                        |
//| Verifies that a trade with zero MAE and zero MFE, meaning no tick-  |
//| level price movement was observed at all, is reported as undefined  |
//| rather than as a computed 0.0 efficiency.                           |
//+---------------------------------------------------------------------+
void TestComputeEfficiencyAllZero(void)
  {
   CExcursionCalculator calculator;
   double efficiency = 0.0;
   bool ok = calculator.ComputeEfficiency(0.0, 0.0, efficiency);
   ASSERT(!ok, "ComputeEfficiency must report undefined when MAE and MFE are both exactly zero.");
  }

//+------------------------------------------------------------------------+
//| TestComputeEfficiencyOneSided                                          |
//| Verifies the two boundary cases: an MAE of exactly zero must yield an  |
//| efficiency of exactly 1.0, and an MFE of exactly zero must yield an    |
//| efficiency of exactly 0.0.                                             |
//+------------------------------------------------------------------------+
void TestComputeEfficiencyOneSided(void)
  {
   CExcursionCalculator calculator;
   double efficiency_all_favorable = 0.0;
   bool ok1 = calculator.ComputeEfficiency(0.0, 50.0, efficiency_all_favorable);
   ASSERT(ok1, "ComputeEfficiency must succeed when MFE alone is nonzero.");
   ASSERT(efficiency_all_favorable == 1.0, "Zero MAE with nonzero MFE must give an efficiency of exactly 1.0.");

   double efficiency_all_adverse = 0.0;
   bool ok2 = calculator.ComputeEfficiency(50.0, 0.0, efficiency_all_adverse);
   ASSERT(ok2, "ComputeEfficiency must succeed when MAE alone is nonzero.");
   ASSERT(efficiency_all_adverse == 0.0, "Zero MFE with nonzero MAE must give an efficiency of exactly 0.0.");
  }
The third cluster covers CEfficiencyStatistics: mean efficiency computed only from defined entries, the histogram's exact-0.0 and exact-1.0 boundaries, and win/loss/breakeven classification including a net profit of exactly zero.
//+----------------------------------------------------------------------+
//| TestComputeMeanEfficiency                                            |
//| Verifies that the mean is computed only over trades with a defined   |
//| efficiency, and that an all-undefined array is reported as a failure |
//| rather than a mean of zero.                                          |
//+----------------------------------------------------------------------+
void TestComputeMeanEfficiency(void)
  {
   CTradeExcursion trades[];
   ArrayResize(trades, 3);
   trades[0].m_efficiency_defined = true;
   trades[0].m_efficiency = 0.80;
   trades[1].m_efficiency_defined = false;
   trades[1].m_efficiency = 0.0;
   trades[2].m_efficiency_defined = true;
   trades[2].m_efficiency = 0.40;

   CEfficiencyStatistics statistics;
   double mean_efficiency = 0.0;
   bool ok = statistics.ComputeMeanEfficiency(trades, ArraySize(trades), mean_efficiency);

   ASSERT(ok, "ComputeMeanEfficiency must succeed when at least one trade has a defined efficiency.");
   ASSERT(MathAbs(mean_efficiency - 0.60) < 0.0001, "Mean efficiency must average only the defined entries.");

   CTradeExcursion undefined_trades[];
   ArrayResize(undefined_trades, 2);
   undefined_trades[0].m_efficiency_defined = false;
   undefined_trades[1].m_efficiency_defined = false;
   double undefined_mean = 0.0;
   bool undefined_ok = statistics.ComputeMeanEfficiency(undefined_trades, ArraySize(undefined_trades), undefined_mean);
   ASSERT(!undefined_ok, "ComputeMeanEfficiency must fail when no trade has a defined efficiency.");
  }

//+------------------------------------------------------------------------+
//| TestComputeHistogramBinsBoundary                                       |
//| Verifies the histogram boundary cases most likely to expose an         |
//| off-by-one error: an efficiency of exactly 0.0 must land in the first  |
//| bin, and an efficiency of exactly 1.0 must land in the last bin rather |
//| than one position past it.                                             |
//+------------------------------------------------------------------------+
void TestComputeHistogramBinsBoundary(void)
  {
   CTradeExcursion trades[];
   ArrayResize(trades, 3);
   trades[0].m_efficiency_defined = true;
   trades[0].m_efficiency = 0.0;  // must land in bin 0
   trades[1].m_efficiency_defined = true;
   trades[1].m_efficiency = 1.0;  // must land in the last bin
   trades[2].m_efficiency_defined = true;
   trades[2].m_efficiency = 0.55; // must land in the middle

   CEfficiencyStatistics statistics;
   int bins[];
   int bin_count = 10;
   statistics.ComputeHistogramBins(trades, ArraySize(trades), bin_count, bins);

   ASSERT(ArraySize(bins) == bin_count, "ComputeHistogramBins must produce exactly bin_count bins.");
   ASSERT(bins[0] == 1, "An efficiency of exactly 0.0 must land in bin 0.");
   ASSERT(bins[bin_count - 1] == 1, "An efficiency of exactly 1.0 must land in the last bin, not one past it.");
   ASSERT(bins[5] == 1, "An efficiency of 0.55 must land in bin 5 of 10.");
  }

//+-----------------------------------------------------------------------+
//| TestComputeWinLossCounts                                              |
//| Verifies the win/loss/breakeven classification, including a trade     |
//| with a net profit of exactly zero, which must count as breakeven and  |
//| never as a win or a loss.                                             |
//+-----------------------------------------------------------------------+
void TestComputeWinLossCounts(void)
  {
   CTradeExcursion trades[];
   ArrayResize(trades, 4);
   trades[0].m_net_profit = 120.50;
   trades[1].m_net_profit = -45.25;
   trades[2].m_net_profit = 0.0;
   trades[3].m_net_profit = -10.00;

   CEfficiencyStatistics statistics;
   int win_count = 0, loss_count = 0, breakeven_count = 0;
   statistics.ComputeWinLossCounts(trades, ArraySize(trades), win_count, loss_count, breakeven_count);

   ASSERT(win_count == 1, "Exactly one trade has a positive net profit.");
   ASSERT(loss_count == 2, "Exactly two trades have a negative net profit.");
   ASSERT(breakeven_count == 1, "A net profit of exactly zero must count as breakeven, not a win or a loss.");
  }
OnStart() runs every test function in sequence and prints a final pass and fail count. Nothing here touches a chart or a live account; every input across every test is synthetic.
//+---------------------------------------------------------------------+
//| Script program start function                                       |
//| Runs every test function in sequence and prints a final pass/fail   |
//| summary. This script performs no chart rendering and requires no    |
//| live account history or tick history: every input is synthetic.     |
//+---------------------------------------------------------------------+
void OnStart(void)
  {
   g_assertion_passes   = 0;
   g_assertion_failures = 0;

   ::Print("Running TestEntryTimingAnalytics...");

   TestComputeExcursionFromTicksLong();
   TestComputeExcursionFromTicksShort();
   TestComputeExcursionFromTicksEmpty();
   TestComputeEfficiencyNormal();
   TestComputeEfficiencyAllZero();
   TestComputeEfficiencyOneSided();
   TestComputeMeanEfficiency();
   TestComputeHistogramBinsBoundary();
   TestComputeWinLossCounts();

   ::PrintFormat("TestEntryTimingAnalytics complete: %d passed, %d failed.", g_assertion_passes, g_assertion_failures);
   if(g_assertion_failures == 0)
      ::Print("TEST SUITE PASSED");
   else
      ::Print("TEST SUITE FAILED");
  }
Extending the Dashboard
Filtering by magic number: Checking DEAL_MAGIC alongside the symbol filter in Read() would isolate the entry timing of a single expert advisor sharing an account with other strategies, with no change needed elsewhere.
Comparing multiple symbols: ComputeHistogramBins() already accepts any array of CTradeExcursion records regardless of symbol. Running Read() once per symbol and concatenating results would produce one cross-symbol efficiency picture, though the scatter plot's shared axis would need a caveat, since price units are not comparable across symbols with different pip values.
Weighting by position size: Adding a volume field and a volume-weighted variant of ComputeMeanEfficiency() would show whether entry quality was better or worse on the trades carrying the most risk.
Exporting to CSV: CTradeExcursion is already a flat, minimal row shape. A small file-writing routine iterating the trades array after Compute() runs on each one needs no changes elsewhere.
Limitations and Design Tradeoffs
Tick history is the main constraint. Deal history is retained much longer, so longer lookbacks often include positions with no remaining tick data. Those are counted and reported as excluded rather than silently dropped, but a small analyzed sample is worth reading as a symptom of that constraint before it gets read as a symptom of low trading frequency.
Entry efficiency uses an exact mae + mfe == 0.0 check to detect the no-movement case. MAE and MFE are the result of many floating-point subtractions across a tick sequence, so a position with only sub-point movement in an extremely quiet market could land close to, but not bitwise equal to, zero on one side, in which case it would be treated as a very small nonzero excursion. A small epsilon tolerance would be a reasonable addition for production use.
The scatter plot's diagonal reference line assumes MAE and MFE are directly comparable in price units, which holds within one symbol but not across symbols with different point values, which is why this project analyzes one symbol per run.
The position-grouping logic assumes a straightforward entry-then-close sequence per position identifier. A reversal that both closes a position and opens a new one through a single DEAL_ENTRY_INOUT deal contributes its close time correctly, but should be checked against a real account's own history before being trusted, since position-identifier behavior around such deals can vary with account type and hedging mode.
An entry efficiency below 0.5 on average is a starting point for a question about a strategy's entry logic. It is not proof that the entries are poorly timed in any statistically rigorous sense, particularly on a small sample of trades.
Conclusion
This project turns closed position history and tick data into a direct answer to a question standard reports cannot address: how good was the timing of each entry, independent of whether the trade happened to close as a win or a loss. CPositionHistoryReader reduces deal history down to one record per fully visible closed position. CExcursionCalculator keeps tick retrieval and excursion arithmetic in separate methods, so the arithmetic that actually defines MAE, MFE, and entry efficiency stays testable with synthetic ticks.
CEfficiencyStatistics reduces many trades into a mean and a histogram without touching a canvas. CExcursionScatterChart and CEfficiencyHistogramChart share the same persistent-panel lifecycle used across this article, and CTradeTimingSummaryPrinter backs both charts with exact figures.
The scatter plot answers whether winners and losers separate cleanly by MAE and MFE. The histogram answers whether that separation is typical for this strategy, or close to what a coin flip would produce. Neither, by itself, proves a causal claim about why any single trade moved the way it did, and this project does not present itself as though it does.
Programs used in the article:
| # | Name | Type | Description |
|---|---|---|---|
| 1 | TradeExcursionTypes.mqh | Include File | Defines CTradeExcursion, the record carrying both entry-side facts and computed excursion figures |
| 2 | PositionHistoryReader.mqh | Include File | Defines CPositionHistoryReader, which groups closed deal history into one record per fully visible position |
| 3 | ExcursionCalculator.mqh | Include File | Defines CExcursionCalculator, which computes MAE, MFE, and entry efficiency from tick data |
| 4 | EfficiencyStatistics.mqh | Include File | Defines CEfficiencyStatistics, which reduces trade records into a mean efficiency, histogram bins, and a win/loss/breakeven split |
| 5 | ExcursionScatterChart.mqh | Include File | Defines CExcursionScatterChart, which renders the MAE vs. MFE scatter plot using CCanvas |
| 6 | EfficiencyHistogramChart.mqh | Include File | Defines CEfficiencyHistogramChart, which renders the entry efficiency histogram using CCanvas |
| 7 | TradeTimingSummaryPrinter.mqh | Include File | Defines CTradeTimingSummaryPrinter, which prints the position count, outcome split, and best/worst entries to the Experts tab |
| 8 | EntryTimingAnalyzerDashboard.mq5 | Script | The main script that wires all the components together and renders the dashboard |
| 9 | TestEntryTimingAnalytics.mq5 | Script | A verification script that checks the excursion arithmetic and the efficiency statistics using synthetic data |
| 10 | EntryTimingAnalyzer.zip | Zip Archive | Zip archive containing all the attached files and their paths relative to the terminal's root folder. |
Warning: All rights to these materials are reserved by MetaQuotes Ltd. Copying or reprinting of these materials in whole or in part is prohibited.
This article was written by a user of the site and reflects their personal views. MetaQuotes Ltd is not responsible for the accuracy of the information presented, nor for any consequences resulting from the use of the solutions, strategies or recommendations described.

 MetaTrader 5 Machine Learning Blueprint (Part 22): Auditing the Selection Criterion — Measuring Overfit in Hyperparameter Search
 Building AI-Powered Trading Systems in MQL5 (Part 12): Giving the Assistant Chart Vision and Tool Access
 Larry Williams Market Secrets (Part 18): Automating the Greatest Swing Value Breakout Strategy in MQL5
 Neural Networks in Trading: From Transformers to Spiking Neurons (Key Components)

- Free trading apps
- Over 8,000 signals for copying
- Economic news for exploring financial markets
You agree to website policy and terms of use