

Monthly Profit and Loss Calendar Heatmap Renderer in MQL5
 152
152
 0
0

Introduction
A trading account's history report is a list. It tells you what happened, in the order it happened, and it is very good at telling you the total. What it is not good at is telling you the shape of your trading over time. Was last month's drawdown one bad week, or a string of small losses spread evenly across the month? Are Fridays quietly worse than the rest of the week? Did a burst of overtrading on a handful of dates coincide with a losing streak, or was it unrelated? A report answers these questions only if you scroll through it and keep a mental tally. This is exactly the kind of task human vision is bad at, while pattern recognition is good at.
A calendar heatmap reframes the same data as a picture instead of a list. Anyone who has used a version control platform has seen the contributions graph: a grid of small colored squares, one column per week, one row per day of the week, shaded by how much happened on that date. The same layout works for trading performance. Week columns run left to right, weekday rows run top to bottom, and each calendar cell is shaded according to that date's daily P&L. Clusters, streaks, and weekday patterns that would take real effort to extract from a table become visible in a glance.
This article builds an MQL5 script that reads closed deal history. It reduces the data to net profit and trade count per calendar date and renders a calendar heatmap using CCanvas. It also renders a second view of the same grid, colored by trade count instead of P&L, and it prints a weekday-level numerical summary to the Experts tab so that the visual pattern can be checked against exact figures.
It is worth being honest up front about what this tool does and does not do. A calendar heatmap is an exploratory device. It can suggest that Mondays look weaker than other days, or that a losing streak clustered in a particular week, but it cannot tell you whether that pattern is a real, repeatable effect or an artifact of a small sample looked at with the benefit of hindsight. Nothing in this project performs a significance test, and nothing in it should be read as a trading signal. Treat the heatmap the way you would treat a good chart in any other kind of analysis: a tool for asking better questions, not an answer in itself.
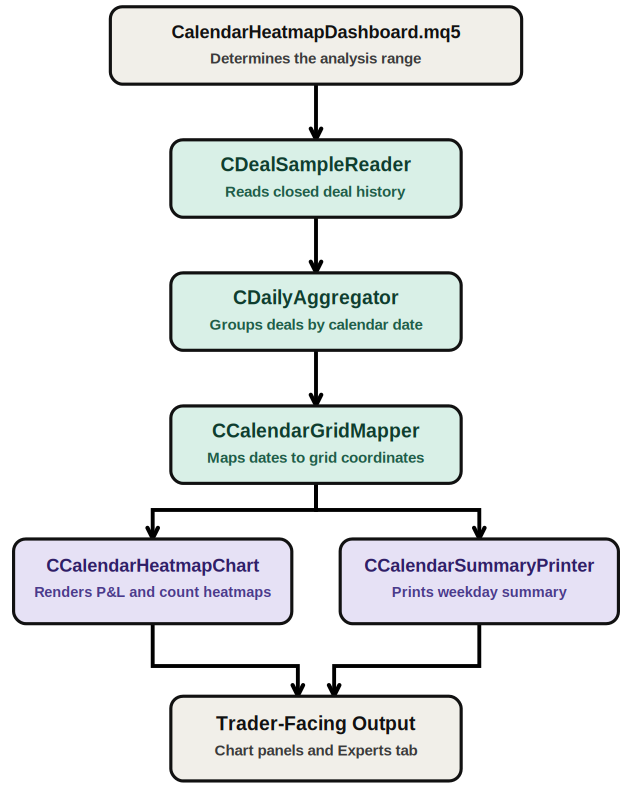
Calendar Heatmap Architecture: Data flows from the main script through the deal reader, aggregator, and grid mapper. It then fans out to the chart and summary printer, ending in trader-facing output.
Data Model: Deal Samples and Daily Records
Everything downstream of the raw deal history depends on getting the data model right, so it is worth settling before any other component. Two structures are enough for the whole pipeline: one that represents a single relevant closed deal in its most reduced form, and one that represents a single calendar date's worth of aggregated results.
The deal-level structure, CDealSample, is deliberately minimal. It holds only a close timestamp and a net profit figure. Nothing else about a deal, not its symbol, its volume, its ticket number, or its order type, is needed anywhere in this pipeline, so nothing else is kept. Keeping the sample this narrow has a real benefit beyond tidiness: it makes the aggregation stage trivial to reason about, because there is nothing to aggregate except a sum and a count, and it makes the sample trivial to construct by hand in a test, since a synthetic CDealSample is just two field assignments.
//+------------------------------------------------------------------+
//|                                                CalendarTypes.mqh |
//+------------------------------------------------------------------+
#ifndef CALENDARTYPES_MQH
#define CALENDARTYPES_MQH

//+------------------------------------------------------------------+
//| CDealSample                                                      |
//+------------------------------------------------------------------+
class CDealSample
  {
public:
   datetime          m_close_time;   // server-time close timestamp of the deal
   double            m_net_profit;   // profit + swap + commission for this deal
                     CDealSample(void);
  };

//+------------------------------------------------------------------+
//| Constructor                                                      |
//| Initializes a deal sample to a neutral, explicit default state so|
//| that an uninitialized sample can never be mistaken for a deal    |
//| that genuinely closed at time zero with a real profit value.     |
//+------------------------------------------------------------------+
CDealSample::CDealSample(void)
  {
   m_close_time = 0;
   m_net_profit = 0.0;
  }
The date-level structure, CDailyRecord, is the output of aggregation and the input to both rendering and summarization. It holds the normalized calendar date, the daily P&L, and the trade count for that date. Storing the date normalized to midnight lets downstream components use CDailyRecord.m_date as a ready-to-use grouping and coordinate key. This avoids repeating the normalization step in the grid mapper, renderer, and summary printer. Daily P&L and trade count are stored in the same record, not in parallel arrays, because they always travel together. A calendar cell needs both values: one for color and one to distinguish 'no trades' from 'zero P&L.
//+------------------------------------------------------------------+
//| CDailyRecord                                                     |
//+------------------------------------------------------------------+
class CDailyRecord
  {
public:
   datetime          m_date;         // normalized calendar date (midnight, server time)
   double            m_daily_pnl;    // sum of net profit for every deal closed on m_date
   int               m_trade_count;  // number of deals closed on m_date
                     CDailyRecord(void);
  };

//+-------------------------------------------------------------------+
//| Constructor                                                       |
//| Initializes a daily record to an explicit, unambiguous zero state.|
//| Because zero is a legitimate and meaningful daily P&L value, the  |
//| constructor must not use any sentinel other than a genuine zero;  |
//| callers are expected to test m_trade_count to know whether a      |
//| record actually represents observed trading activity.             |
//+-------------------------------------------------------------------+
CDailyRecord::CDailyRecord(void)
  {
   m_date        = 0;
   m_daily_pnl   = 0.0;
   m_trade_count = 0;
  }
Both classes are plain data holders with public fields rather than private fields behind accessors. This is a deliberate choice for this project: a CDealSample and a CDailyRecord exist purely to move a small, fixed set of values between components, and MQL5 code that works this way, in the same spirit as the trade and order structures used throughout the platform's own APIs, reads more clearly than a data class wrapped in getters and setters that add no behavior of their own. Each class still gets a default constructor that sets an explicit, unambiguous zero state, which matters because zero is a legitimate value for daily P&L and must never be confused with an uninitialized field.
Reading Closed Deal History
MQL5 distinguishes orders, deals, and positions. An order instructs the broker; a deal executes all or part of an order; a position is the running net result of one or more deals on a symbol. This project only needs deals: they're what the terminal's history functions expose, and they carry the realized profit figure the dashboard needs.
Not every deal represents realized profit or loss. DEAL_ENTRY_IN opens a position, so its profit field is meaningless at that moment. DEAL_ENTRY_OUT closes a position against an opposite deal, and DEAL_ENTRY_INOUT closes and immediately reopens it in the other direction, on hedging-capable accounts. Both realize profit or loss on execution, so CDealSampleReader keeps only those two entry types. This treats "realized P&L" as "P&L attributable to a closing action." A different question, like "when were positions opened," would need DEAL_ENTRY_IN instead.
//+------------------------------------------------------------------+
//|                                            DealSampleReader.mqh  |
//+------------------------------------------------------------------+
#ifndef DEALSAMPLEREADER_MQH
#define DEALSAMPLEREADER_MQH

#include "CalendarTypes.mqh"

//+------------------------------------------------------------------+
//| CDealSampleReader                                                |
//+------------------------------------------------------------------+
class CDealSampleReader
  {
public:
                     CDealSampleReader(void);
                    ~CDealSampleReader(void);
   bool              Read(datetime from, datetime to, CDealSample &deals_out[]);
  };

//+------------------------------------------------------------------+
//| Constructor                                                      |
//| The reader is stateless between calls, so construction performs  |
//| no work beyond default object creation.                          |
//+------------------------------------------------------------------+
CDealSampleReader::CDealSampleReader(void)
  {
  }

//+------------------------------------------------------------------+
//| Destructor                                                       |
//| No resources are owned by this class, so no cleanup is required. |
//+------------------------------------------------------------------+
CDealSampleReader::~CDealSampleReader(void)
  {
  }
Net profit for each retained deal is profit + swap + commission, a documented convention rather than the only possible one. It reflects what the account actually gained or lost, including carrying and transaction costs. A reader wanting gross P&L, excluding swap and commission, would change one line in this class; every other component only sees the already-summed m_net_profit field.
CDealSampleReader::Read calls HistorySelect to build the terminal's history cache, then walks it with HistoryDealsTotal and HistoryDealGetTicket. History availability depends entirely on the connected terminal and account. A range predating what's cached simply yields fewer samples, not an error.
//+------------------------------------------------------------------+
//| Read                                                             |
//+------------------------------------------------------------------+
bool CDealSampleReader::Read(datetime from,datetime to,CDealSample &deals_out[])
  {
//--- start from an empty output buffer regardless of any prior contents
   ::ArrayResize(deals_out, 0);
//--- ask the terminal to build the history cache for the requested interval
   if(!::HistorySelect(from, to))
     {
      ::Print("CDealSampleReader: HistorySelect failed for the requested range.");
      return(false);
     }
//--- walk every deal available in the freshly selected history cache
   int total_deals = ::HistoryDealsTotal();
   for(int i = 0; i < total_deals; i++)
     {
      ulong ticket = ::HistoryDealGetTicket(i);
      if(ticket == 0)
         continue;
      //--- only closing-related deal entries realize profit or loss
      long entry_type = ::HistoryDealGetInteger(ticket, DEAL_ENTRY);
      if(entry_type != DEAL_ENTRY_OUT && entry_type != DEAL_ENTRY_INOUT)
         continue;
      //--- reduce the deal to its close time and its net profit contribution
      double net_profit  = ::HistoryDealGetDouble(ticket, DEAL_PROFIT)
                           + ::HistoryDealGetDouble(ticket, DEAL_SWAP)
                           + ::HistoryDealGetDouble(ticket, DEAL_COMMISSION);
      datetime close_time = (datetime)::HistoryDealGetInteger(ticket, DEAL_TIME);
      //--- append the reduced sample to the output array
      int new_index = ::ArraySize(deals_out);
      ::ArrayResize(deals_out, new_index + 1);
      deals_out[new_index].m_close_time = close_time;
      deals_out[new_index].m_net_profit = net_profit;
     }
   return(true);
  }
Grouping Deals by Calendar Date
A datetime is just seconds; it does not separate "a date" from "a moment on a date." Two deals closed the same day at 09:00 and 21:30 are two different numbers until both get reduced to the same midnight timestamp. That reduction is normalization, and it's CDailyAggregator's first job.
//+------------------------------------------------------------------+
//|                                              DailyAggregator.mqh |
//+------------------------------------------------------------------+
#ifndef DAILYAGGREGATOR_MQH
#define DAILYAGGREGATOR_MQH

#include "CalendarTypes.mqh"

//+------------------------------------------------------------------+
//| CDailyAggregator                                                 |
//+------------------------------------------------------------------+
class CDailyAggregator
  {
private:
   int               FindDateIndex(const CDailyRecord &days[], int count, datetime normalized_date) const;

public:
                     CDailyAggregator(void);
                    ~CDailyAggregator(void);
   datetime          NormalizeToMidnight(datetime timestamp) const;
   bool              Aggregate(const CDealSample &deals[], int count, CDailyRecord &days_out[]);
  };

//+------------------------------------------------------------------+
//| Constructor                                                      |
//| The aggregator holds no state between calls, so construction     |
//| performs no work beyond default object creation.                 |
//+------------------------------------------------------------------+
CDailyAggregator::CDailyAggregator(void)
  {
  }

//+------------------------------------------------------------------+
//| Destructor                                                       |
//| No resources are owned by this class, so no cleanup is required. |
//+------------------------------------------------------------------+
CDailyAggregator::~CDailyAggregator(void)
  {
  }
NormalizeToMidnight() decomposes the timestamp with TimeToStruct, zeroes the hour, minute, and second, and reassembles it with StructToTime. It's a pure function, same input always gives the same output, no side effects, which is why it's exposed as its own method rather than buried in the grouping loop.
//+------------------------------------------------------------------+
//| NormalizeToMidnight                                              |
//| Removes the hour, minute, and second components from a datetime, |
//| producing a stable date-only key. Two timestamps that fall on the|
//| same calendar date always normalize to an identical result, which|
//| is exactly the property the grouping logic in Aggregate depends  |
//| on. This method is pure: it reads its input and returns a value  |
//| without touching any array or member state, which is what makes  |
//| it straightforward to test in isolation.                         |
//+------------------------------------------------------------------+
datetime CDailyAggregator::NormalizeToMidnight(datetime timestamp) const
  {
//--- decompose the timestamp into its calendar and clock components
   MqlDateTime time_parts;
   ::TimeToStruct(timestamp, time_parts);
//--- discard the time-of-day components to obtain a date-only key
   time_parts.hour = 0;
   time_parts.min  = 0;
   time_parts.sec  = 0;
//--- reassemble a datetime representing exactly midnight on that date
   return(::StructToTime(time_parts));
  }
FindDateIndex() performs a linear search for a normalized date inside a partially built result array. A linear search is adequate here because the number of distinct calendar dates in a typical analysis range is small (at most a few hundred for a multi-year history), and the method only ever reads the array, never writes to it.
//+------------------------------------------------------------------+
//| FindDateIndex                                                    |
//+------------------------------------------------------------------+
int CDailyAggregator::FindDateIndex(const CDailyRecord &days[],const int count,const datetime normalized_date) const
  {
   for(int i = 0; i < count; i++)
     {
      if(days[i].m_date == normalized_date)
         return(i);
     }
   return(-1);
  }
Aggregate() does the grouping: normalize each deal's close time, search for an existing record with that date, and either accumulate or create one. A day whose deals sum to exactly zero still gets a record with the correct trade count. That's not the same as a day with no trades, and the distinction is preserved deliberately.
//+-------------------------------------------------------------------+
//| Aggregate                                                         |
//+-------------------------------------------------------------------+
bool CDailyAggregator::Aggregate(const CDealSample &deals[],const int count,CDailyRecord &days_out[])
  {
//--- start from an empty result set regardless of any prior contents
   ::ArrayResize(days_out, 0);
//--- fold every sampled deal into its matching daily record
   for(int i = 0; i < count; i++)
     {
      datetime normalized_date = NormalizeToMidnight(deals[i].m_close_time);
      int existing_index = FindDateIndex(days_out, ::ArraySize(days_out), normalized_date);
      if(existing_index >= 0)
        {
         //--- accumulate into the calendar date already present in the result
         days_out[existing_index].m_daily_pnl   += deals[i].m_net_profit;
         days_out[existing_index].m_trade_count += 1;
        }
      else
        {
         //--- create a new daily record the first time this date is encountered
         int new_index = ::ArraySize(days_out);
         ::ArrayResize(days_out, new_index + 1);
         days_out[new_index].m_date        = normalized_date;
         days_out[new_index].m_daily_pnl   = deals[i].m_net_profit;
         days_out[new_index].m_trade_count = 1;
        }
     }
   return(true);
  }
Because Aggregate resizes and writes into its output array, it cannot be const. MQL5 treats a reference array parameter as read-only inside a const method regardless of the parameter's own qualifier. NormalizeToMidnight, which only reads, stays const.
Mapping Calendar Dates to Grid Coordinates
Given a normalized date, CCalendarGridMapper returns two coordinates: the week column (left to right) and the weekday row (top to bottom, Sunday as row 0). The weekday row comes straight from MqlDateTime.day_of_week. The week column is anchored to the Sunday on or before the range's start date, so a range that begins mid-week still aligns on true calendar-week boundaries instead of shifting every column.
//+------------------------------------------------------------------+
//|                                          CalendarGridMapper.mqh  |
//+------------------------------------------------------------------+
#ifndef CALENDARGRIDMAPPER_MQH
#define CALENDARGRIDMAPPER_MQH

//+--------------------------------------------------------------------+
//| CCalendarGridMapper                                                |
//+--------------------------------------------------------------------+
class CCalendarGridMapper
  {
private:
   datetime          m_start_date;          // caller-supplied reference start date
   datetime          m_grid_origin_sunday;  // Sunday on or before m_start_date

   int               WeekdayOf(datetime normalized_date) const;

public:
                     CCalendarGridMapper(void);
                    ~CCalendarGridMapper(void);
   void              SetStartDate(datetime normalized_start_date);
   int               GetWeekdayRow(datetime normalized_date) const;
   int               GetWeekColumn(datetime normalized_date) const;
   datetime          GetColumnStartDate(int week_column) const;
  };

//+-------------------------------------------------------------------+
//| Constructor                                                       |
//| Both reference dates start at zero until SetStartDate is called;  |
//| callers must always call SetStartDate before requesting any       |
//| coordinate so that the grid origin is meaningful.                 |
//+-------------------------------------------------------------------+
CCalendarGridMapper::CCalendarGridMapper(void)
  {
   m_start_date         = 0;
   m_grid_origin_sunday = 0;
  }

//+------------------------------------------------------------------+
//| Destructor                                                       |
//| No resources are owned by this class, so no cleanup is required. |
//+------------------------------------------------------------------+
CCalendarGridMapper::~CCalendarGridMapper(void)
  {
  }
WeekdayOf() reads day_of_week off MqlDateTime, which already uses the Sunday-is-zero convention this project needs, so no extra arithmetic is required.
//+------------------------------------------------------------------+
//| WeekdayOf                                                        |
//+------------------------------------------------------------------+
int CCalendarGridMapper::WeekdayOf(datetime normalized_date) const
  {
   MqlDateTime time_parts;
   ::TimeToStruct(normalized_date, time_parts);
   return(time_parts.day_of_week);
  }
SetStartDate() derives m_grid_origin_sunday once: the Sunday on or before the supplied start date. Every later week-column query is just whole weeks elapsed from that origin.
//+--------------------------------------------------------------------+
//| SetStartDate                                                       |
//+--------------------------------------------------------------------+
void CCalendarGridMapper::SetStartDate(datetime normalized_start_date)
  {
   m_start_date = normalized_start_date;
   int start_weekday = WeekdayOf(m_start_date);
   m_grid_origin_sunday = m_start_date - (datetime)(start_weekday * 86400);
  }
GetWeekdayRow() is independent of the grid origin: a given date always has exactly one weekday regardless of where the range starts.
//+------------------------------------------------------------------+
//| GetWeekdayRow                                                    |
//+------------------------------------------------------------------+
int CCalendarGridMapper::GetWeekdayRow(datetime normalized_date) const
  {
   return(WeekdayOf(normalized_date));
  }
GetWeekColumn() measures whole seven-day blocks elapsed from m_grid_origin_sunday. Because the origin is always a Sunday, integer division by seven never needs a special case for a mid-week start. The fix is anchoring the grid to the Sunday on or before the start date, computed once in SetStartDate as m_grid_origin_sunday. Every column after that is just whole weeks elapsed from that origin.
January 1, 2026 is a Thursday, so a grid started there is a good mid-week test case. Its origin is Sunday, December 28, 2025:
| Date | Weekday | Weekday row | Week column |
|---|---|---|---|
| 2026-01-01 | Thursday | 4 | 0 |
| 2026-01-02 | Friday | 5 | 0 |
| 2026-01-03 | Saturday | 6 | 0 |
| 2026-01-04 | Sunday | 0 | 1 |
| 2026-01-10 | Saturday | 6 | 1 |
| 2026-01-11 | Sunday | 0 | 2 |
The January 3 to January 4 boundary is where an off-by-one would show up first. A naive implementation assuming the first date is always Sunday would also silently shift every row in the grid. Both cases are covered in the test suite for exactly that reason.
//+--------------------------------------------------------------------+
//| GetWeekColumn                                                      |
//+--------------------------------------------------------------------+
int CCalendarGridMapper::GetWeekColumn(datetime normalized_date) const
  {
   int elapsed_days = (int)((normalized_date - m_grid_origin_sunday) / 86400);
   return(elapsed_days / 7);
  }
GetColumnStartDate() returns the Sunday that begins a given column, which the renderer uses to decide which month a column's header belongs to.
//+--------------------------------------------------------------------+
//| GetColumnStartDate                                                 |
//+--------------------------------------------------------------------+
datetime CCalendarGridMapper::GetColumnStartDate(int week_column) const
  {
   return(m_grid_origin_sunday + (datetime)(week_column * 7 * 86400));
  }
Diverging Color Scales for Signed P&L
Daily P&L is signed with a meaningful zero: a gain and a loss are two directions from a neutral center, not two ends of one scale. Color has to diverge from that center: red for losses, green for gains, flat neutral gray at exactly zero, with intensity scaled to the largest gain or loss actually present in the data.
That normalization is against the heatmap's own range, not a fixed dollar figure, so a quiet month and a wild month both use their full color range. The two sides normalize independently too, so a month with a few huge losses and many small gains does not wash out those small gains by measuring them against the loss scale.
Zero gets its own branch, checked before either sign runs. Falling through to value >= 0 instead would make zero look neutral only by coincidence, and only when max_gain is not zero. An explicit value == 0.0 check also solves the edge case where every value in the range is zero: both scale maximums are zero too, and both branches guard the division before it happens.
A single-hue scale has no way to represent direction, which is exactly why it's the wrong tool for P&L and the right tool for trade count.
Diverging Color Scale for Signed Daily P&L
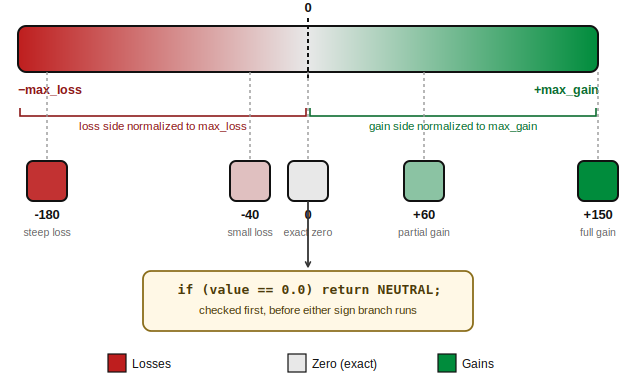
Diverging Color Scale for Signed Daily P&L: Loss and gain normalize independently from a neutral center. Zero is checked in its own branch, before either sign.
Trade Count Visualization
Trade count is non-negative with a natural floor at zero, so a diverging scale makes no sense here. Instead, a single-hue scale runs from a light neutral tint up to a saturated blue as the count approaches the largest observed in the range.
Reusing the same grid for both views, rather than a separate layout, keeps the two directly comparable cell for cell. A quiet-looking P&L day that lights up in the count view suggests activity without a proportionate result, worth a second look rather than an automatic verdict of overtrading.
A date with zero trades gets the dedicated empty color, not the coolest point on the count scale, for the same reason the P&L view separates "no data" from "zero."
Trade Count: Single-Hue Intensity Scale
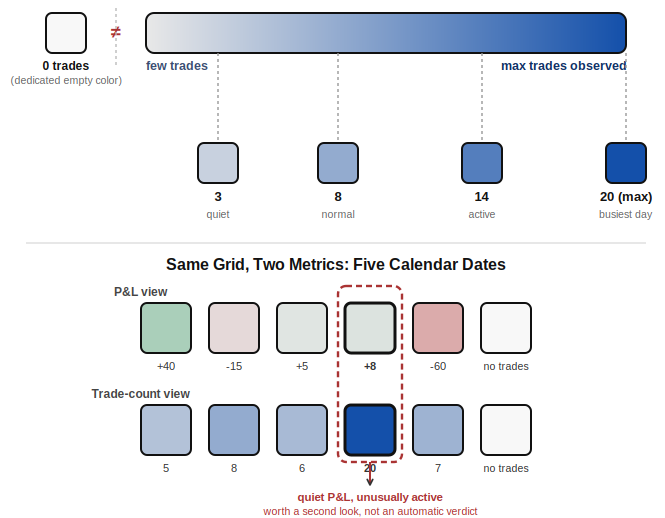
Trade Count: Single-Hue Intensity Scale. A non-negative scale from light tint to saturated blue.
Rendering the Calendar Heatmap with CCanvas
CCalendarHeatmapChart owns a CCanvas instance and exposes one entry point, Draw(), which renders either the P&L view or the trade-count view depending on a flag. Daily P&L is signed with a meaningful zero, so its scale diverges from a neutral center: red toward loss, green toward gain. Trade count is non-negative, so it uses a single-hue scale instead.
//+------------------------------------------------------------------+
//|                                         CalendarHeatmapChart.mqh |
//+------------------------------------------------------------------+
#ifndef CALENDARHEATMAPCHART_MQH
#define CALENDARHEATMAPCHART_MQH

#include <Canvas\Canvas.mqh>
#include "CalendarTypes.mqh"
#include "CalendarGridMapper.mqh"

//--- palette used by the calendar heatmap; kept at file scope so both
//--- the P&L scale and the trade-count scale share one consistent look
const color CALHEAT_COLOR_BACKGROUND   = clrWhite;
const color CALHEAT_COLOR_BORDER       = C'190,190,190';
const color CALHEAT_COLOR_TEXT         = clrBlack;
const color CALHEAT_COLOR_NEUTRAL      = C'232,232,232';
const color CALHEAT_COLOR_EMPTY        = C'248,248,248';
const color CALHEAT_COLOR_POSITIVE_MAX = C'0,140,60';
const color CALHEAT_COLOR_NEGATIVE_MAX = C'190,30,30';
const color CALHEAT_COLOR_COUNT_MAX    = C'20,80,170';
const int   CALHEAT_LABEL_PADDING      = 4;

//+-------------------------------------------------------------------+
//| CCalendarHeatmapChart                                             |
//+-------------------------------------------------------------------+
class CCalendarHeatmapChart
  {
private:
   CCanvas             m_canvas;
   string              m_object_name;
   bool                m_canvas_created;
   int                 m_cell_size;
   int                 m_cell_spacing;
   int                 m_left_margin;
   int                 m_top_margin;
   CCalendarGridMapper m_mapper;

   color             BlendColor(color from_color, color to_color, double t) const;
   color             ComputePnlColor(double value, double max_gain, double max_loss) const;
   color             ComputeTradeCountColor(int trade_count, int max_trade_count) const;
   bool              FindRecord(const CDailyRecord &days[], int count, datetime target_date,
                                double &pnl_out, int &trade_count_out) const;
   void              FindPnlRange(const CDailyRecord &days[], int count, double &max_gain, double &max_loss) const;
   void              FindMaxTradeCount(const CDailyRecord &days[], int count, int &max_trade_count) const;
   bool              FindDateRange(const CDailyRecord &days[], int count, datetime &min_date, datetime &max_date) const;
   void              DrawWeekdayLabels(void);
   void              DrawMonthLabels(datetime range_start, datetime range_end, int total_week_columns);
   void              DrawCell(int week_column, int weekday_row, color cell_color);

public:
                     CCalendarHeatmapChart(const string object_name);
                    ~CCalendarHeatmapChart(void);
   bool              Draw(const CDailyRecord &days[], int count, bool show_trade_count,
                          int x, int y, int width, int height);
   void              Clear(void);
  };

//+-------------------------------------------------------------------+
//| Constructor                                                       |
//+-------------------------------------------------------------------+
CCalendarHeatmapChart::CCalendarHeatmapChart(const string object_name)
  {
   m_object_name    = object_name;
   m_canvas_created = false;
   m_cell_size      = 14;
   m_cell_spacing   = 3;
   m_left_margin    = 40;
   m_top_margin     = 30;
  }

//+-------------------------------------------------------------------+
//| Destructor                                                        |
//+-------------------------------------------------------------------+
CCalendarHeatmapChart::~CCalendarHeatmapChart(void)
  {
  }
Clear() is the only place the canvas is torn down, called explicitly by the caller rather than automatically by the destructor.
//+-------------------------------------------------------------------+
//| Clear                                                             |
//+-------------------------------------------------------------------+
void CCalendarHeatmapChart::Clear(void)
  {
   if(m_canvas_created)
     {
      m_canvas.Destroy();
      m_canvas_created = false;
     }
  }
BlendColor() linearly interpolates two colors channel by channel, using bit masking and shifting to extract red, green, and blue. Both ComputePnlColor() and ComputeTradeCountColor() delegate to it, so both scales stay built from one verified implementation.
//+---------------------------------------------------------------------+
//| BlendColor                                                          |
//+---------------------------------------------------------------------+
color CCalendarHeatmapChart::BlendColor(const color from_color,const color to_color,double t) const
  {
//--- clamp the interpolation factor to a safe zero-to-one range
   if(t < 0.0)
      t = 0.0;
   if(t > 1.0)
      t = 1.0;
//--- extract the channel components of both endpoint colors
   int from_r = (int)(from_color & 0xFF);
   int from_g = (int)((from_color >> 8) & 0xFF);
   int from_b = (int)((from_color >> 16) & 0xFF);
   int to_r   = (int)(to_color & 0xFF);
   int to_g   = (int)((to_color >> 8) & 0xFF);
   int to_b   = (int)((to_color >> 16) & 0xFF);
//--- interpolate each channel independently
   int out_r = (int)::MathRound(from_r + (to_r - from_r) * t);
   int out_g = (int)::MathRound(from_g + (to_g - from_g) * t);
   int out_b = (int)::MathRound(from_b + (to_b - from_b) * t);
//--- reassemble the interpolated color
   return((color)(out_r | (out_g << 8) | (out_b << 16)));
  }
ComputePnlColor() gives zero its own branch, checked before either sign, so it can never fall through to a sign-based calculation by coincidence. Positive and negative values normalize independently against the largest observed gain and loss, both guarded against a zero denominator.
//+---------------------------------------------------------------------+
//| ComputePnlColor                                                     |
//+---------------------------------------------------------------------+
color CCalendarHeatmapChart::ComputePnlColor(const double value,const double max_gain,const double max_loss) const
  {
//--- zero is neither a gain nor a loss and must be handled explicitly
   if(value == 0.0)
      return(CALHEAT_COLOR_NEUTRAL);
//--- positive values move from neutral toward the positive extreme
   if(value > 0.0)
     {
      double intensity = (max_gain > 0.0) ? (value / max_gain) : 0.0;
      return(BlendColor(CALHEAT_COLOR_NEUTRAL, CALHEAT_COLOR_POSITIVE_MAX, intensity));
     }
//--- negative values move from neutral toward the negative extreme
   double loss_intensity = (max_loss > 0.0) ? (::MathAbs(value) / max_loss) : 0.0;
   return(BlendColor(CALHEAT_COLOR_NEUTRAL, CALHEAT_COLOR_NEGATIVE_MAX, loss_intensity));
  }
ComputeTradeCountColor() returns the dedicated empty color for zero trades rather than the coolest point on the scale, keeping "no activity" distinct from "activity at the low end."
//+----------------------------------------------------------------------+
//| ComputeTradeCountColor                                               |
//+----------------------------------------------------------------------+
color CCalendarHeatmapChart::ComputeTradeCountColor(const int trade_count,const int max_trade_count) const
  {
   if(trade_count <= 0)
      return(CALHEAT_COLOR_EMPTY);
   double intensity = (max_trade_count > 0) ? ((double)trade_count / (double)max_trade_count) : 0.0;
   return(BlendColor(CALHEAT_COLOR_NEUTRAL, CALHEAT_COLOR_COUNT_MAX, intensity));
  }
FindRecord() searches days[] for a matching date and reports whether it exists, since a date absent from the array means no deal closed that day, not a P&L of zero.
//+---------------------------------------------------------------------+
//| FindRecord                                                          |
//+---------------------------------------------------------------------+
bool CCalendarHeatmapChart::FindRecord(const CDailyRecord &days[],const int count,const datetime target_date,
                                       double &pnl_out,int &trade_count_out) const
  {
   for(int i = 0; i < count; i++)
     {
      if(days[i].m_date == target_date)
        {
         pnl_out         = days[i].m_daily_pnl;
         trade_count_out = days[i].m_trade_count;
         return(true);
        }
     }
   pnl_out         = 0.0;
   trade_count_out = 0;
   return(false);
  }
FindPnlRange() and FindMaxTradeCount() scan days[] for the color-scale reference values, defaulting to zero for an empty or all-zero dataset, which ComputePnlColor() and ComputeTradeCountColor() handle safely.
//+---------------------------------------------------------------------+
//| FindPnlRange                                                        |
//+---------------------------------------------------------------------+
void CCalendarHeatmapChart::FindPnlRange(const CDailyRecord &days[],const int count,double &max_gain,double &max_loss) const
  {
   max_gain = 0.0;
   max_loss = 0.0;
   for(int i = 0; i < count; i++)
     {
      if(days[i].m_daily_pnl > max_gain)
         max_gain = days[i].m_daily_pnl;
      if(days[i].m_daily_pnl < 0.0 && ::MathAbs(days[i].m_daily_pnl) > max_loss)
         max_loss = ::MathAbs(days[i].m_daily_pnl);
     }
  }

//+---------------------------------------------------------------------+
//| FindMaxTradeCount                                                   |
//+---------------------------------------------------------------------+
void CCalendarHeatmapChart::FindMaxTradeCount(const CDailyRecord &days[],const int count,int &max_trade_count) const
  {
   max_trade_count = 0;
   for(int i = 0; i < count; i++)
     {
      if(days[i].m_trade_count > max_trade_count)
         max_trade_count = days[i].m_trade_count;
     }
  }
FindDateRange() finds the earliest and latest date in days[]. Records are not guaranteed sorted, since Aggregate() appends in the order dates first appear, so this scans rather than assumes.
//+----------------------------------------------------------------------+
//| FindDateRange                                                        |
//+----------------------------------------------------------------------+
bool CCalendarHeatmapChart::FindDateRange(const CDailyRecord &days[],const int count,datetime &min_date,datetime &max_date) const
  {
   if(count <= 0)
     {
      min_date = 0;
      max_date = 0;
      return(false);
     }
   min_date = days[0].m_date;
   max_date = days[0].m_date;
   for(int i = 1; i < count; i++)
     {
      if(days[i].m_date < min_date)
         min_date = days[i].m_date;
      if(days[i].m_date > max_date)
         max_date = days[i].m_date;
     }
   return(true);
  }
DrawWeekdayLabels() draws the seven abbreviations, measuring each with TextGetSize() right after configuring the identical font on the canvas and the global text engine, so the right-alignment is based on a real measured width, not an estimate.
//+----------------------------------------------------------------------+
//| DrawWeekdayLabels                                                    |
//+----------------------------------------------------------------------+
void CCalendarHeatmapChart::DrawWeekdayLabels(void)
  {
   string weekday_names[7] = {"Sun", "Mon", "Tue", "Wed", "Thu", "Fri", "Sat"};
//--- configure identical font settings on the canvas and the measurement engine
   m_canvas.FontSet("Arial", 9, 0);
   ::TextSetFont("Arial", 9, 0);
   for(int row = 0; row < 7; row++)
     {
      uint text_width = 0, text_height = 0;
      ::TextGetSize(weekday_names[row], text_width, text_height);
      //--- right-align the label so it sits flush against the first week column
      int label_x = m_left_margin - (int)text_width - CALHEAT_LABEL_PADDING;
      int label_y = m_top_margin + row * (m_cell_size + m_cell_spacing) + (m_cell_size - (int)text_height) / 2;
      m_canvas.TextOut(label_x, label_y, weekday_names[row], ::ColorToARGB(CALHEAT_COLOR_TEXT, 255));
     }
  }
DrawMonthLabels() walks each week column, asks GetColumnStartDate() for its Sunday, and draws a label only when the month or year changes, so a month spanning several columns gets exactly one header.
//+-----------------------------------------------------------------------+
//| DrawMonthLabels                                                       |
//+-----------------------------------------------------------------------+
void CCalendarHeatmapChart::DrawMonthLabels(const datetime range_start,const datetime range_end,const int total_week_columns)
  {
   string month_names[12] = {"Jan","Feb","Mar","Apr","May","Jun","Jul","Aug","Sep","Oct","Nov","Dec"};
   m_canvas.FontSet("Arial", 9, FW_BOLD);
   ::TextSetFont("Arial", 9, FW_BOLD);
   int last_month = -1;
   int last_year  = -1;
   for(int column = 0; column < total_week_columns; column++)
     {
      datetime column_start = m_mapper.GetColumnStartDate(column);
      MqlDateTime column_time;
      ::TimeToStruct(column_start, column_time);
      if(column_time.mon != last_month || column_time.year != last_year)
        {
         string label = month_names[column_time.mon - 1] + " " + (string)column_time.year;
         uint text_width = 0, text_height = 0;
         ::TextGetSize(label, text_width, text_height);
         int label_x = m_left_margin + column * (m_cell_size + m_cell_spacing);
         int label_y = m_top_margin - (int)text_height - CALHEAT_LABEL_PADDING;
         m_canvas.TextOut(label_x, label_y, label, ::ColorToARGB(CALHEAT_COLOR_TEXT, 255));
         last_month = column_time.mon;
         last_year  = column_time.year;
        }
     }
  }
DrawCell() fills and outlines one cell at its pixel position, with a neutral border regardless of fill color so adjacent cells stay distinct.
//+----------------------------------------------------------------------+
//| DrawCell                                                             |
//+----------------------------------------------------------------------+
void CCalendarHeatmapChart::DrawCell(const int week_column,const int weekday_row,const color cell_color)
  {
   int cell_x = m_left_margin + week_column * (m_cell_size + m_cell_spacing);
   int cell_y = m_top_margin  + weekday_row  * (m_cell_size + m_cell_spacing);
   m_canvas.FillRectangle(cell_x, cell_y, cell_x + m_cell_size, cell_y + m_cell_size, ::ColorToARGB(cell_color, 255));
   m_canvas.Rectangle(cell_x, cell_y, cell_x + m_cell_size, cell_y + m_cell_size, ::ColorToARGB(CALHEAT_COLOR_BORDER, 255));
  }
Draw() creates the canvas lazily via CreateBitmapLabel(). If the dataset is empty, it renders a message instead of a grid. Otherwise, it iterates every calendar date from FindDateRange()'s min to max and renders missing dates using the empty color.
//+-------------------------------------------------------------------------+
//| Draw                                                                    |
//+-------------------------------------------------------------------------+
bool CCalendarHeatmapChart::Draw(const CDailyRecord &days[],const int count,const bool show_trade_count,
                                 const int x,const int y,const int width,const int height)
  {
//--- create the canvas surface for this chart panel on first use
   if(!m_canvas_created)
     {
      if(!m_canvas.CreateBitmapLabel(m_object_name, x, y, width, height, COLOR_FORMAT_ARGB_NORMALIZE))
        {
         ::Print("CCalendarHeatmapChart: failed to create canvas for object '", m_object_name, "'.");
         return(false);
        }
      m_canvas_created = true;
     }
//--- clear the drawing surface before rendering the current frame
   m_canvas.Erase(::ColorToARGB(CALHEAT_COLOR_BACKGROUND, 255));
//--- an empty dataset is rendered as an explanatory message, not a grid
   if(count <= 0)
     {
      m_canvas.FontSet("Arial", 10, 0);
      ::TextSetFont("Arial", 10, 0);
      string message = "No trading data available for the selected period.";
      m_canvas.TextOut(m_left_margin, m_top_margin, message, ::ColorToARGB(CALHEAT_COLOR_TEXT, 255));
      m_canvas.Update(true);
      return(true);
     }
//--- determine the calendar range spanned by the supplied daily records
   datetime range_start, range_end;
   FindDateRange(days, count, range_start, range_end);
   m_mapper.SetStartDate(range_start);
   int total_week_columns = m_mapper.GetWeekColumn(range_end) + 1;
//--- compute the color-scale reference values appropriate to the active metric
   double max_gain = 0.0, max_loss = 0.0;
   int    max_trade_count = 0;
   if(show_trade_count)
      FindMaxTradeCount(days, count, max_trade_count);
   else
      FindPnlRange(days, count, max_gain, max_loss);
//--- draw the static weekday row labels and the month and year labels
   DrawWeekdayLabels();
   DrawMonthLabels(range_start, range_end, total_week_columns);
//--- iterate across every calendar date in the range, not only dates with a record
   int total_days = (int)((range_end - range_start) / 86400) + 1;
   for(int offset = 0; offset < total_days; offset++)
     {
      datetime current_date = range_start + (datetime)(offset * 86400);
      int week_column = m_mapper.GetWeekColumn(current_date);
      int weekday_row = m_mapper.GetWeekdayRow(current_date);
      double pnl_value   = 0.0;
      int    trade_count = 0;
      bool   has_record  = FindRecord(days, count, current_date, pnl_value, trade_count);
      color  cell_color;
      if(!has_record)
         cell_color = CALHEAT_COLOR_EMPTY;
      else
         if(show_trade_count)
            cell_color = ComputeTradeCountColor(trade_count, max_trade_count);
         else
            cell_color = ComputePnlColor(pnl_value, max_gain, max_loss);
      DrawCell(week_column, weekday_row, cell_color);
     }
//--- flush the rendered pixels to the chart object
   m_canvas.Update(true);
   return(true);
  }
Weekday Summary and Best/Worst Days
A heatmap is read at a glance, not for exact figures. CCalendarSummaryPrinter backs the heatmap with exact figures printed to the Experts tab: total P&L and trade count per weekday, plus the single best and worst calendar dates.
//+------------------------------------------------------------------+
//|                                       CalendarSummaryPrinter.mqh |
//+------------------------------------------------------------------+
#ifndef CALENDARSUMMARYPRINTER_MQH
#define CALENDARSUMMARYPRINTER_MQH

#include "CalendarTypes.mqh"

//+---------------------------------------------------------------------+
//| CCalendarSummaryPrinter                                             |
//+---------------------------------------------------------------------+
class CCalendarSummaryPrinter
  {
private:
   string            WeekdayName(int weekday_row) const;

public:
                     CCalendarSummaryPrinter(void);
                    ~CCalendarSummaryPrinter(void);
   void              Print(const CDailyRecord &days[], int count);
  };

//+--------------------------------------------------------------------+
//| Constructor                                                        |
//| The printer holds no state between calls, so construction performs |
//| no work beyond default object creation.                            |
//+--------------------------------------------------------------------+
CCalendarSummaryPrinter::CCalendarSummaryPrinter(void)
  {
  }

//+------------------------------------------------------------------+
//| Destructor                                                       |
//| No resources are owned by this class, so no cleanup is required. |
//+------------------------------------------------------------------+
CCalendarSummaryPrinter::~CCalendarSummaryPrinter(void)
  {
  }
WeekdayName() maps a row index to its full name using the same Sunday-is-zero convention as everywhere else in the project.
//+----------------------------------------------------------------------+
//| WeekdayName                                                          |
//+----------------------------------------------------------------------+
string CCalendarSummaryPrinter::WeekdayName(const int weekday_row) const
  {
   string names[7] = {"Sunday", "Monday", "Tuesday", "Wednesday", "Thursday", "Friday", "Saturday"};
   if(weekday_row < 0 || weekday_row > 6)
      return("Unknown");
   return(names[weekday_row]);
  }
Print() seeds all seven weekday totals at zero before examining a single record, so a weekday with no matching data still prints "no records" instead of being silently missing. A weekday whose total nets to exactly zero prints "breakeven," never folded into gain or loss. Best and worst days come from a plain min/max scan, skipped entirely for an empty array.
//+------------------------------------------------------------------------+
//| Print                                                                  |
//+------------------------------------------------------------------------+
void CCalendarSummaryPrinter::Print(const CDailyRecord &days[],const int count)
  {
//--- seed per-weekday totals at zero regardless of whether any record exists
   double weekday_pnl[7];
   int    weekday_trade_count[7];
   int    weekday_day_count[7];
   for(int row = 0; row < 7; row++)
     {
      weekday_pnl[row]         = 0.0;
      weekday_trade_count[row] = 0;
      weekday_day_count[row]   = 0;
     }
//--- fold every daily record into its corresponding weekday bucket
   for(int i = 0; i < count; i++)
     {
      MqlDateTime time_parts;
      ::TimeToStruct(days[i].m_date, time_parts);
      int row = time_parts.day_of_week;
      weekday_pnl[row]         += days[i].m_daily_pnl;
      weekday_trade_count[row] += days[i].m_trade_count;
      weekday_day_count[row]   += 1;
     }
//--- print the weekday-level breakdown from Sunday through Saturday
   ::Print("Calendar Heatmap Weekday Summary");
   for(int row = 0; row < 7; row++)
     {
      string classification;
      //--- a weekday total of exactly zero is reported explicitly, never as a gain or a loss
      if(weekday_day_count[row] == 0)
         classification = "no records";
      else
         if(weekday_pnl[row] > 0.0)
            classification = "net gain";
         else
            if(weekday_pnl[row] < 0.0)
               classification = "net loss";
            else
               classification = "breakeven";
      ::PrintFormat("%-10s calendar dates: %3d  trades: %4d  daily P&L total: %12.2f  (%s)",
                    WeekdayName(row), weekday_day_count[row], weekday_trade_count[row],
                    weekday_pnl[row], classification);
     }
//--- identify the single best and single worst calendar dates by daily P&L
   if(count <= 0)
     {
      ::Print("No daily records are available in the selected range to determine best and worst days.");
      return;
     }
   int best_index  = 0;
   int worst_index = 0;
   for(int i = 1; i < count; i++)
     {
      if(days[i].m_daily_pnl > days[best_index].m_daily_pnl)
         best_index = i;
      if(days[i].m_daily_pnl < days[worst_index].m_daily_pnl)
         worst_index = i;
     }
   ::PrintFormat("Best calendar date by daily P&L:  %s   P&L: %.2f   trades: %d",
                 ::TimeToString(days[best_index].m_date, TIME_DATE), days[best_index].m_daily_pnl, days[best_index].m_trade_count);
   ::PrintFormat("Worst calendar date by daily P&L: %s   P&L: %.2f   trades: %d",
                 ::TimeToString(days[worst_index].m_date, TIME_DATE), days[worst_index].m_daily_pnl, days[worst_index].m_trade_count);
  }
Building the Calendar Heatmap Dashboard
CalendarHeatmapDashboard.mq5 wires all five preceding components together. OnStart runs a short pipeline: determine the range, read history, aggregate, print the summary, render both heatmaps, refresh the chart. Every actual decision lives in the components above; the script just sequences them.
The two CCalendarHeatmapChart instances are ordinary locals. Because their destructor does nothing, both panels stay on the chart after OnStart returns and the objects go out of scope, which is the whole point of the empty-destructor design.
//+------------------------------------------------------------------+
//|                                     CalendarHeatmapDashboard.mq5 |
//+------------------------------------------------------------------+
#property description "Renders a monthly P&L calendar heatmap and a trade-count "
#property description "calendar heatmap from closed deal history, and prints a "
#property description "weekday-level analytical summary to the Experts tab."
#property script_show_inputs

#include <CalendarHeatmapDashboard/CalendarTypes.mqh>
#include <CalendarHeatmapDashboard/DealSampleReader.mqh>
#include <CalendarHeatmapDashboard/DailyAggregator.mqh>
#include <CalendarHeatmapDashboard/CalendarHeatmapChart.mqh>
#include <CalendarHeatmapDashboard/CalendarSummaryPrinter.mqh>

input int InpLookbackDays = 365; // number of calendar days to include, counting back from now

//+---------------------------------------------------------------------+
//| Script program start function                                       |
//+---------------------------------------------------------------------+
void OnStart(void)
  {
//--- determine the analysis window, ending at the current server time
   datetime range_to   = ::TimeCurrent();
   datetime range_from = range_to - (datetime)(InpLookbackDays * 86400);

//--- read the raw closed deal history and reduce it to close time and net profit
   CDealSampleReader deal_reader;
   CDealSample       deal_samples[];
   if(!deal_reader.Read(range_from, range_to, deal_samples))
     {
      ::Print("CalendarHeatmapDashboard: failed to read deal history for the requested range.");
      return;
     }

//--- aggregate the deal samples into one daily record per distinct calendar date
   CDailyAggregator daily_aggregator;
   CDailyRecord     daily_records[];
   daily_aggregator.Aggregate(deal_samples, ArraySize(deal_samples), daily_records);

//--- print the weekday-level analytical summary and the best/worst days to the log
   CCalendarSummaryPrinter summary_printer;
   summary_printer.Print(daily_records, ArraySize(daily_records));

//--- render the P&L calendar heatmap using the diverging red-neutral-green scale
   CCalendarHeatmapChart pnl_chart("CalendarHeatmap_PnL");
   pnl_chart.Draw(daily_records, ArraySize(daily_records), false, 20, 20, 900, 220);

//--- render the trade-count calendar heatmap using the single-hue intensity scale
   CCalendarHeatmapChart count_chart("CalendarHeatmap_TradeCount");
   count_chart.Draw(daily_records, ArraySize(daily_records), true, 20, 260, 900, 220);

//--- refresh the chart so both panels are visible immediately
   ::ChartRedraw(0);

   ::PrintFormat("CalendarHeatmapDashboard: rendered %d daily records covering %s to %s.",
                 ArraySize(daily_records), ::TimeToString(range_from, TIME_DATE), ::TimeToString(range_to, TIME_DATE));
  }
//+------------------------------------------------------------------+
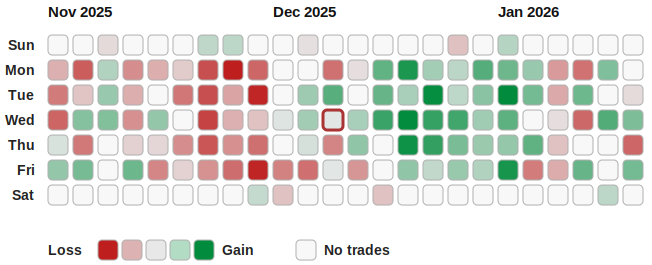
Panel 1: Daily P&L Heatmap Mock-Up. Illustrative mock-up of the dashboard's first panel. Cells shade red to green by daily P&L. Light gray marks dates with no trades.
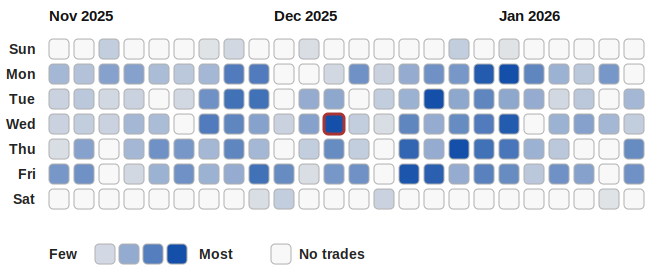
Panel 2: Trade-Count Heatmap Mock-Up. Illustrative mock-up of the dashboard's second panel. Same calendar dates as Panel 1, shaded blue by trade count instead.
Verification and Testing
Rendering code needs a live chart and cannot be unit tested headlessly. Date normalization, aggregation, and coordinate mapping have no such excuse, since they're pure functions on plain data. TestCalendarAnalytics.mq5 exercises them directly with synthetic input, using an ASSERT macro that logs a pass or a failure with the source line number.
//+------------------------------------------------------------------+
//|                                       TestCalendarAnalytics.mq5  |
//+------------------------------------------------------------------+
#property description "Verifies date normalization, aggregation, and calendar "
#property description "grid mapping using synthetic data, independent of any "
#property description "live account history or chart rendering."
#property script_show_inputs

#include <CalendarHeatmapDashboard/CalendarTypes.mqh>
#include <CalendarHeatmapDashboard/DailyAggregator.mqh>
#include <CalendarHeatmapDashboard/CalendarGridMapper.mqh>

//--- assertion counters, updated by the ASSERT macro used throughout this script
int g_assertion_passes   = 0;
int g_assertion_failures = 0;

//+--------------------------------------------------------------------+
//| ASSERT                                                             |
//+--------------------------------------------------------------------+
#define ASSERT(condition, message)                                          \
   if(!(condition))                                                         \
     {                                                                      \
      ::PrintFormat("ASSERTION FAILED: %s (line %d)", (message), __LINE__); \
      g_assertion_failures++;                                               \
     }                                                                      \
   else                                                                     \
     {                                                                      \
      g_assertion_passes++;                                                 \
     }

//+----------------------------------------------------------------------+
//| MakeDateTime                                                         |
//+----------------------------------------------------------------------+
datetime MakeDateTime(int year,int month,int day,int hour=0,int minute=0,int second=0)
  {
   MqlDateTime time_parts;
   time_parts.year = year;
   time_parts.mon  = month;
   time_parts.day  = day;
   time_parts.hour = hour;
   time_parts.min  = minute;
   time_parts.sec  = second;
   time_parts.day_of_week = 0;
   time_parts.day_of_year = 0;
   return(::StructToTime(time_parts));
  }
TestDateNormalization() checks that NormalizeToMidnight() strips the time-of-day and that two same-day timestamps normalize identically.
//+-----------------------------------------------------------------------+
//| TestDateNormalization                                                 |
//+-----------------------------------------------------------------------+
void TestDateNormalization(void)
  {
   CDailyAggregator aggregator;
   datetime with_time = MakeDateTime(2026, 3, 14, 17, 45, 30);
   datetime expected  = MakeDateTime(2026, 3, 14, 0, 0, 0);
   datetime actual    = aggregator.NormalizeToMidnight(with_time);
   ASSERT(actual == expected, "NormalizeToMidnight must strip hour, minute, and second components.");

   datetime deal_a = MakeDateTime(2026, 3, 14, 9, 0, 0);
   datetime deal_b = MakeDateTime(2026, 3, 14, 21, 30, 0);
   ASSERT(aggregator.NormalizeToMidnight(deal_a) == aggregator.NormalizeToMidnight(deal_b),
          "Two deals on the same calendar date must normalize to an identical midnight timestamp.");
  }
TestSameDateAggregation() checks that Aggregate() folds two same-date deals into one record with the correct sum and count.
//+-----------------------------------------------------------------------+
//| TestSameDateAggregation                                               |
//+-----------------------------------------------------------------------+
void TestSameDateAggregation(void)
  {
   CDealSample deals[];
   ArrayResize(deals, 2);
   deals[0].m_close_time = MakeDateTime(2026, 4, 6, 10, 0, 0);
   deals[0].m_net_profit = 25.50;
   deals[1].m_close_time = MakeDateTime(2026, 4, 6, 15, 30, 0);
   deals[1].m_net_profit = -10.00;

   CDailyAggregator aggregator;
   CDailyRecord     days[];
   aggregator.Aggregate(deals, ArraySize(deals), days);

   ASSERT(ArraySize(days) == 1, "Two deals on the same calendar date must aggregate into a single daily record.");
   ASSERT(MathAbs(days[0].m_daily_pnl - 15.50) < 0.0001, "Daily P&L must equal the sum of same-date net profits.");
   ASSERT(days[0].m_trade_count == 2, "Trade count must equal the number of deals aggregated on that date.");
  }
TestMultiDateAggregation() checks that Aggregate() isolates distinct dates correctly, including one date whose deals sum to exactly zero.
//+------------------------------------------------------------------------+
//| TestMultiDateAggregation                                               |
//+------------------------------------------------------------------------+
void TestMultiDateAggregation(void)
  {
   CDealSample deals[];
   ArrayResize(deals, 5);
   deals[0].m_close_time = MakeDateTime(2026, 5, 4, 9, 0, 0);
   deals[0].m_net_profit = 12.00;
   deals[1].m_close_time = MakeDateTime(2026, 5, 4, 14, 0, 0);
   deals[1].m_net_profit = 8.00;
   deals[2].m_close_time = MakeDateTime(2026, 5, 5, 10, 0, 0);
   deals[2].m_net_profit = -30.00;
   deals[3].m_close_time = MakeDateTime(2026, 5, 6, 11, 0, 0);
   deals[3].m_net_profit = 0.00;
   deals[4].m_close_time = MakeDateTime(2026, 5, 6, 16, 0, 0);
   deals[4].m_net_profit = 0.00;

   CDailyAggregator aggregator;
   CDailyRecord     days[];
   aggregator.Aggregate(deals, ArraySize(deals), days);

   ASSERT(ArraySize(days) == 3, "Three distinct calendar dates must produce three daily records.");

   datetime day1 = aggregator.NormalizeToMidnight(MakeDateTime(2026, 5, 4, 0, 0, 0));
   datetime day2 = aggregator.NormalizeToMidnight(MakeDateTime(2026, 5, 5, 0, 0, 0));
   datetime day3 = aggregator.NormalizeToMidnight(MakeDateTime(2026, 5, 6, 0, 0, 0));

   for(int i = 0; i < ArraySize(days); i++)
     {
      if(days[i].m_date == day1)
        {
         ASSERT(MathAbs(days[i].m_daily_pnl - 20.00) < 0.0001, "May 4 daily P&L must equal the sum of its two deals.");
         ASSERT(days[i].m_trade_count == 2, "May 4 trade count must equal two.");
        }
      else
         if(days[i].m_date == day2)
           {
            ASSERT(MathAbs(days[i].m_daily_pnl - (-30.00)) < 0.0001, "May 5 daily P&L must equal its single negative deal.");
            ASSERT(days[i].m_trade_count == 1, "May 5 trade count must equal one.");
           }
         else
            if(days[i].m_date == day3)
              {
               ASSERT(days[i].m_daily_pnl == 0.0, "May 6 daily P&L must equal exactly zero.");
               ASSERT(days[i].m_trade_count == 2, "May 6 trade count must equal two even though the net P&L is zero.");
              }
     }
  }
TestExactZeroPnl() checks that offsetting deals still produce a record with the correct trade count, not one indistinguishable from an inactive day.
//+------------------------------------------------------------------------+
//| TestExactZeroPnl                                                       |
//+------------------------------------------------------------------------+
void TestExactZeroPnl(void)
  {
   CDealSample deals[];
   ArrayResize(deals, 2);
   deals[0].m_close_time = MakeDateTime(2026, 6, 1, 9, 0, 0);
   deals[0].m_net_profit = 40.00;
   deals[1].m_close_time = MakeDateTime(2026, 6, 1, 13, 0, 0);
   deals[1].m_net_profit = -40.00;

   CDailyAggregator aggregator;
   CDailyRecord     days[];
   aggregator.Aggregate(deals, ArraySize(deals), days);

   ASSERT(ArraySize(days) == 1, "Offsetting deals on the same date must still produce exactly one daily record.");
   ASSERT(days[0].m_daily_pnl == 0.0, "Offsetting deals must aggregate to an exact zero daily P&L.");
   ASSERT(days[0].m_trade_count == 2, "Trade count must still reflect both deals even though the net P&L is zero.");
  }
TestWeekdayMapping() checks that GetWeekdayRow() resolves all seven days correctly, using a mid-week start so both ends of the week get exercised.
//+------------------------------------------------------------------------+
//| TestWeekdayMapping                                                     |
//+------------------------------------------------------------------------+
void TestWeekdayMapping(void)
  {
   CCalendarGridMapper mapper;
   mapper.SetStartDate(MakeDateTime(2026, 1, 1, 0, 0, 0)); // Thursday, January 1, 2026

   ASSERT(mapper.GetWeekdayRow(MakeDateTime(2026, 1, 4, 0, 0, 0)) == 0, "January 4, 2026 is a Sunday and must map to weekday row 0.");
   ASSERT(mapper.GetWeekdayRow(MakeDateTime(2026, 1, 5, 0, 0, 0)) == 1, "January 5, 2026 is a Monday and must map to weekday row 1.");
   ASSERT(mapper.GetWeekdayRow(MakeDateTime(2026, 1, 6, 0, 0, 0)) == 2, "January 6, 2026 is a Tuesday and must map to weekday row 2.");
   ASSERT(mapper.GetWeekdayRow(MakeDateTime(2026, 1, 7, 0, 0, 0)) == 3, "January 7, 2026 is a Wednesday and must map to weekday row 3.");
   ASSERT(mapper.GetWeekdayRow(MakeDateTime(2026, 1, 1, 0, 0, 0)) == 4, "January 1, 2026 is a Thursday and must map to weekday row 4.");
   ASSERT(mapper.GetWeekdayRow(MakeDateTime(2026, 1, 2, 0, 0, 0)) == 5, "January 2, 2026 is a Friday and must map to weekday row 5.");
   ASSERT(mapper.GetWeekdayRow(MakeDateTime(2026, 1, 3, 0, 0, 0)) == 6, "January 3, 2026 is a Saturday and must map to weekday row 6.");
  }
TestStartAndEndOfWeekMapping() checks the January 3 to January 4 boundary and the following week, exactly where an off-by-one in GetWeekColumn() would surface.
//+------------------------------------------------------------------------+
//| TestStartAndEndOfWeekMapping                                           |
//+------------------------------------------------------------------------+
void TestStartAndEndOfWeekMapping(void)
  {
   CCalendarGridMapper mapper;
   mapper.SetStartDate(MakeDateTime(2026, 1, 1, 0, 0, 0)); // Thursday, mid-week start

   ASSERT(mapper.GetWeekColumn(MakeDateTime(2026, 1, 1, 0, 0, 0)) == 0, "The start date itself must fall in week column 0.");
   ASSERT(mapper.GetWeekColumn(MakeDateTime(2026, 1, 3, 0, 0, 0)) == 0, "Saturday January 3 must remain in week column 0, the end of the first partial week.");
   ASSERT(mapper.GetWeekColumn(MakeDateTime(2026, 1, 4, 0, 0, 0)) == 1, "Sunday January 4 must begin week column 1, the classic week-boundary off-by-one case.");
   ASSERT(mapper.GetWeekColumn(MakeDateTime(2026, 1, 10, 0, 0, 0)) == 1, "Saturday January 10 must still be the last date of week column 1.");
   ASSERT(mapper.GetWeekColumn(MakeDateTime(2026, 1, 11, 0, 0, 0)) == 2, "Sunday January 11 must begin week column 2.");
  }
TestMidWeekStartOrigin() checks that GetColumnStartDate(0) derives the correct Sunday origin from a mid-week start date.
//+-----------------------------------------------------------------------+
//| TestMidWeekStartOrigin                                                |
//+-----------------------------------------------------------------------+
void TestMidWeekStartOrigin(void)
  {
   CCalendarGridMapper mapper;
   mapper.SetStartDate(MakeDateTime(2026, 1, 1, 0, 0, 0)); // Thursday
   datetime expected_origin = MakeDateTime(2025, 12, 28, 0, 0, 0); // Sunday on or before Jan 1, 2026
   ASSERT(mapper.GetColumnStartDate(0) == expected_origin,
          "Week column 0 must originate on the Sunday on or before a mid-week start date.");
  }

//+-----------------------------------------------------------------------+
//| Script program start function                                         |
//| Runs every test function in sequence and prints a final pass/fail     |
//| summary. This script deliberately performs no chart rendering and     |
//| requires no live account history: every input is synthetic, which is  |
//| what makes the analytical logic testable independent of the visual    |
//| rendering pipeline.                                                   |
//+-----------------------------------------------------------------------+
void OnStart(void)
  {
   g_assertion_passes   = 0;
   g_assertion_failures = 0;

   ::Print("Running TestCalendarAnalytics...");

   TestDateNormalization();
   TestSameDateAggregation();
   TestMultiDateAggregation();
   TestExactZeroPnl();
   TestWeekdayMapping();
   TestStartAndEndOfWeekMapping();
   TestMidWeekStartOrigin();

   ::PrintFormat("TestCalendarAnalytics complete: %d passed, %d failed.", g_assertion_passes, g_assertion_failures);
   if(g_assertion_failures == 0)
      ::Print("TEST SUITE PASSED");
   else
      ::Print("TEST SUITE FAILED");
  }
Extending the Dashboard
Symbol-specific filtering: Check DEAL_SYMBOL alongside DEAL_ENTRY in CDealSampleReader::Read; nothing downstream needs to change.
Magic-number filtering: Same approach, filtering by DEAL_MAGIC, entirely contained in the reader.
Monthly or quarterly aggregation: A parallel CMonthlyAggregator normalizing to the first of the month would reuse the same grouping pattern; the grid mapper would need a companion that maps a month to one column instead of a day to a row and column.
Average trade P&L: CDailyRecord already has the sum and count needed; a third color-mapping method dividing one by the other, with the same zero-count guard, would add this view.
Exporting to CSV: CDailyRecord is already a clean row shape. A small FileOpen/FileWrite routine iterating daily_records after Aggregate() needs no other changes.
Limitations and Design Tradeoffs
A multi-year range still renders in one grid with no column cap, so it simply produces a wide canvas; the monthly-aggregation extension is the better fit for long ranges.
Zero trades and exactly-zero P&L are deliberately distinguished by color and label, but that distinction relies on an exact value == 0.0 comparison. Broker-reported doubles summed from profit, swap, and commission could in principle land near, but not exactly at, zero, treating a near-breakeven day as a tiny gain or loss. An epsilon tolerance would be a reasonable addition for production use.
The color scale normalizes against whatever's displayed, not a fixed figure, so the same dollar value can render at different intensities depending on what else is in range. Two heatmaps from different ranges are not comparable by color alone; the underlying numbers are.
Every date is server-time, from DEAL_TIME as reported by the terminal, not the trader's local date. DEAL_ENTRY_OUT and DEAL_ENTRY_INOUT are treated as the complete set of realized closes, a standard but still interpretive choice. History availability depends entirely on what HistorySelect can retrieve; a sparse-looking heatmap is worth checking against the account's actual retained history before reading it as a quiet period.
And to repeat the introduction: a pattern in the heatmap is a question, not a finding. Nothing here performs a significance test.
Conclusion
This project turns closed deal history into a picture: a calendar grid where color carries daily P&L or trade count at a glance. CDealSampleReader reduces raw history to the two numbers that matter. CDailyAggregator groups them by date, keeping break-even distinct from inactive. CCalendarGridMapper isolates the coordinate math most prone to off-by-one errors into its own testable component. CCalendarHeatmapChart reuses one layout for two color theories and manages the CCanvas lifecycle so the dashboard survives the script that drew it. CCalendarSummaryPrinter backs the picture with exact numbers.
The heatmap answers "where should I look?" The count view answers "was it quiet or busy?" Neither answers "why," and this project does not pretend otherwise.
Programs used in the article:
| # | Name | Type | Description |
|---|---|---|---|
| 1 | CalendarTypes.mqh | Include File | Defines CDealSample and CDailyRecord, the raw and aggregated data structures used throughout the project. |
| 2 | DealSampleReader.mqh | Include File | Defines CDealSampleReader, which reads closed deal history and reduces it to close time and net profit. |
| 3 | DailyAggregator.mqh | Include File | Defines CDailyAggregator, which normalizes dates and groups deal samples into daily records. |
| 4 | CalendarGridMapper.mqh | Include File | Defines CCalendarGridMapper, which converts a normalized date into week-column and weekday-row grid coordinates. |
| 5 | CalendarHeatmapChart.mqh | Include File | Defines CCalendarHeatmapChart, which renders the P&L and trade-count calendar heatmaps using CCanvas. |
| 6 | CalendarSummaryPrinter.mqh | Include File | Defines CCalendarSummaryPrinter, which prints the weekday breakdown and best/worst days to the Experts tab. |
| 7 | CalendarHeatmapDashboard.mq5 | Script | The main application script that wires all components together and renders the dashboard. |
| 8 | TestCalendarAnalytics.mq5 | Script | A verification script that checks date normalization, aggregation, and grid mapping using synthetic data. |
| 9 | CalendarHeatmapDashboard.zip | Zip Archive | Zip archive containing all the attached files and their paths relative to the terminal's root folder. |
Warning: All rights to these materials are reserved by MetaQuotes Ltd. Copying or reprinting of these materials in whole or in part is prohibited.
This article was written by a user of the site and reflects their personal views. MetaQuotes Ltd is not responsible for the accuracy of the information presented, nor for any consequences resulting from the use of the solutions, strategies or recommendations described.

 Inside MetaEditor's AI Assistant: Writing, Repairing and Testing MQL5 with an Agent
 Swarm Optimizer with Hierarchical Sub-Flocks — Flock by Leader
 Time Series Shapelets: Learning a Price Shape, and Testing Whether It Means Anything
 Developing Smart Chart Objects in MQL5 (Part 2): Automating Trendline Discovery and Lifecycle Management

- Free trading apps
- Over 8,000 signals for copying
- Economic news for exploring financial markets
You agree to website policy and terms of use