

Drawdown Duration Analysis Indicator in MQL5
 265
265
 0
0

Introduction
Most drawdown reports reduce risk to one figure: maximum drawdown. Depth alone hides what wears on a trader most: how long the account stays underwater. Two strategies with an identical 15% maximum drawdown can have completely different recovery profiles: one snaps back in a week, the other grinds sideways for a month and a half. Standard reporting cannot tell them apart because it was never built to measure time.
This article builds a script that reconstructs the equity curve from closed deals. It then identifies each drawdown episode (start, through, recovery) and computes its duration in calendar days. The output includes a CCanvas timeline chart with shaded drawdowns and labels for depth and duration. It also prints a terminal table sorted by duration, so long shallow drawdowns appear first.
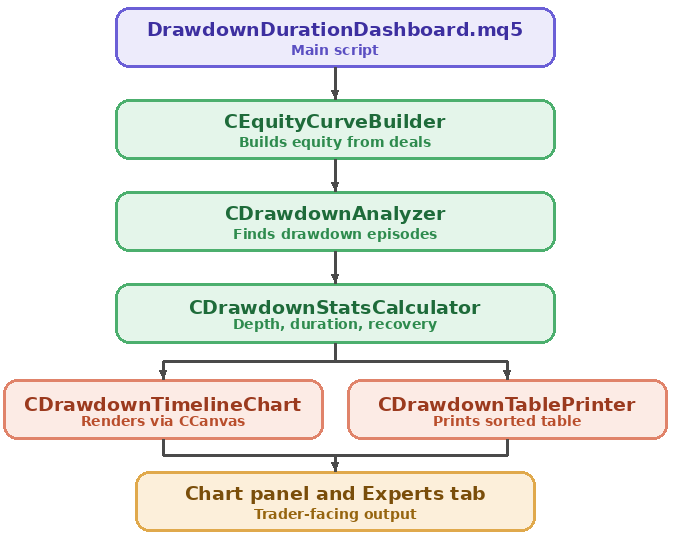
Architectural diagram: the main script builds the equity curve, finds every drawdown episode, computes summary stats, then renders both a timeline chart and a sorted table.
Section 1: DrawdownTypes.mqh — Equity Points and Drawdown Episodes
The equity curve itself is just a sequence of points in time, each holding the account's running equity at that moment. CEquityPoint is deliberately minimal: a timestamp and a value, nothing else, because everything downstream (drawdown detection, charting) only needs those two fields.
A drawdown episode is a richer record. It needs to remember three moments: start_time, the last point where equity was at its prior peak before it began falling; trough_time, the lowest point reached during the episode; and recovery_time, the point where equity climbed back to or above that peak. peak_equity and trough_equity store the two equity values needed to compute depth. is_open is what separates a finished episode from one still in progress: if the account is still underwater at the end of the queried date range, the episode has no true recovery yet, and is_open flags that so nothing downstream mistakes elapsed duration for a final duration.
//+------------------------------------------------------------------+
//|                                                DrawdownTypes.mqh |
//+------------------------------------------------------------------+
#ifndef DRAWDOWNTYPES_MQH
#define DRAWDOWNTYPES_MQH

//+------------------------------------------------------------------+
//| CEquityPoint                                                     |
//| One point on the reconstructed equity curve: a timestamp and the |
//| account's running equity value at that moment.                   |
//+------------------------------------------------------------------+
struct CEquityPoint
  {
   datetime          time;
   double            equity;
  };

//+------------------------------------------------------------------+
//| CDrawdownEpisode                                                 |
//| One underwater period: the peak that preceded it, the trough it  |
//| reached, and either its recovery time or a flag marking it as    |
//| still open at the end of the queried range.                      |
//+------------------------------------------------------------------+
struct CDrawdownEpisode
  {
   datetime          start_time;
   datetime          trough_time;
   datetime          recovery_time;
   double            peak_equity;
   double            trough_equity;
   double            depth_percent;
   double            duration_days;
   bool              is_open;
  };

#endif // DRAWDOWNTYPES_MQH
//+------------------------------------------------------------------+
Section 2: CEquityCurveBuilder — Reconstructing Equity From Deal History
Deal history gives a trader a list of closed trades, not an equity curve. Building the curve means walking every closing deal in chronological order and accumulating its effect on the account balance, starting from whatever the balance was at the beginning of the queried window.
//+------------------------------------------------------------------+ //| EquityCurveBuilder.mqh | //+------------------------------------------------------------------+ #ifndef EQUITYCURVEBUILDER_MQH #define EQUITYCURVEBUILDER_MQH #include "DrawdownTypes.mqh" //+------------------------------------------------------------------+ //| CEquityCurveBuilder | //| Reconstructs the equity curve from closed deal history over a | //| date range, starting from a known opening balance. | //+------------------------------------------------------------------+ class CEquityCurveBuilder { private: void SortByTime(datetime ×[], double &deltas[], int count) const; public: CEquityCurveBuilder(void); ~CEquityCurveBuilder(void); int Read(datetime from, datetime to, double starting_balance, CEquityPoint &curve[]); }; //+------------------------------------------------------------------+ //| Constructor: no member state to initialize. | //+------------------------------------------------------------------+ CEquityCurveBuilder::CEquityCurveBuilder(void) { } //+------------------------------------------------------------------+ //| Destructor: no dynamic resources to release. | //+------------------------------------------------------------------+ CEquityCurveBuilder::~CEquityCurveBuilder(void) { }
Read() reads every deal in the range, keeping the same DEAL_ENTRY_OUT and DEAL_ENTRY_INOUT filter used to isolate real closed trades, but this time it sums DEAL_PROFIT, DEAL_SWAP, and DEAL_COMMISSION together for each deal, since an equity curve needs the deal's full effect on the account, not just its raw profit. Deals are not guaranteed to arrive from HistoryDealGetTicket() in strict chronological order, so Read() collects them into two parallel arrays first and sorts by time before folding them into a running balance.
//+------------------------------------------------------------------+
//| Read                                                             |
//+------------------------------------------------------------------+
int CEquityCurveBuilder::Read(datetime from, datetime to, double starting_balance,
                              CEquityPoint &curve[])
  {
//--- scope the terminal's history cache to the requested range
   if(!::HistorySelect(from, to))
     {
      ::Print("DrawdownDashboard: HistorySelect failed, error ", ::GetLastError());
      return(0);
     }
//--- collect the deal time and total equity delta of every closing deal
   int      total       = ::HistoryDealsTotal();
   datetime deal_times[];
   double   deal_deltas[];
   ::ArrayResize(deal_times, total);
   ::ArrayResize(deal_deltas, total);
   int      found       = 0;
   ulong    ticket      = 0;
   long     entry_type  = 0;
   double   profit      = 0.0;
   double   swap        = 0.0;
   double   commission  = 0.0;
   datetime close_time  = 0;
   for(int i = 0; i < total; i++)
     {
      ticket = ::HistoryDealGetTicket(i);
      if(ticket == 0)
         continue;
      entry_type = ::HistoryDealGetInteger(ticket, DEAL_ENTRY);
      if(entry_type != DEAL_ENTRY_OUT && entry_type != DEAL_ENTRY_INOUT)
         continue;
      profit     = ::HistoryDealGetDouble(ticket, DEAL_PROFIT);
      swap       = ::HistoryDealGetDouble(ticket, DEAL_SWAP);
      commission = ::HistoryDealGetDouble(ticket, DEAL_COMMISSION);
      close_time = (datetime)::HistoryDealGetInteger(ticket, DEAL_TIME);
      deal_times[found]  = close_time;
      deal_deltas[found] = profit + swap + commission;
      found++;
     }
   ::ArrayResize(deal_times, found);
   ::ArrayResize(deal_deltas, found);
//--- sort the collected deltas into chronological order before folding them
   SortByTime(deal_times, deal_deltas, found);
//--- fold the sorted deltas into a running equity curve
   ::ArrayResize(curve, found + 1);
   curve[0].time   = from;
   curve[0].equity = starting_balance;
   double running  = starting_balance;
   for(int i = 0; i < found; i++)
     {
      running += deal_deltas[i];
      curve[i + 1].time   = deal_times[i];
      curve[i + 1].equity = running;
     }
   return(found + 1);
  }
SortByTime() sorts the two parallel arrays into ascending order by time. A simple bubble sort is enough here, since this dashboard typically handles a modest number of deals.
//+--------------------------------------------------------------------+ //| SortByTime | //+--------------------------------------------------------------------+ void CEquityCurveBuilder::SortByTime(datetime ×[], double &deltas[], int count) const { datetime temp_time = 0; double temp_delta = 0.0; for(int i = 0; i < count - 1; i++) { for(int j = 0; j < count - 1 - i; j++) { if(times[j] > times[j + 1]) { temp_time = times[j]; times[j] = times[j + 1]; times[j + 1] = temp_time; temp_delta = deltas[j]; deltas[j] = deltas[j + 1]; deltas[j + 1] = temp_delta; } } } }
Section 3: CDrawdownAnalyzer — Detecting Episodes on the Curve
Detecting a drawdown episode comes down to tracking one number as the curve is traversed point by point: the highest equity seen so far, the running peak. As long as equity stays at or above that peak, nothing is happening. The moment equity drops below it, an episode begins, and it continues until equity climbs back to or above the peak that started it.
//+------------------------------------------------------------------+
//|                                             DrawdownAnalyzer.mqh |
//+------------------------------------------------------------------+
#ifndef DRAWDOWNANALYZER_MQH
#define DRAWDOWNANALYZER_MQH

#include "DrawdownTypes.mqh"

//+------------------------------------------------------------------+
//| CDrawdownAnalyzer                                                |
//| Walks an equity curve and identifies every drawdown episode: its |
//| start, trough, and recovery (or open status if unresolved).      |
//+------------------------------------------------------------------+
class CDrawdownAnalyzer
  {
public:
                     CDrawdownAnalyzer(void);
                    ~CDrawdownAnalyzer(void);

   int                   Analyze(const CEquityPoint &curve[], int count,
                                 CDrawdownEpisode &episodes[]);
  };

//+------------------------------------------------------------------+
//| Constructor: no member state to initialize.                      |
//+------------------------------------------------------------------+
CDrawdownAnalyzer::CDrawdownAnalyzer(void)
  {
  }

//+------------------------------------------------------------------+
//| Destructor: no dynamic resources to release.                     |
//+------------------------------------------------------------------+
CDrawdownAnalyzer::~CDrawdownAnalyzer(void)
  {
  }
Analyze() iterates over the curve exactly once. When a point is at or above the running peak, any open episode gets closed off with that point as its recovery, and the peak updates. When a point is below the running peak, either a new episode starts (recording the last peak as the drawdown's reference point) or, if an episode is already open, the trough gets updated whenever a new lower point appears. If the loop ends while an episode is still open, that episode is recorded as is_open, with its duration measured through the last available point rather than a true recovery.
//+------------------------------------------------------------------+
//| Analyze                                                          |
//+------------------------------------------------------------------+
int CDrawdownAnalyzer::Analyze(const CEquityPoint &curve[], int count,
                               CDrawdownEpisode &episodes[])
  {
   ::ArrayResize(episodes, count);
   int episode_count = 0;
   if(count < 2)
     {
      ::ArrayResize(episodes, 0);
      return(0);
     }
//--- track the running peak and whether a drawdown is currently open
   double           running_peak = curve[0].equity;
   datetime         peak_time    = curve[0].time;
   bool             in_drawdown  = false;
   CDrawdownEpisode current;
//--- give every field a known default; the loop below only ever reads a
//--- field after in_drawdown has guaranteed it was written, but the
//--- compiler cannot prove that across loop iterations on its own
   current.start_time    = 0;
   current.trough_time   = 0;
   current.recovery_time = 0;
   current.peak_equity   = 0.0;
   current.trough_equity = 0.0;
   current.depth_percent = 0.0;
   current.duration_days = 0.0;
   current.is_open       = false;
   for(int i = 1; i < count; i++)
     {
      double   eq = curve[i].equity;
      datetime t  = curve[i].time;
      //--- a new high or a recovery: close any open episode, advance the peak
      if(eq >= running_peak)
        {
         if(in_drawdown)
           {
            current.recovery_time = t;
            current.is_open       = false;
            episodes[episode_count] = current;
            episode_count++;
            in_drawdown = false;
           }
         running_peak = eq;
         peak_time    = t;
        }
      //--- underwater: start a new episode, or extend the current trough
      else
        {
         if(!in_drawdown)
           {
            in_drawdown           = true;
            current.start_time    = peak_time;
            current.peak_equity   = running_peak;
            current.trough_time   = t;
            current.trough_equity = eq;
           }
         else
           {
            if(eq < current.trough_equity)
              {
               current.trough_equity = eq;
               current.trough_time   = t;
              }
           }
        }
     }
//--- an episode still underwater at the end of the curve stays open
   if(in_drawdown)
     {
      current.recovery_time = curve[count - 1].time;
      current.is_open        = true;
      episodes[episode_count] = current;
      episode_count++;
     }
//--- compute depth and duration for every episode found
   for(int i = 0; i < episode_count; i++)
     {
      episodes[i].depth_percent =
         (episodes[i].peak_equity - episodes[i].trough_equity) / episodes[i].peak_equity * 100.0;
      episodes[i].duration_days =
         (double)(episodes[i].recovery_time - episodes[i].start_time) / 86400.0;
     }
   ::ArrayResize(episodes, episode_count);
   return(episode_count);
  }
The local variable current is zero-initialized before the loop. The control flow guarantees every field is written before it is ever read, since in_drawdown only becomes true after start_time, peak_equity, trough_time, and trough_equity are all set together, but that guarantee depends on a runtime flag the compiler cannot trace across loop iterations on its own. Giving current a known default up front satisfies the compiler without changing the method's behavior at all.
Section 4: CDrawdownStatsCalculator — Depth, Duration, and Recovery Summary
Once every episode has been identified, three numbers summarize the account's drawdown history at a glance: the deepest episode's depth, the longest episode's duration, and the average time it took to recover from a completed drawdown.
//+------------------------------------------------------------------+
//|                                      DrawdownStatsCalculator.mqh |
//+------------------------------------------------------------------+
#ifndef DRAWDOWNSTATSCALCULATOR_MQH
#define DRAWDOWNSTATSCALCULATOR_MQH

#include "DrawdownTypes.mqh"

//+------------------------------------------------------------------+
//| CDrawdownStatsCalculator                                         |
//| Folds a set of drawdown episodes into summary statistics: the    |
//| deepest depth, the longest duration, and the average recovery    |
//| time across episodes that have actually recovered.               |
//+------------------------------------------------------------------+
class CDrawdownStatsCalculator
  {
public:
                     CDrawdownStatsCalculator(void);
                    ~CDrawdownStatsCalculator(void);

   void                  ComputeSummary(const CDrawdownEpisode &episodes[], int count,
                                        double &max_depth_out, double &longest_duration_out,
                                        double &avg_recovery_out, int &open_count_out);
  };

//+------------------------------------------------------------------+
//| Constructor: no member state to initialize.                      |
//+------------------------------------------------------------------+
CDrawdownStatsCalculator::CDrawdownStatsCalculator(void)
  {
  }

//+------------------------------------------------------------------+
//| Destructor: no dynamic resources to release.                     |
//+------------------------------------------------------------------+
CDrawdownStatsCalculator::~CDrawdownStatsCalculator(void)
  {
  }
ComputeSummary() takes the maximum depth and the maximum duration across every episode, open or closed, since a still-open drawdown is just as real a depth as a finished one. Average recovery time is different: it only makes sense for episodes that have actually recovered, so open episodes are excluded from that average, and the method also reports how many episodes are still open, since that count matters on its own.
//+------------------------------------------------------------------+
//| ComputeSummary                                                   |
//+------------------------------------------------------------------+
void CDrawdownStatsCalculator::ComputeSummary(const CDrawdownEpisode &episodes[], int count,
      double &max_depth_out, double &longest_duration_out,
      double &avg_recovery_out, int &open_count_out)
  {
   double max_depth    = 0.0;
   double longest_dur  = 0.0;
   double recovery_sum = 0.0;
   int    closed_count = 0;
   int    open_count   = 0;
//--- scan every episode for the deepest depth and the longest duration
   for(int i = 0; i < count; i++)
     {
      if(episodes[i].depth_percent > max_depth)
         max_depth = episodes[i].depth_percent;
      if(episodes[i].duration_days > longest_dur)
         longest_dur = episodes[i].duration_days;
      //--- only recovered episodes contribute to the average recovery time
      if(episodes[i].is_open)
         open_count++;
      else
        {
         recovery_sum += episodes[i].duration_days;
         closed_count++;
        }
     }
   max_depth_out        = max_depth;
   longest_duration_out = longest_dur;
//--- guard against division by zero when no episode has recovered yet
   if(closed_count > 0)
      avg_recovery_out = recovery_sum / (double)closed_count;
   else
      avg_recovery_out = 0.0;
   open_count_out = open_count;
  }
Section 5: CDrawdownTimelineChart — Rendering with CCanvas
The timeline chart draws the equity curve as a line and shades every drawdown episode as a translucent band spanning its start and recovery times, so a trader can see at a glance where the account was underwater and for how long, rather than reading numbers off a table.
//+------------------------------------------------------------------+
//|                                        DrawdownTimelineChart.mqh |
//+------------------------------------------------------------------+
#ifndef DRAWDOWNTIMELINECHART_MQH
#define DRAWDOWNTIMELINECHART_MQH

#include <Canvas\Canvas.mqh>
#include "DrawdownTypes.mqh"

//+------------------------------------------------------------------+
//| CDrawdownTimelineChart                                           |
//| Renders the equity curve as a line, with each drawdown episode   |
//| shaded as a translucent band annotated with its depth and        |
//| duration, using a CCanvas panel.                                 |
//+------------------------------------------------------------------+
class CDrawdownTimelineChart
  {
private:
   CCanvas               m_canvas;
   string                m_object_name;
   bool                  m_created;
   string                m_font_name;
   int                   m_font_size;
   uint                  m_font_flags;

   int                   FindIndexForTime(const CEquityPoint &curve[], int count, datetime t) const;

public:
                     CDrawdownTimelineChart(void);
                    ~CDrawdownTimelineChart(void);

   bool                  Draw(const CEquityPoint &curve[], int curve_count,
                              const CDrawdownEpisode &episodes[], int episode_count,
                              int x, int y, int width, int height);
   void                  Clear(void);
  };
The constructor fixes the object name, a known font name and size, and a bold weight flag together, so that any text measured with the global ::TextGetSize() later matches what the canvas actually draws. Font size and weight are exposed as two clearly marked lines here specifically so a reader who wants larger or lighter annotation text has exactly one place to change it. The destructor is left empty intentionally: a script's OnStart() returns almost immediately after drawing, and a destructor that tore the panel down would delete it from the chart before a trader ever saw it. The bitmap is a chart object owned by the chart, not by this instance's lifetime.
//+------------------------------------------------------------------+
//| Constructor                                                      |
//+------------------------------------------------------------------+
CDrawdownTimelineChart::CDrawdownTimelineChart(void)
  {
   m_object_name = "DrawdownTimelinePanel";
   m_created     = false;
   m_font_name   = "Arial";
   m_font_size   = 14;      // <-- edit this to change the annotation text size
   m_font_flags  = FW_BOLD; // <-- edit/remove this to change the annotation weight
  }

//+------------------------------------------------------------------+
//| Destructor                                                       |
//+------------------------------------------------------------------+
CDrawdownTimelineChart::~CDrawdownTimelineChart(void)
  {
  }
Draw() maps the x‑axis to point indices, not calendar time. This avoids compressing dense trading periods into a narrow section when the account has long inactive gaps. Index-based spacing gives each episode comparable visual width. Durations are still computed in days and shown in labels and the log; only the visual spacing changes.
Two further details keep the annotations legible. Each label's text is measured with ::TextGetSize() before being centered under its band. This is done to avoid a label drifting off-center. And every other episode's label is placed on a second row, alternating by index, which guarantees that any two adjacent episodes, the ones most likely to land close together once spacing is index-based, are never on the same row and so can never collide with each other.
//+------------------------------------------------------------------+
//| Draw                                                             |
//+------------------------------------------------------------------+
bool CDrawdownTimelineChart::Draw(const CEquityPoint &curve[], int curve_count,
                                  const CDrawdownEpisode &episodes[], int episode_count,
                                  int x, int y, int width, int height)
  {
//--- remove any previously drawn panel before creating a new one
   Clear();
   if(!m_canvas.CreateBitmapLabel(m_object_name, x, y, width, height, COLOR_FORMAT_ARGB_NORMALIZE))
     {
      ::Print("DrawdownDashboard: CreateBitmapLabel failed, error ", ::GetLastError());
      return(false);
     }
   m_created = true;
//--- fix a known font for both drawing and measurement, so the two never disagree
   m_canvas.FontSet(m_font_name, m_font_size, m_font_flags);
   ::TextSetFont(m_font_name, m_font_size, m_font_flags);
   m_canvas.Erase(::ColorToARGB(clrWhiteSmoke, 255));
   if(curve_count < 2)
     {
      m_canvas.Update();
      return(true);
     }
//--- find the equity range across the curve, with a small padding margin
   double min_eq = curve[0].equity;
   double max_eq = curve[0].equity;
   for(int i = 1; i < curve_count; i++)
     {
      if(curve[i].equity < min_eq)
         min_eq = curve[i].equity;
      if(curve[i].equity > max_eq)
         max_eq = curve[i].equity;
     }
   double eq_range = max_eq - min_eq;
   if(eq_range <= 0.0)
      eq_range = 1.0;
   double eq_pad = eq_range * 0.1;
   min_eq -= eq_pad;
   max_eq += eq_pad;
   eq_range = max_eq - min_eq;
//--- map the curve's point index, not elapsed calendar time, to the
//--- horizontal drawing area. Mapping by index rather than by time
//--- keeps a long quiet stretch from squeezing a burst of recent
//--- activity into a sliver of the panel; the exact duration in days
//--- is still shown in each annotation and in the terminal log table.
   int last_index   = curve_count - 1;
//--- reserve two stacked rows for annotation text, regardless of how
//--- many days the lookback spans; alternating rows below guarantees
//--- two adjacent episodes never share a row, so their labels cannot
//--- collide even when the episodes themselves sit close together
   int line_height  = m_font_size + 6;
   int chart_top    = 10 + (2 * line_height);
   int chart_bottom = height - 20;
   int chart_left   = 10;
   int chart_right  = width - 10;
//--- draw a shaded band and annotation for each drawdown episode
   for(int i = 0; i < episode_count; i++)
     {
      int start_index     = FindIndexForTime(curve, curve_count, episodes[i].start_time);
      int recovery_index  = FindIndexForTime(curve, curve_count, episodes[i].recovery_time);
      int bx1 = chart_left + (int)(((double)start_index    / last_index) * (chart_right - chart_left));
      int bx2 = chart_left + (int)(((double)recovery_index / last_index) * (chart_right - chart_left));
      m_canvas.FillRectangle(bx1, chart_top, bx2, chart_bottom, ::ColorToARGB(clrCrimson, 60));
      //--- build the annotation text and measure it before centering
      string tag = ::DoubleToString(episodes[i].depth_percent, 1) + "% / " +
                   ::DoubleToString(episodes[i].duration_days, 0) + "d";
      if(episodes[i].is_open)
         tag = tag + " (open)";
      uint measured_w = 0;
      uint measured_h = 0;
      ::TextGetSize(tag, measured_w, measured_h);
      int mid    = (bx1 + bx2) / 2;
      int row    = i % 2;
      int text_y = 6 + (row * line_height);
      m_canvas.TextOut(mid - (int)measured_w / 2, text_y, tag, ::ColorToARGB(clrBlack, 255));
     }
//--- draw the equity curve as a series of connected line segments,
//--- spacing each point evenly by index rather than by elapsed time
   int prev_x = 0;
   int prev_y = 0;
   for(int i = 0; i < curve_count; i++)
     {
      int px = chart_left + (int)(((double)i / last_index) * (chart_right - chart_left));
      int py = chart_bottom - (int)(((curve[i].equity - min_eq) / eq_range) * (chart_bottom - chart_top));
      if(i > 0)
         m_canvas.Line(prev_x, prev_y, px, py, ::ColorToARGB(clrDarkSlateBlue, 255));
      prev_x = px;
      prev_y = py;
     }
   m_canvas.Update();
   return(true);
  }
FindIndexForTime() supports the index-based mapping above: every episode boundary time originates from an actual curve point, since Analyze() never invents a time, so a linear scan for an exact match is guaranteed to succeed in practice.
//+------------------------------------------------------------------+
//| FindIndexForTime                                                 |
//+------------------------------------------------------------------+
int CDrawdownTimelineChart::FindIndexForTime(const CEquityPoint &curve[], int count, datetime t) const
  {
   for(int i = 0; i < count; i++)
     {
      if(curve[i].time == t)
         return(i);
     }
   return(count - 1);
  }
Clear() follows the same pattern used throughout this dashboard's CCanvas work: it removes the bitmap and resets the created flag, still runs at the top of Draw() to avoid leaving a stale bitmap behind, and remains available for a caller that wants to tear the panel down explicitly.
//+------------------------------------------------------------------+
//| Clear                                                            |
//+------------------------------------------------------------------+
void CDrawdownTimelineChart::Clear(void)
  {
   if(!m_created)
      return;
   m_canvas.Destroy();
   m_created = false;
  }
Section 6: CDrawdownTablePrinter — Sorted Terminal Log Summary
The whole point of measuring duration alongside depth is lost if the terminal log still lists episodes in the order they occurred. CDrawdownTablePrinter sorts by duration before printing, so the longest dry spell appears first regardless of how deep it was.
//+------------------------------------------------------------------+
//|                                         DrawdownTablePrinter.mqh |
//+------------------------------------------------------------------+
#ifndef DRAWDOWNTABLEPRINTER_MQH
#define DRAWDOWNTABLEPRINTER_MQH

#include "DrawdownTypes.mqh"

//+------------------------------------------------------------------+
//| CDrawdownTablePrinter                                            |
//| Prints a table of drawdown episodes to the terminal log, sorted  |
//| by duration in descending order.                                 |
//+------------------------------------------------------------------+
class CDrawdownTablePrinter
  {
private:
   string                PadRight(string value, int width) const;
   void                  SortByDuration(CDrawdownEpisode &episodes[], int count) const;

public:
                     CDrawdownTablePrinter(void);
                    ~CDrawdownTablePrinter(void);

   void                  Print(const CDrawdownEpisode &episodes_in[], int count) const;
  };

//+------------------------------------------------------------------+
//| Constructor: no member state to initialize.                      |
//+------------------------------------------------------------------+
CDrawdownTablePrinter::CDrawdownTablePrinter(void)
  {
  }

//+------------------------------------------------------------------+
//| Destructor: no dynamic resources to release.                     |
//+------------------------------------------------------------------+
CDrawdownTablePrinter::~CDrawdownTablePrinter(void)
  {
  }
Print() copies the incoming episodes into a local array before sorting, so the caller's own array is never mutated as a side effect of printing.
//+------------------------------------------------------------------+
//| Print                                                            |
//+------------------------------------------------------------------+
void CDrawdownTablePrinter::Print(const CDrawdownEpisode &episodes_in[], int count) const
  {
//--- copy the episodes so sorting never mutates the caller's own array
   CDrawdownEpisode sorted[];
   ::ArrayResize(sorted, count);
   for(int i = 0; i < count; i++)
      sorted[i] = episodes_in[i];
   SortByDuration(sorted, count);
//--- print the header row with fixed-width column labels
   string header = PadRight("Start", 12) + PadRight("Depth %", 10) +
                   PadRight("Duration(d)", 14) + PadRight("Status", 10);
   ::Print(header);
//--- print one row per episode, longest duration first
   for(int i = 0; i < count; i++)
     {
      string row = PadRight(::TimeToString(sorted[i].start_time, TIME_DATE), 12) +
                   PadRight(::DoubleToString(sorted[i].depth_percent, 1), 10) +
                   PadRight(::DoubleToString(sorted[i].duration_days, 1), 14) +
                   PadRight(sorted[i].is_open ? "Open" : "Recovered", 10);
      ::Print(row);
     }
  }
SortByDuration() is a straightforward descending bubble sort, matching the complexity level already used in this dashboard's helper methods, since episode counts are small enough that a more elaborate sort would not be worth the added code.
//+------------------------------------------------------------------+
//| SortByDuration                                                   |
//+------------------------------------------------------------------+
void CDrawdownTablePrinter::SortByDuration(CDrawdownEpisode &episodes[], int count) const
  {
   CDrawdownEpisode temp;
   for(int i = 0; i < count - 1; i++)
     {
      for(int j = 0; j < count - 1 - i; j++)
        {
         if(episodes[j].duration_days < episodes[j + 1].duration_days)
           {
            temp             = episodes[j];
            episodes[j]      = episodes[j + 1];
            episodes[j + 1]  = temp;
           }
        }
     }
  }
PadRight() pads a string with trailing spaces up to the given width, or returns the original string unchanged if it already meets or exceeds that width.
//+------------------------------------------------------------------+
//| PadRight                                                         |
//+------------------------------------------------------------------+
string CDrawdownTablePrinter::PadRight(string value, int width) const
  {
   int need = width - ::StringLen(value);
   if(need <= 0)
      return(value);
   string result = value;
   for(int i = 0; i < need; i++)
      result += " ";
   return(result);
  }
Section 7: DrawdownDurationDashboard.mq5 — Assembling the Main Script
The main script's inputs give a trader control over the lookback window, the opening balance to reconstruct the curve from, and the panel's position and size on the chart. Drawdown analysis needs a longer lookback than a same-week session breakdown, since a multi-week episode cannot show up in a short window, so the default here is wider.
//+------------------------------------------------------------------+
//|                                  DrawdownDurationDashboard.mq5   |
//+------------------------------------------------------------------+

#property script_show_inputs

#include <DrawdownDashboard/DrawdownTypes.mqh>
#include <DrawdownDashboard/EquityCurveBuilder.mqh>
#include <DrawdownDashboard/DrawdownAnalyzer.mqh>
#include <DrawdownDashboard/DrawdownStatsCalculator.mqh>
#include <DrawdownDashboard/DrawdownTimelineChart.mqh>
#include <DrawdownDashboard/DrawdownTablePrinter.mqh>

input int    InpLookbackDays    = 180;      // Number of days to look back from now
input double InpStartingBalance = 10000.0;  // Account balance at the start of the lookback window
input int    InpPanelX          = 20;       // Canvas panel X coordinate
input int    InpPanelY          = 20;       // Canvas panel Y coordinate
input int    InpPanelWidth      = 640;      // Canvas panel width in pixels
input int    InpPanelHeight     = 240;      // Canvas panel height in pixels
OnStart() resolves the lookback into a date range, builds the equity curve, analyzes it for drawdown episodes, computes the summary statistics, then renders both the timeline chart and the sorted table.
//+------------------------------------------------------------------+
//| OnStart                                                          |
//+------------------------------------------------------------------+
void OnStart(void)
  {
//--- resolve the date range from the lookback input
   datetime to_time   = ::TimeCurrent();
   datetime from_time = to_time - (InpLookbackDays * 86400);
//--- reconstruct the equity curve from closed deal history
   CEquityCurveBuilder builder;
   CEquityPoint        curve[];
   int                 curve_count = builder.Read(from_time, to_time, InpStartingBalance, curve);
   ::Print("DrawdownDashboard: built equity curve with ", curve_count, " points");
   if(curve_count < 2)
     {
      ::Print("DrawdownDashboard: not enough history to analyze drawdowns");
      return;
     }
//--- identify every drawdown episode on the curve
   CDrawdownAnalyzer analyzer;
   CDrawdownEpisode  episodes[];
   int               episode_count = analyzer.Analyze(curve, curve_count, episodes);
   ::Print("DrawdownDashboard: identified ", episode_count, " drawdown episodes");
//--- compute the summary statistics across every episode
   CDrawdownStatsCalculator stats;
   double max_depth        = 0.0;
   double longest_duration = 0.0;
   double avg_recovery     = 0.0;
   int    open_count       = 0;
   stats.ComputeSummary(episodes, episode_count, max_depth, longest_duration, avg_recovery, open_count);
   ::PrintFormat("DrawdownDashboard: max depth %.2f%%, longest duration %.1f days, average recovery %.1f days, %d open",
                 max_depth, longest_duration, avg_recovery, open_count);
//--- render the timeline chart
   CDrawdownTimelineChart chart;
   chart.Draw(curve, curve_count, episodes, episode_count,
              InpPanelX, InpPanelY, InpPanelWidth, InpPanelHeight);
//--- print the sorted episode table to the terminal log
   CDrawdownTablePrinter printer;
   printer.Print(episodes, episode_count);
  }
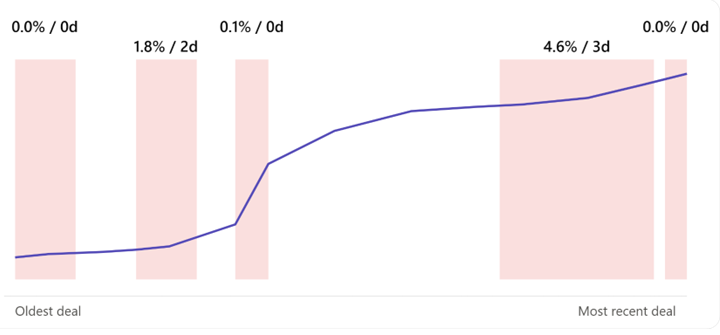
Drawdown dashboard mock-up: each drawdown gets equal space by sequence, not by elapsed time. Bold labels alternate rows so close-together episodes never overlap.
Section 8: Verification — TestDrawdownAnalytics.mq5
The verification script builds a fixed synthetic equity curve with three deliberate cases: a deep but short drawdown, a shallow but long one, and a drawdown still open at the end of the data, and checks that the analyzer and stats calculator produce the exact numbers worked out by hand.
//+------------------------------------------------------------------+
//|                                       TestDrawdownAnalytics.mq5  |
//+------------------------------------------------------------------+

#include <DrawdownDashboard/DrawdownTypes.mqh>
#include <DrawdownDashboard/DrawdownAnalyzer.mqh>
#include <DrawdownDashboard/DrawdownStatsCalculator.mqh>

#define ASSERT(condition, message) TestAssert((condition), (message))

int g_pass_count = 0;
int g_fail_count = 0;

//+------------------------------------------------------------------+
//| TestAssert                                                       |
//| Prints a pass or fail message for a single test condition and    |
//| tracks the running pass and fail counts.                         |
//+------------------------------------------------------------------+
void TestAssert(bool condition, string message)
  {
   if(condition)
     {
      g_pass_count++;
      ::Print("PASS: ", message);
     }
   else
     {
      g_fail_count++;
      ::Print("FAIL: ", message);
     }
  }

//+------------------------------------------------------------------+
//| DayOffset                                                        |
//| Converts a plain day number into a datetime, used to build a     |
//| fixed synthetic equity curve for the tests below.                |
//+------------------------------------------------------------------+
datetime DayOffset(int day)
  {
   return((datetime)(day * 86400));
  }

//+------------------------------------------------------------------+
//| OnStart                                                          |
//| Builds a synthetic equity curve with a deep short drawdown, a    |
//| shallow long drawdown, and a still-open drawdown, then checks    |
//| the analyzer and stats calculator against hand-worked values.    |
//+------------------------------------------------------------------+
void OnStart(void)
  {
//--- build the synthetic curve: day offset and equity value pairs
   int    d[12] = {0, 3, 8, 10, 20, 30, 40, 50, 57, 60, 65, 70};
   double e[12] = {10000.0, 8500.0, 10050.0, 10050.0, 9246.0, 9500.0,
                   9800.0, 9950.0, 10050.0, 10500.0, 10100.0, 10200.0
                  };
   CEquityPoint curve[12];
   for(int i = 0; i < 12; i++)
     {
      curve[i].time   = DayOffset(d[i]);
      curve[i].equity = e[i];
     }
//--- run the analyzer against the synthetic curve
   CDrawdownAnalyzer analyzer;
   CDrawdownEpisode  episodes[];
   int count = analyzer.Analyze(curve, 12, episodes);
//--- test 1: exactly three episodes should be found
   ASSERT(count == 3, "three drawdown episodes are identified from the synthetic curve");
//--- test 2 and 3: the deep short episode is 15.0% deep over 8 days
   ASSERT(::MathAbs(episodes[0].depth_percent - 15.0) < 0.001,
          "episode 1 depth computes to 15.0%");
   ASSERT(::MathAbs(episodes[0].duration_days - 8.0) < 0.001,
          "episode 1 duration computes to 8.0 days");
//--- test 4 and 5: the shallow long episode is 8.0% deep over 47 days
   ASSERT(::MathAbs(episodes[1].depth_percent - 8.0) < 0.001,
          "episode 2 depth computes to 8.0%");
   ASSERT(::MathAbs(episodes[1].duration_days - 47.0) < 0.001,
          "episode 2 duration computes to 47.0 days");
//--- test 6 and 7: the still-open episode is flagged open with a 10 day elapsed duration
   ASSERT(episodes[2].is_open == true,
          "episode 3 is correctly flagged as still open");
   ASSERT(::MathAbs(episodes[2].duration_days - 10.0) < 0.001,
          "episode 3 elapsed duration computes to 10.0 days");
//--- run the stats calculator against the same episodes
   CDrawdownStatsCalculator stats;
   double max_depth        = 0.0;
   double longest_duration = 0.0;
   double avg_recovery     = 0.0;
   int    open_count       = 0;
   stats.ComputeSummary(episodes, count, max_depth, longest_duration, avg_recovery, open_count);
//--- test 8, 9, 10, 11: summary statistics match the hand-worked values
   ASSERT(::MathAbs(max_depth - 15.0) < 0.001,
          "max depth across all episodes computes to 15.0%");
   ASSERT(::MathAbs(longest_duration - 47.0) < 0.001,
          "longest duration across all episodes computes to 47.0 days");
   ASSERT(::MathAbs(avg_recovery - 27.5) < 0.001,
          "average recovery time across closed episodes computes to 27.5 days");
   ASSERT(open_count == 1,
          "exactly one episode is still open");
//--- print the final summary of pass and fail counts
   ::Print("TestDrawdownAnalytics: ", g_pass_count, " passed, ", g_fail_count, " failed");
  }
//+------------------------------------------------------------------+
Section 9: Extending the Dashboard
A trader who wants to compare drawdown behavior across periods could extend CDrawdownStatsCalculator with a method that buckets episodes by calendar quarter, showing whether a strategy's typical drawdown duration has been getting longer or shorter over time, rather than just reporting one number across the whole lookback window.
Exporting episodes to CSV would let a trader analyze them further in a spreadsheet. This follows the same pattern used in this dashboard's design: FileOpen() with FILE_WRITE and FILE_CSV, one FileWrite() call per sorted episode row, and FileClose() once every row is written.
A configurable recovery threshold would make the analyzer more flexible. Right now, Analyze() only considers an episode recovered once equity reaches or exceeds the exact peak that preceded it; a trader might instead want to call it recovered once equity reaches, say, 99% of that peak, which would shorten reported durations slightly but might better match how the trader thinks about being "back to even."
A live-updating version could call the whole pipeline on a timer rather than once per script run, letting the panel refresh automatically as new deals close, so a currently open drawdown's elapsed duration stays current without a trader needing to rerun the script by hand.
Section 10: Limitations
InpStartingBalance has to be set correctly by the trader for the curve to be meaningful. The script has no way to independently verify what the account balance actually was at the start of the queried lookback window, since MQL5 does not expose a reliable historical balance snapshot; an incorrect starting balance shifts the entire curve up or down without changing its shape, which would distort every depth percentage computed from it.
An episode's duration is only final once it has recovered. For an episode still open at the end of the queried range, duration_days measures time elapsed so far, not a true final duration, and comparing an open episode's duration directly against a closed one's, as ComputeSummary()'s longest-duration figure does, can understate how the open episode will eventually compare once it does recover.
Recovery is defined as equity reaching or exceeding the exact peak that preceded the drawdown. This is a strict definition: a trader who considers a small amount of slippage below the old peak as "recovered enough" would see this dashboard report a slightly longer duration than they might expect.
The timeline chart spaces points by index rather than by elapsed time, which is what keeps a long quiet stretch from squeezing recent activity into a sliver of the panel, but it also means the horizontal distance between two points on the chart no longer represents how much calendar time separated them. A trader who needs a literal proportional timeline would need to accept the crowding that comes with it, or extend the timeline chart to support both modes.
The alternating two-row annotation layout guarantees that any two adjacent episodes never share a row, which resolves the collision case this dashboard is built to prevent. It does not guarantee that an episode and the one two positions away, which do share a row, can never collide, though in practice they are usually separated by enough space from the episode between them.
Conclusion
This article built a drawdown duration analysis dashboard from two structs, a curve builder, an analyzer, a stats calculator, and two output paths: a CCanvas timeline chart and a terminal log table sorted by duration rather than depth. A verification script confirmed the analyzer correctly separates a deep short drawdown from a shallow long one, correctly flags an unresolved drawdown as open, and correctly computes every summary statistic against hand-worked values.
What this dashboard adds over a standard drawdown report is exactly the dimension that report leaves out: how long the account stayed underwater, not just how far it fell. What it does not cover is any independent verification of the starting balance a trader supplies, a literal proportional sense of elapsed time on the timeline chart, or a way to compare an open episode's elapsed duration against a closed episode's final duration on equal footing. A trader who needs any of these will need to extend the classes described in Section 9.
Programs used in the article:
| # | Name | Type | Description |
|---|---|---|---|
| 1 | DrawdownTypes.mqh | Include File | Defines the CEquityPoint and CDrawdownEpisode structs |
| 2 | EquityCurveBuilder.mqh | Include File | CEquityCurveBuilder class: reconstructs the equity curve from closed deal history |
| 3 | DrawdownAnalyzer.mqh | Include File | CDrawdownAnalyzer class: identifies drawdown episodes on the curve |
| 4 | DrawdownStatsCalculator.mqh | Include File | CDrawdownStatsCalculator class: computes depth, duration, and recovery summary statistics |
| 5 | DrawdownTimelineChart.mqh | Include File | CDrawdownTimelineChart class: renders the equity curve and shaded drawdown bands via CCanvas, spaced by point index with alternating-row annotations |
| 6 | DrawdownTablePrinter.mqh | Include File | CDrawdownTablePrinter class: prints the episode table to the terminal log, sorted by duration |
| 7 | DrawdownDurationDashboard.mq5 | Script | Main script: wires all components, builds the curve, analyzes, and renders |
| 8 | TestDrawdownAnalytics.mq5 | Script | Verification script covering episode detection, depth, duration, open status, and summary statistics |
| 9 | DrawdownDashboard.zip | Zip Archive | Zip archive containing all the attached files and their paths relative to the terminal's root folder. |
Warning: All rights to these materials are reserved by MetaQuotes Ltd. Copying or reprinting of these materials in whole or in part is prohibited.
This article was written by a user of the site and reflects their personal views. MetaQuotes Ltd is not responsible for the accuracy of the information presented, nor for any consequences resulting from the use of the solutions, strategies or recommendations described.

 Random Matrix Theory: Denoising the Correlation Matrix for Multi-Symbol EAs
 Testing for Residual Autocorrelation with the Ljung-Box Portmanteau Test in MQL5
 Features of Experts Advisors
 Neural Networks in Trading: The Adaptive Graph Diffusion Model (Conclusion)

- Free trading apps
- Over 8,000 signals for copying
- Economic news for exploring financial markets
You agree to website policy and terms of use