

Win Rate and Edge Ratio Heatmap by Hour and Symbol in MQL5
 115
115
 0
0

Introduction
Running one strategy across several symbols and hours effectively creates many distinct strategy variants. Traders often do not realize this. EURUSD at the London open behaves nothing like XAUUSD overnight, and a single blended win rate across the whole account can hide the fact that some symbol-and-hour combinations are quietly profitable while others are quietly bleeding money. There is no built-in way to see this two-dimensional pattern; the terminal's history view is a flat list, not a grid.
The script groups closed deals by symbol and UTC closing hour. For each symbol–hour cell, it computes win rate and edge ratio (payoff ratio). It then renders two CCanvas heatmaps: one for win rate and one for edge ratio, shaded from red through amber to green. An Experts tab table lists the best and worst symbol-and-hour combinations by win rate, so the pattern is available as both a picture and a plain list.
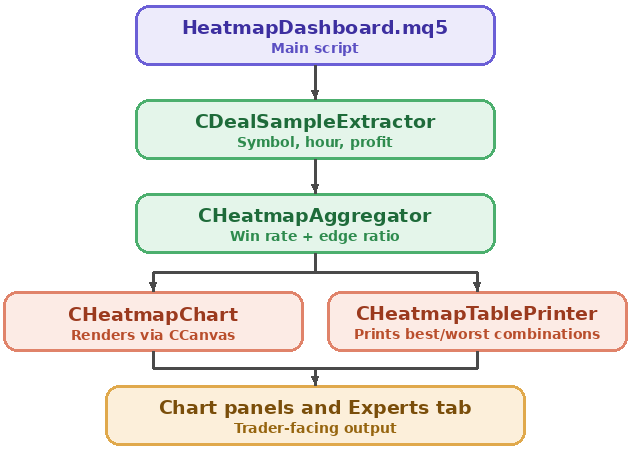
Heatmap dashboard architectural diagram
Section 1: HeatmapTypes.mqh — Deal Samples and Heatmap Cells
CDealSample is the smallest record the pipeline needs for one closed deal: which symbol it was on, the UTC hour its close time falls in, and its net profit. Reducing every deal to just these three fields keeps the aggregation step that follows simple and fast.
//+------------------------------------------------------------------+
//|                                                 HeatmapTypes.mqh |
//+------------------------------------------------------------------+
#ifndef HEATMAPTYPES_MQH
#define HEATMAPTYPES_MQH

//+------------------------------------------------------------------+
//| CDealSample                                                      |
//| One closed deal reduced to the fields the heatmap needs: symbol, |
//| the UTC hour of its close time, and its net profit.              |
//+------------------------------------------------------------------+
struct CDealSample
  {
   string            symbol;
   int               hour_utc;
   double            profit;
  };
CHeatmapCell holds the computed result for one symbol-and-hour combination: how many trades happened, how many won, the win rate as a percentage, and the edge ratio. The has_rr flag exists because that ratio is only meaningful when a cell has at least one win and at least one loss to compare; a cell containing only wins or only losses has no ratio to report, and this field is what keeps that distinction explicit rather than silently defaulting to a misleading zero.
//+------------------------------------------------------------------+
//| CHeatmapCell                                                     |
//| The computed result for one symbol-and-hour combination: trade   |
//| count, win count, win rate, and edge ratio. has_rr is false      |
//| whenever a cell has no wins, no losses, or both, since a ratio   |
//| needs at least one of each to mean anything.                     |
//+------------------------------------------------------------------+
struct CHeatmapCell
  {
   string            symbol;
   int               hour;
   int               trade_count;
   int               win_count;
   double            win_rate_percent;
   bool              has_rr;
   double            avg_rr;
  };

#endif // HEATMAPTYPES_MQH
//+------------------------------------------------------------------+
Section 2: CDealSampleExtractor — Reading Symbol, Hour, and Profit
Every deal this extractor reads gets reduced to exactly three things: which symbol it traded, what hour of the day (in UTC) it closed, and what it made or lost. There's no need to track when the position was opened, since a heatmap grouped by hour of day only cares about the moment a trade ended, not how long it was open beforehand. That keeps this reader considerably shorter than a typical deal history reader: no lookup for a matching open time, no position ID tracking, just one pass through history pulling out the fields the aggregation step actually needs.
//+------------------------------------------------------------------+
//|                                          DealSampleExtractor.mqh |
//+------------------------------------------------------------------+
#ifndef DEALSAMPLEEXTRACTOR_MQH
#define DEALSAMPLEEXTRACTOR_MQH

#include "HeatmapTypes.mqh"

//+------------------------------------------------------------------+
//| CDealSampleExtractor                                             |
//| Reads closed deal history for a date range and reduces each deal |
//| to its symbol, close hour, and net profit. The hour is taken     |
//| directly from the deal's own close-time timestamp and treated as |
//| UTC without conversion or verification; see the Limitations      |
//| section for what this assumes about the broker's reported time.  |
//+------------------------------------------------------------------+
class CDealSampleExtractor
  {
public:
                     CDealSampleExtractor(void);
                    ~CDealSampleExtractor(void);

   int                   Read(datetime from, datetime to, CDealSample &deals_out[]);
  };

//+------------------------------------------------------------------+
//| Constructor: no member state to initialize.                      |
//+------------------------------------------------------------------+
CDealSampleExtractor::CDealSampleExtractor(void)
  {
  }

//+------------------------------------------------------------------+
//| Destructor: no dynamic resources to release.                     |
//+------------------------------------------------------------------+
CDealSampleExtractor::~CDealSampleExtractor(void)
  {
  }

//+------------------------------------------------------------------+
//| Read                                                             |
//| Selects history for the given date range, keeps only closing     |
//| deals, and records each one's symbol, close hour, and net profit |
//| (profit + swap + commission). The close hour is read straight    |
//| from the deal's own timestamp with no time zone conversion, so   |
//| it is only as accurate as the assumption that the broker already |
//| reports deal times in UTC. Returns the number of samples         |
//| populated.                                                       |
//+------------------------------------------------------------------+
int CDealSampleExtractor::Read(datetime from, datetime to, CDealSample &deals_out[])
  {
//--- scope the terminal's history cache to the requested range
   if(!::HistorySelect(from, to))
     {
      ::Print("HeatmapDashboard: HistorySelect failed, error ", ::GetLastError());
      return(0);
     }
   int      total      = ::HistoryDealsTotal();
   ::ArrayResize(deals_out, total);
   int      found      = 0;
   ulong    ticket     = 0;
   long     entry_type = 0;
   double   profit     = 0.0;
   double   swap       = 0.0;
   double   commission = 0.0;
   string   symbol     = "";
   datetime close_time = 0;
   MqlDateTime dt;
//--- iterate every deal in the selected history range
   for(int i = 0; i < total; i++)
     {
      ticket = ::HistoryDealGetTicket(i);
      if(ticket == 0)
         continue;
      //--- keep only deals that represent an actual closed trade
      entry_type = ::HistoryDealGetInteger(ticket, DEAL_ENTRY);
      if(entry_type != DEAL_ENTRY_OUT && entry_type != DEAL_ENTRY_INOUT)
         continue;
      profit     = ::HistoryDealGetDouble(ticket, DEAL_PROFIT);
      swap       = ::HistoryDealGetDouble(ticket, DEAL_SWAP);
      commission = ::HistoryDealGetDouble(ticket, DEAL_COMMISSION);
      symbol     = ::HistoryDealGetString(ticket, DEAL_SYMBOL);
      close_time = (datetime)::HistoryDealGetInteger(ticket, DEAL_TIME);
      //--- extract the hour component from the close time, assumed to
      //--- already be UTC; no conversion is performed here
      ::TimeToStruct(close_time, dt);
      deals_out[found].symbol   = symbol;
      deals_out[found].hour_utc = dt.hour;
      deals_out[found].profit   = profit + swap + commission;
      found++;
     }
   ::ArrayResize(deals_out, found);
   return(found);
  }

#endif // DEALSAMPLEEXTRACTOR_MQH
//+------------------------------------------------------------------+
Section 3: CHeatmapAggregator — Grouping by Symbol and Hour
CHeatmapAggregator turns the flat list of deal samples into one row per symbol and hour, computing a win rate and an edge ratio for each.
//+------------------------------------------------------------------+
//|                                            HeatmapAggregator.mqh |
//+------------------------------------------------------------------+
#ifndef HEATMAPAGGREGATOR_MQH
#define HEATMAPAGGREGATOR_MQH

#include "HeatmapTypes.mqh"

//+------------------------------------------------------------------+
//| CHeatmapAggregator                                               |
//| Groups deal samples by symbol and hour, computing win rate and   |
//| edge ratio for each combination found.                           |
//+------------------------------------------------------------------+
class CHeatmapAggregator
  {
public:
                     CHeatmapAggregator(void);
                    ~CHeatmapAggregator(void);

   int                   Aggregate(const CDealSample &deals[], int count,
                                   CHeatmapCell &cells_out[]);
  };

//+------------------------------------------------------------------+
//| Constructor: no member state to initialize.                      |
//+------------------------------------------------------------------+
CHeatmapAggregator::CHeatmapAggregator(void)
  {
  }

//+------------------------------------------------------------------+
//| Destructor: no dynamic resources to release.                     |
//+------------------------------------------------------------------+
CHeatmapAggregator::~CHeatmapAggregator(void)
  {
  }
Aggregate() iterates over the deal samples and produces one CHeatmapCell per distinct symbol–hour pair found in the data. Instead of pre-allocating a sparse grid, the function grows the result array incrementally. For each deal, it searches for a matching symbol–hour cell. If found, it updates the cell; otherwise, it creates a new one. This keeps the output tight, a EURUSD/8am cell only exists if a EURUSD trade actually closed at 8am somewhere in the queried history.
//+-------------------------------------------------------------------+
//| Aggregate                                                         |
//+-------------------------------------------------------------------+
int CHeatmapAggregator::Aggregate(const CDealSample &deals[], int count,
                                  CHeatmapCell &cells_out[])
  {
   string symbols[];
   int    hours[];
   int    trade_count[];
   int    win_count[];
   double win_sum[];
   int    win_n[];
   double loss_sum[];
   int    loss_n[];
   ::ArrayResize(symbols, 0);
//--- group every deal into its (symbol, hour) cell, creating one if new
   for(int i = 0; i < count; i++)
     {
      int idx   = -1;
      int n     = ::ArraySize(symbols);
      for(int j = 0; j < n; j++)
        {
         if(symbols[j] == deals[i].symbol && hours[j] == deals[i].hour_utc)
           {
            idx = j;
            break;
           }
        }
      if(idx == -1)
        {
         ::ArrayResize(symbols,     n + 1);
         ::ArrayResize(hours,       n + 1);
         ::ArrayResize(trade_count, n + 1);
         ::ArrayResize(win_count,   n + 1);
         ::ArrayResize(win_sum,     n + 1);
         ::ArrayResize(win_n,       n + 1);
         ::ArrayResize(loss_sum,    n + 1);
         ::ArrayResize(loss_n,      n + 1);
         idx = n;
         symbols[idx]     = deals[i].symbol;
         hours[idx]       = deals[i].hour_utc;
         trade_count[idx] = 0;
         win_count[idx]   = 0;
         win_sum[idx]     = 0.0;
         win_n[idx]       = 0;
         loss_sum[idx]    = 0.0;
         loss_n[idx]      = 0;
        }
      trade_count[idx]++;
      //--- accumulate win and loss totals separately for the edge ratio calculation.
      //--- a trade that closed at exactly zero profit counts toward
      //--- trade_count above but is neither a win nor a loss, since
      //--- classifying it as a loss with a zero magnitude would let
      //--- loss_n become positive while loss_sum stays at 0.0, causing
      //--- a division by zero when the average loss is computed below
      if(deals[i].profit > 0.0)
        {
         win_count[idx]++;
         win_sum[idx] += deals[i].profit;
         win_n[idx]++;
        }
      else
         if(deals[i].profit < 0.0)
           {
            loss_sum[idx] += ::MathAbs(deals[i].profit);
            loss_n[idx]++;
           }
     }
//--- compute win rate and edge ratio for every cell found
   int cell_count = ::ArraySize(symbols);
   ::ArrayResize(cells_out, cell_count);
   for(int i = 0; i < cell_count; i++)
     {
      cells_out[i].symbol      = symbols[i];
      cells_out[i].hour        = hours[i];
      cells_out[i].trade_count = trade_count[i];
      cells_out[i].win_count   = win_count[i];
      cells_out[i].win_rate_percent =
         (trade_count[i] > 0) ? ((double)win_count[i] / (double)trade_count[i]) * 100.0 : 0.0;
      //--- a ratio only exists where the cell has both a win and a loss to compare
      bool has_rr = (win_n[i] > 0 && loss_n[i] > 0);
      cells_out[i].has_rr = has_rr;
      if(has_rr)
        {
         double avg_win  = win_sum[i]  / win_n[i];
         double avg_loss = loss_sum[i] / loss_n[i];
         cells_out[i].avg_rr = avg_win / avg_loss;
        }
      else
         cells_out[i].avg_rr = 0.0;
     }
   return(cell_count);
  }
Breakeven trades (profit = 0) are included in trade_count but excluded from both wins and losses. This is not an arbitrary choice. If a breakeven trade were classified as a loss with a magnitude of zero, it would inflate loss_n without adding anything to loss_sum, pulling avg_loss down and making the edge ratio look artificially stronger than the cell's real losing trades justify, the opposite problem from an artificially weak one. In the extreme case where every trade in a cell is a breakeven counted this way, loss_sum stays at exactly 0.0 while loss_n is still positive, giving avg_loss = 0.0 and triggering a division by zero the moment avg_win / avg_loss is computed. Keeping breakeven trades out of both the win and loss buckets sidesteps that failure mode entirely, while still letting them count toward the cell's overall trade volume, which is where they honestly belong.
Section 4: The Edge Ratio and the Red-Amber-Green Scale
The "edge ratio" this dashboard computes is the classic payoff ratio: the average size of a winning trade divided by the average size of a losing trade, in the same symbol-and-hour cell. It answers a question win rate alone cannot: a cell with a 40% win rate can still be profitable if its wins are, on average, twice the size of its losses, and a cell with a 70% win rate can still be a losing proposition if its rare losses are large enough to outweigh its frequent small wins.
| Term | Meaning | Formula |
|---|---|---|
| avg_win | average size of winning trades in the cell | Σ wins ÷ win count |
| avg_loss | average size of losing trades in the cell (absolute value) | Σ |losses| ÷ loss count |
| edge ratio | reward relative to risk in that cell | avg_win ÷ avg_loss |
An edge ratio above 1.0 means wins are, on average, larger than losses in that cell; below 1.0 means the opposite. It says nothing about how often each happens, which is exactly why the win rate heatmap and the edge ratio heatmap are shown side by side rather than combined into one number: a cell needs both a good win rate and a favorable edge ratio to be genuinely strong. This ratio is not the same thing as a strategy's statistical edge. A true edge requires both this ratio and the win rate together; a cell can have a favorable edge ratio and still lose money overall if its win rate is low enough, and vice versa.
Both heatmaps use the same three-stop color interpolation, just with different scale boundaries. A value at or below the low boundary renders as red, at the midpoint as amber, and at or above the high boundary as green, with every value in between blended smoothly:
| Metric | Low (red) | Mid (amber) | High (green) |
|---|---|---|---|
| Win rate | 0% | 50% | 100% |
| Edge ratio | 0.5 | 1.0 | 2.0 |
Section 5: CHeatmapChart — Rendering with CCanvas
One chart class draws both heatmaps, since the grid layout, the color scale, and the cell lookup logic are identical between them; only the metric being colored and its scale boundaries differ. Each instance is given its own object name in the constructor so a script can create two side-by-side panels without one overwriting the other.
//+------------------------------------------------------------------+
//|                                                 HeatmapChart.mqh |
//+------------------------------------------------------------------+
#ifndef HEATMAPCHART_MQH
#define HEATMAPCHART_MQH

#include <Canvas\Canvas.mqh>
#include "HeatmapTypes.mqh"

//+------------------------------------------------------------------+
//| CHeatmapChart                                                    |
//| Renders a symbol-by-hour grid, color-coded from red through      |
//| amber to green by either win rate or edge ratio, using a CCanvas |
//| panel.                                                           |
//+------------------------------------------------------------------+
class CHeatmapChart
  {
private:
   CCanvas               m_canvas;
   string                m_object_name;
   bool                  m_created;
   string                m_font_name;
   int                   m_font_size;
   uint                  m_font_flags;

   void                  CollectSymbols(const CHeatmapCell &cells[], int count,
                                        string &symbols_out[]) const;

public:
                     CHeatmapChart(string object_name);
                    ~CHeatmapChart(void);

   uint                  InterpolateColor(double value, double lo, double mid, double hi) const;
   bool                  Draw(const CHeatmapCell &cells[], int count, bool show_edge_ratio,
                              int hour_min, int hour_max, string title,
                              int x, int y, int width, int height);
   void                  Clear(void);
  };
The constructor takes the object name as a parameter rather than hardcoding it, since the main script needs two independent panels from the same class. InterpolateColor() is deliberately public rather than private: it is pure, self-contained math with no dependency on the canvas at all, which makes it directly testable, and the verification script does exactly that.
//+------------------------------------------------------------------+
//| Constructor: stores the caller-supplied object name so multiple  |
//| independent panels can be created from this class, fixes the     |
//| font used for both drawing and measuring text, and marks the     |
//| panel as not yet created.                                        |
//+------------------------------------------------------------------+
CHeatmapChart::CHeatmapChart(string object_name)
  {
   m_object_name = object_name;
   m_created     = false;
   m_font_name   = "Arial";
   m_font_size   = 11;
   m_font_flags  = FW_BOLD;
  }

//+------------------------------------------------------------------+
//| Destructor: intentionally does not remove the canvas panel. The  |
//| panel is a chart object owned by the chart itself, and must      |
//| remain visible after the CHeatmapChart instance that drew it     |
//| goes out of scope at the end of a script's OnStart.              |
//+------------------------------------------------------------------+
CHeatmapChart::~CHeatmapChart(void)
  {
  }

//+------------------------------------------------------------------+
//| InterpolateColor                                                 |
//| Maps a value onto a red-amber-green scale defined by a low, mid, |
//| and high boundary. Values at or below lo render pure red, at or  |
//| above hi render pure green, and everything in between blends     |
//| smoothly through amber at mid. Pure math, with no dependency on  |
//| the canvas, so it can be tested directly.                        |
//+------------------------------------------------------------------+
uint CHeatmapChart::InterpolateColor(double value, double lo, double mid, double hi) const
  {
   int low_r  = 210, low_g  = 60,  low_b  = 60;
   int mid_r  = 235, mid_g  = 200, mid_b  = 60;
   int high_r = 60,  high_g = 160, high_b = 90;
   double t;
   int r0, g0, b0, r1, g1, b1;
//--- pick which half of the scale the value falls in, then clamp the blend fraction
   if(value <= mid)
     {
      t = (value - lo) / (mid - lo);
      if(t < 0.0)
         t = 0.0;
      if(t > 1.0)
         t = 1.0;
      r0 = low_r;
      g0 = low_g;
      b0 = low_b;
      r1 = mid_r;
      g1 = mid_g;
      b1 = mid_b;
     }
   else
     {
      t = (value - mid) / (hi - mid);
      if(t < 0.0)
         t = 0.0;
      if(t > 1.0)
         t = 1.0;
      r0 = mid_r;
      g0 = mid_g;
      b0 = mid_b;
      r1 = high_r;
      g1 = high_g;
      b1 = high_b;
     }
   uchar r = (uchar)(r0 + t * (r1 - r0));
   uchar g = (uchar)(g0 + t * (g1 - g0));
   uchar b = (uchar)(b0 + t * (b1 - b0));
   return(::ColorToARGB((color)((b << 16) | (g << 8) | r), 255));
  }
Draw() collects the distinct symbols present in the cells to use as rows, always renders a fixed set of hour columns from hour_min to hour_max regardless of whether every hour has data, and looks up each row-and-column combination against the cell array. A combination with no trades, or with an undefined edge ratio, is drawn as a neutral gray cell with a dash rather than colored, so a trader never mistakes missing data for a genuinely bad result.
//+------------------------------------------------------------------+
//| Draw                                                             |
//+------------------------------------------------------------------+
bool CHeatmapChart::Draw(const CHeatmapCell &cells[], int count, bool show_edge_ratio,
                         int hour_min, int hour_max, string title,
                         int x, int y, int width, int height)
  {
   Clear();
   if(!m_canvas.CreateBitmapLabel(m_object_name, x, y, width, height, COLOR_FORMAT_ARGB_NORMALIZE))
     {
      ::Print("HeatmapDashboard: CreateBitmapLabel failed, error ", ::GetLastError());
      return(false);
     }
   m_created = true;
   m_canvas.FontSet(m_font_name, m_font_size, m_font_flags);
   ::TextSetFont(m_font_name, m_font_size, m_font_flags);
   m_canvas.Erase(::ColorToARGB(clrWhiteSmoke, 255));
   if(count < 1)
     {
      m_canvas.Update();
      return(true);
     }
//--- collect the distinct symbols to use as grid rows
   string symbols[];
   CollectSymbols(cells, count, symbols);
   int symbol_count = ::ArraySize(symbols);
   int hour_count   = (hour_max - hour_min) + 1;
   if(symbol_count < 1 || hour_count < 1)
     {
      m_canvas.Update();
      return(true);
     }
//--- lay out the title, column headers, row labels, and the grid itself
   int title_h      = m_font_size + 10;
   int header_h     = m_font_size + 8;
   int row_label_w  = 70;
   int grid_left    = row_label_w;
   int grid_top     = title_h + header_h;
   int grid_right   = width - 4;
   int grid_bottom  = height - 4;
   int cell_w = (grid_right - grid_left) / hour_count;
   int cell_h = (grid_bottom - grid_top) / symbol_count;
   if(cell_w < 1)
      cell_w = 1;
   if(cell_h < 1)
      cell_h = 1;
   m_canvas.TextOut(4, 2, title, ::ColorToARGB(clrBlack, 255));
//--- draw the hour column headers
   for(int h = 0; h < hour_count; h++)
     {
      string h_text = ::IntegerToString(hour_min + h);
      uint   tw = 0, th = 0;
      ::TextGetSize(h_text, tw, th);
      int cx = grid_left + h * cell_w + cell_w / 2;
      m_canvas.TextOut(cx - (int)tw / 2, title_h, h_text, ::ColorToARGB(clrBlack, 255));
     }
//--- draw one row per symbol, one cell per hour
   for(int s = 0; s < symbol_count; s++)
     {
      int ry = grid_top + s * cell_h;
      m_canvas.TextOut(4, ry + cell_h / 2 - m_font_size / 2, symbols[s], ::ColorToARGB(clrBlack, 255));
      for(int h = 0; h < hour_count; h++)
        {
         int hour = hour_min + h;
         int cx   = grid_left + h * cell_w;
         int cy   = ry;
         //--- find the cell matching this symbol and hour, if any
         int found_idx = -1;
         for(int c = 0; c < count; c++)
           {
            if(cells[c].symbol == symbols[s] && cells[c].hour == hour)
              {
               found_idx = c;
               break;
              }
           }
         bool   valid = false;
         double value = 0.0;
         string label = "-";
         if(found_idx >= 0)
           {
            if(!show_edge_ratio && cells[found_idx].trade_count > 0)
              {
               valid = true;
               value = cells[found_idx].win_rate_percent;
               label = ::DoubleToString(value, 0) + "%";
              }
            else
               if(show_edge_ratio && cells[found_idx].has_rr)
                 {
                  valid = true;
                  value = cells[found_idx].avg_rr;
                  label = ::DoubleToString(value, 2);
                 }
           }
         //--- color the cell by its metric, or gray it out if there is nothing to show
         uint fill_color;
         if(valid)
            fill_color = show_edge_ratio ? InterpolateColor(value, 0.5, 1.0, 2.0)
                         : InterpolateColor(value, 0.0, 50.0, 100.0);
         else
            fill_color = ::ColorToARGB(clrGainsboro, 255);
         m_canvas.FillRectangle(cx + 1, cy + 1, cx + cell_w - 1, cy + cell_h - 1, fill_color);
         uint lw = 0, lh = 0;
         ::TextGetSize(label, lw, lh);
         m_canvas.TextOut(cx + cell_w / 2 - (int)lw / 2, cy + cell_h / 2 - m_font_size / 2,
                          label, ::ColorToARGB(clrBlack, 255));
        }
     }
   m_canvas.Update();
   return(true);
  }
CollectSymbols() and Clear() handle two smaller, more mechanical jobs. CollectSymbols() builds a deduplicated list of every symbol present in the aggregated cells, using a straightforward linear scan, so the chart knows exactly which rows to draw before it starts laying out the grid. Clear() removes the canvas panel's bitmap when asked to, but is never called automatically from the class's destructor: the panel is a chart object that belongs to the chart itself, and it needs to stay visible on screen long after the object that drew it has gone out of scope.
//+------------------------------------------------------------------+
//| CollectSymbols                                                   |
//| Builds a list of every distinct symbol present in cells, used as |
//| the heatmap's row labels.                                        |
//+------------------------------------------------------------------+
void CHeatmapChart::CollectSymbols(const CHeatmapCell &cells[], int count,
                                   string &symbols_out[]) const
  {
   ::ArrayResize(symbols_out, 0);
   for(int i = 0; i < count; i++)
     {
      bool already_seen = false;
      int  n = ::ArraySize(symbols_out);
      for(int j = 0; j < n; j++)
        {
         if(symbols_out[j] == cells[i].symbol)
           {
            already_seen = true;
            break;
           }
        }
      if(!already_seen)
        {
         ::ArrayResize(symbols_out, n + 1);
         symbols_out[n] = cells[i].symbol;
        }
     }
  }

//+------------------------------------------------------------------+
//| Clear                                                            |
//| Removes the canvas panel from the chart if it was created.       |
//+------------------------------------------------------------------+
void CHeatmapChart::Clear(void)
  {
   if(!m_created)
      return;
   m_canvas.Destroy();
   m_created = false;
  }
Section 6: CHeatmapTablePrinter — Best and Worst Combinations
The heatmap shows every cell at once, but a trader who wants a short, actionable list needs the extremes called out directly: which symbol-and-hour combinations are the best and worst by win rate, filtered to cells with enough trades to be worth trusting. Ranking by win rate alone is a deliberate simplification. A cell can have a strong win rate and a poor edge ratio, or vice versa; a trader who wants a profitability-ranked list needs to weigh both figures together, which this printer does not do.
//+------------------------------------------------------------------+
//|                                          HeatmapTablePrinter.mqh |
//+------------------------------------------------------------------+
#ifndef HEATMAPTABLEPRINTER_MQH
#define HEATMAPTABLEPRINTER_MQH

#include "HeatmapTypes.mqh"

//+------------------------------------------------------------------+
//| CHeatmapTablePrinter                                             |
//| Prints the best and worst symbol-and-hour combinations by win    |
//| rate to the Experts tab, filtered to cells with a minimum        |
//| trade count.                                                     |
//+------------------------------------------------------------------+
class CHeatmapTablePrinter
  {
private:
   string                PadRight(string value, int width) const;
   void                  SortByWinRate(CHeatmapCell &cells[], int count) const;
   void                  PrintRow(const CHeatmapCell &cell) const;

public:
                     CHeatmapTablePrinter(void);
                    ~CHeatmapTablePrinter(void);

   void                  Print(const CHeatmapCell &cells_in[], int count,
                               int min_trades, int top_n) const;
  };

//+------------------------------------------------------------------+
//| Constructor: no member state to initialize.                      |
//+------------------------------------------------------------------+
CHeatmapTablePrinter::CHeatmapTablePrinter(void)
  {
  }

//+------------------------------------------------------------------+
//| Destructor: no dynamic resources to release.                     |
//+------------------------------------------------------------------+
CHeatmapTablePrinter::~CHeatmapTablePrinter(void)
  {
  }

//+------------------------------------------------------------------+
//| Print                                                            |
//| Filters cells to those with at least min_trades trades, sorts    |
//| the filtered copy by win rate descending, and prints the top and |
//| bottom top_n rows as the best and worst combinations.            |
//+------------------------------------------------------------------+
void CHeatmapTablePrinter::Print(const CHeatmapCell &cells_in[], int count,
                                 int min_trades, int top_n) const
  {
//--- keep only cells with enough trades to be worth trusting
   CHeatmapCell filtered[];
   ::ArrayResize(filtered, 0);
   for(int i = 0; i < count; i++)
     {
      if(cells_in[i].trade_count >= min_trades)
        {
         int n = ::ArraySize(filtered);
         ::ArrayResize(filtered, n + 1);
         filtered[n] = cells_in[i];
        }
     }
   int n = ::ArraySize(filtered);
   if(n == 0)
     {
      ::Print("HeatmapDashboard: no symbol/hour cell has at least ", min_trades, " trades");
      return;
     }
   SortByWinRate(filtered, n);
   string header = PadRight("Symbol", 12) + PadRight("Hour", 8) + PadRight("Trades", 10) +
                   PadRight("Win Rate", 12) + PadRight("Edge Ratio", 10);
//--- print the best combinations from the top of the sorted list
   int best_shown = (n < top_n) ? n : top_n;
   ::Print("Best symbol/hour combinations:");
   ::Print(header);
   for(int i = 0; i < best_shown; i++)
      PrintRow(filtered[i]);
//--- print the worst combinations from whatever remains below the best list,
//--- so a small filtered set never shows the same cell in both tables
   int remaining   = n - best_shown;
   int worst_shown = (remaining < top_n) ? remaining : top_n;
   ::Print("Worst symbol/hour combinations:");
   if(worst_shown <= 0)
      ::Print("(none remaining; fewer than ", 2 * top_n, " cells met the minimum trade count)");
   else
     {
      ::Print(header);
      for(int i = 0; i < worst_shown; i++)
         PrintRow(filtered[n - 1 - i]);
     }
  }
SortByWinRate() sorts cells into descending order by win rate using a simple bubble sort.
//+------------------------------------------------------------------+
//| SortByWinRate                                                    |
//+------------------------------------------------------------------+
void CHeatmapTablePrinter::SortByWinRate(CHeatmapCell &cells[], int count) const
  {
   CHeatmapCell temp;
   for(int i = 0; i < count - 1; i++)
     {
      for(int j = 0; j < count - 1 - i; j++)
        {
         if(cells[j].win_rate_percent < cells[j + 1].win_rate_percent)
           {
            temp         = cells[j];
            cells[j]     = cells[j + 1];
            cells[j + 1] = temp;
           }
        }
     }
  }
PrintRow() prints one fixed-width row for a single cell, showing "N/A" for the edge ratio column when the ratio is undefined for that cell.
//+------------------------------------------------------------------+
//| PrintRow                                                         |
//+------------------------------------------------------------------+
void CHeatmapTablePrinter::PrintRow(const CHeatmapCell &cell) const
  {
   string rr_text = cell.has_rr ? ::DoubleToString(cell.avg_rr, 2) : "N/A";
   string row = PadRight(cell.symbol, 12) + PadRight(::IntegerToString(cell.hour), 8) +
                PadRight(::IntegerToString(cell.trade_count), 10) +
                PadRight(::DoubleToString(cell.win_rate_percent, 1) + "%", 12) +
                PadRight(rr_text, 10);
   ::Print(row);
  }
PadRight() pads a string with trailing spaces up to the given width, or returns the original string unchanged if it already meets or exceeds that width.
//+------------------------------------------------------------------+
//| PadRight                                                         |
//+------------------------------------------------------------------+
string CHeatmapTablePrinter::PadRight(string value, int width) const
  {
   int need = width - ::StringLen(value);
   if(need <= 0)
      return(value);
   string result = value;
   for(int i = 0; i < need; i++)
      result += " ";
   return(result);
  }
Section 7: HeatmapDashboard.mq5 — Assembling the Main Script
The main script's inputs cover the lookback window, the minimum trade count a cell needs before it is trusted in the best/worst table, how many rows that table shows, and the position and size of both canvas panels.
//+------------------------------------------------------------------+
//|                                             HeatmapDashboard.mq5 |
//+------------------------------------------------------------------+
#property script_show_inputs

#include <HeatmapDashboard/HeatmapTypes.mqh>
#include <HeatmapDashboard/DealSampleExtractor.mqh>
#include <HeatmapDashboard/HeatmapAggregator.mqh>
#include <HeatmapDashboard/HeatmapChart.mqh>
#include <HeatmapDashboard/HeatmapTablePrinter.mqh>

input int InpLookbackDays     = 90;    // Number of days to look back from now
input int InpMinTradesPerCell = 3;     // Minimum trades before a cell counts toward best/worst
input int InpTopN             = 5;     // Number of best and worst rows to print
input int InpWinRatePanelX    = 20;    // Win rate heatmap X coordinate
input int InpWinRatePanelY    = 20;    // Win rate heatmap Y coordinate
input int InpEdgeRatioPanelX  = 20;    // Edge ratio heatmap X coordinate
input int InpEdgeRatioPanelY  = 260;   // Edge ratio heatmap Y coordinate
input int InpPanelWidth       = 640;   // Panel width in pixels
input int InpPanelHeight      = 220;   // Panel height in pixels
OnStart() extracts every closed deal, aggregates them into the symbol-and-hour grid, renders both heatmaps stacked vertically, and prints the best-and-worst table.
//+------------------------------------------------------------------+
//| OnStart                                                          |
//+------------------------------------------------------------------+
void OnStart(void)
  {
//--- resolve the date range from the lookback input
   datetime to_time   = ::TimeCurrent();
   datetime from_time = to_time - (InpLookbackDays * 86400);
//--- extract every closed deal's symbol, close hour, and net profit
   CDealSampleExtractor extractor;
   CDealSample          deals[];
   int                  deal_count = extractor.Read(from_time, to_time, deals);
   ::Print("HeatmapDashboard: extracted ", deal_count, " closed deals");
   if(deal_count < 1)
     {
      ::Print("HeatmapDashboard: no closed deals found in the selected range");
      return;
     }
//--- aggregate deals into a symbol-and-hour grid of win rate and edge ratio
   CHeatmapAggregator aggregator;
   CHeatmapCell        cells[];
   int                 cell_count = aggregator.Aggregate(deals, deal_count, cells);
   ::Print("HeatmapDashboard: aggregated ", cell_count, " symbol/hour cells");
//--- render the win rate heatmap
   CHeatmapChart win_rate_chart("WinRateHeatmapPanel");
   if(!win_rate_chart.Draw(cells, cell_count, false, 0, 23, "Win rate by symbol and hour",
                           InpWinRatePanelX, InpWinRatePanelY, InpPanelWidth, InpPanelHeight))
      ::Print("HeatmapDashboard: win rate heatmap could not be rendered");
//--- render the edge ratio heatmap
   CHeatmapChart edge_ratio_chart("EdgeRatioHeatmapPanel");
   if(!edge_ratio_chart.Draw(cells, cell_count, true, 0, 23, "Edge ratio by symbol and hour",
                             InpEdgeRatioPanelX, InpEdgeRatioPanelY, InpPanelWidth, InpPanelHeight))
      ::Print("HeatmapDashboard: edge ratio heatmap could not be rendered");
//--- print the best and worst symbol/hour combinations to the Experts tab
   CHeatmapTablePrinter printer;
   printer.Print(cells, cell_count, InpMinTradesPerCell, InpTopN);
  }
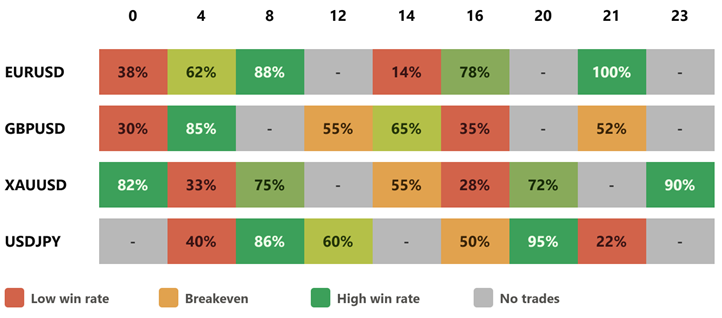
Win rate by symbol and hour. Each cell is shaded red through amber to green by win rate, with bold percentages inside and a gray dash marking any symbol-and-hour combination with no trades.
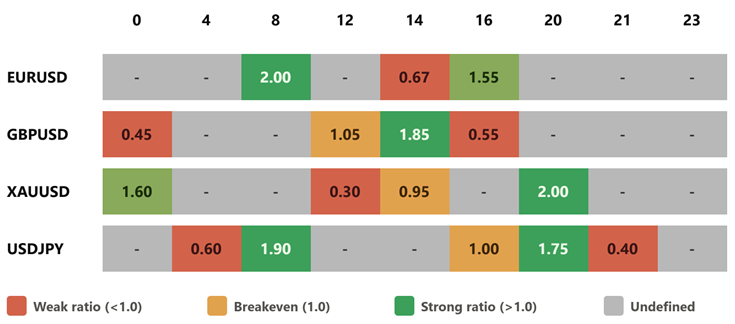
Edge ratio by symbol and hour. Each cell is shaded red through amber to green by edge ratio, with bold values inside and a gray dash marking any cell where the ratio is undefined (all wins or all losses, with nothing to compare).
Section 8: Verification — TestHeatmapAnalytics.mq5
The verification script builds a fixed synthetic set of 22 deals across four symbol-and-hour combinations: a high win rate with a strong edge ratio, a low win rate with a weak edge ratio, an all-losses cell, and an all-wins cell, then checks the aggregator's output and the color interpolation formula against numbers worked out by hand.
//+------------------------------------------------------------------+
//|                                         TestHeatmapAnalytics.mq5 |
//+------------------------------------------------------------------+

#include <HeatmapDashboard/HeatmapTypes.mqh>
#include <HeatmapDashboard/HeatmapAggregator.mqh>
#include <HeatmapDashboard/HeatmapChart.mqh>

#define ASSERT(condition, message) TestAssert((condition), (message))

int g_pass_count = 0;
int g_fail_count = 0;

//+------------------------------------------------------------------+
//| TestAssert                                                       |
//| Prints a pass or fail message for a single test condition and    |
//| tracks the running pass and fail counts.                         |
//+------------------------------------------------------------------+
void TestAssert(bool condition, string message)
  {
   if(condition)
     {
      g_pass_count++;
      ::Print("PASS: ", message);
     }
   else
     {
      g_fail_count++;
      ::Print("FAIL: ", message);
     }
  }

//+------------------------------------------------------------------+
//| FindCellIndex                                                    |
//| Searches cells for the entry matching the given symbol and hour, |
//| used only to locate results in this test script.                 |
//+------------------------------------------------------------------+
int FindCellIndex(const CHeatmapCell &cells[], int count, string symbol, int hour)
  {
   for(int i = 0; i < count; i++)
     {
      if(cells[i].symbol == symbol && cells[i].hour == hour)
         return(i);
     }
   return(-1);
  }

//+------------------------------------------------------------------+
//| OnStart                                                          |
//| Builds a synthetic set of 22 deals across four symbol/hour       |
//| combinations, then checks the aggregator's win rate and edge     |
//| ratio output, and the color interpolation formula, against       |
//| hand-worked values.                                              |
//+------------------------------------------------------------------+
void OnStart(void)
  {
//--- build the 22 synthetic deals: EURUSD/8 (10 trades), EURUSD/14 (5 trades),
//--- GBPUSD/8 (4 all-loss trades), GBPUSD/20 (3 all-win trades)
   CDealSample deals[22];
   int idx = 0;
   for(int i = 0; i < 7; i++)
     {
      deals[idx].symbol = "EURUSD";
      deals[idx].hour_utc = 8;
      deals[idx].profit = 100.0;
      idx++;
     }
   for(int i = 0; i < 3; i++)
     {
      deals[idx].symbol = "EURUSD";
      deals[idx].hour_utc = 8;
      deals[idx].profit = -50.0;
      idx++;
     }
   deals[idx].symbol = "EURUSD";
   deals[idx].hour_utc = 14;
   deals[idx].profit = 40.0;
   idx++;
   for(int i = 0; i < 4; i++)
     {
      deals[idx].symbol = "EURUSD";
      deals[idx].hour_utc = 14;
      deals[idx].profit = -60.0;
      idx++;
     }
   double gbp8[4] = {-20.0, -30.0, -10.0, -15.0};
   for(int i = 0; i < 4; i++)
     {
      deals[idx].symbol = "GBPUSD";
      deals[idx].hour_utc = 8;
      deals[idx].profit = gbp8[i];
      idx++;
     }
   double gbp20[3] = {25.0, 35.0, 15.0};
   for(int i = 0; i < 3; i++)
     {
      deals[idx].symbol = "GBPUSD";
      deals[idx].hour_utc = 20;
      deals[idx].profit = gbp20[i];
      idx++;
     }
//--- aggregate the synthetic deals
   CHeatmapAggregator aggregator;
   CHeatmapCell        cells[];
   int cell_count = aggregator.Aggregate(deals, 22, cells);
//--- test 1: exactly four symbol/hour cells should be produced
   ASSERT(cell_count == 4, "four symbol/hour cells are produced from the synthetic deals");
//--- tests 2-5: EURUSD hour 8, a strong high-win-rate, high edge ratio cell
   int i1 = FindCellIndex(cells, cell_count, "EURUSD", 8);
   ASSERT(i1 >= 0, "EURUSD hour 8 cell exists");
   ASSERT(cells[i1].trade_count == 10 && cells[i1].win_count == 7,
          "EURUSD hour 8 has 10 trades and 7 wins");
   ASSERT(::MathAbs(cells[i1].win_rate_percent - 70.0) < 0.001,
          "EURUSD hour 8 win rate computes to 70.0%");
   ASSERT(cells[i1].has_rr && ::MathAbs(cells[i1].avg_rr - 2.0) < 0.001,
          "EURUSD hour 8 edge ratio computes to 2.0");
//--- tests 6-8: EURUSD hour 14, a weak low-win-rate, low edge ratio cell
   int i2 = FindCellIndex(cells, cell_count, "EURUSD", 14);
   ASSERT(i2 >= 0, "EURUSD hour 14 cell exists");
   ASSERT(::MathAbs(cells[i2].win_rate_percent - 20.0) < 0.001,
          "EURUSD hour 14 win rate computes to 20.0%");
   ASSERT(cells[i2].has_rr && ::MathAbs(cells[i2].avg_rr - 0.666667) < 0.001,
          "EURUSD hour 14 edge ratio computes to about 0.6667");
//--- tests 9-10: GBPUSD hour 8, all losses, edge ratio correctly undefined
   int i3 = FindCellIndex(cells, cell_count, "GBPUSD", 8);
   ASSERT(i3 >= 0 && cells[i3].win_count == 0, "GBPUSD hour 8 has zero wins");
   ASSERT(!cells[i3].has_rr, "GBPUSD hour 8 edge ratio is correctly undefined with zero wins");
//--- tests 11-12: GBPUSD hour 20, all wins, edge ratio correctly undefined
   int i4 = FindCellIndex(cells, cell_count, "GBPUSD", 20);
   ASSERT(i4 >= 0 && ::MathAbs(cells[i4].win_rate_percent - 100.0) < 0.001,
          "GBPUSD hour 20 win rate computes to 100.0%");
   ASSERT(!cells[i4].has_rr, "GBPUSD hour 20 edge ratio is correctly undefined with zero losses");
//--- tests 13-14: the color interpolation formula matches its endpoints exactly
   CHeatmapChart chart("TestHeatmapPanel");
   uint c_low  = chart.InterpolateColor(0.0,   0.0, 50.0, 100.0);
   uint c_high = chart.InterpolateColor(100.0, 0.0, 50.0, 100.0);
   int  low_r  = (int)((c_low  >> 16) & 0xFF);
   int  low_g  = (int)((c_low  >> 8)  & 0xFF);
   int  low_b  = (int)(c_low   & 0xFF);
   int  high_r = (int)((c_high >> 16) & 0xFF);
   int  high_g = (int)((c_high >> 8)  & 0xFF);
   int  high_b = (int)(c_high  & 0xFF);
   ASSERT(low_r == 210 && low_g == 60 && low_b == 60,
          "interpolated color at the low end matches the red endpoint exactly");
   ASSERT(high_r == 60 && high_g == 160 && high_b == 90,
          "interpolated color at the high end matches the green endpoint exactly");
//--- print the final summary of pass and fail counts
   ::Print("TestHeatmapAnalytics: ", g_pass_count, " passed, ", g_fail_count, " failed");
  }
//+------------------------------------------------------------------+
Section 9: Extending the Dashboard
A trader who wants to compare weekdays as well as hours could extend CDealSample and CHeatmapAggregator with a day-of-week dimension, producing a three-way breakdown rather than the current two-way one, at the cost of a heatmap that no longer fits neatly on a single flat grid.
A natural next step for this aggregator would be filtering the deal extraction down to a single symbol at a time. As it stands, every symbol a trader has ever touched gets its own row in the same panel, which is fine for a broad overview but can get crowded fast. Narrowing the extraction to one instrument would let a trader zoom into that symbol's hourly pattern on its own, without a dozen other rows competing for the same space.
Exporting the cell grid to CSV would let a trader analyze the pattern further in a spreadsheet, using the same FileOpen(), FileWrite(), FileClose() pattern used throughout this series.
A configurable color scale would let a trader tune what counts as "good" for their own strategy; a scalper's acceptable win rate range looks nothing like a swing trader's, and the fixed 0/50/100 and 0.5/1.0/2.0 boundaries used here are a reasonable default, not a universal one.
Section 10: Limitations
Every cell's win rate and edge ratio come from whatever trades happen to fall in that bucket, with no minimum sample size enforced anywhere in this dashboard except the best/worst table, which respects InpMinTradesPerCell. The heatmap panels themselves color every cell they have data for, so a cell with one lucky win renders the same bright green as a cell with a hundred consistent wins; a standout cell is worth checking against its trade count in the Experts tab before being trusted.
The edge ratio is undefined, not zero, for any cell with only wins or only losses, shown as a gray dash rather than a misleading number. There is no mathematically honest single value to substitute there.
Both Aggregate() and Draw() locate cells with a linear scan rather than an indexed lookup. This is fine at the scale this dashboard targets, a handful of symbols across 24 hours, but would not scale gracefully to a much larger deal history.
Hour-of-day is read directly from each deal's own timestamp and treated as UTC without conversion or verification. Most brokers report deal times in their own server time, which commonly differs from UTC by an offset that can itself shift with daylight saving. The field name hour_utc reflects this assumption, not a guarantee; a trader who thinks in broker-local hours needs to shift the bucketing themselves.
The color scale's boundaries (0/50/100 for win rate, 0.5/1.0/2.0 for edge ratio) are fixed defaults, not derived from the account's own distribution. A strategy whose typical win rate hovers around 35% would see most cells rendered red even when some are its best relative performers.
A breakeven trade counts toward a cell's trade total but is excluded from both sides of the edge ratio. This is deliberate: counting it as a zero-value loss would shrink avg_loss and make the ratio look artificially stronger, not weaker, and a cell made entirely of such trades would divide by zero the moment the ratio is computed.
This dashboard blends every strategy and order type on the account, with no concept of Magic Number or manual versus automated trades, so several independent systems running on one account will appear merged into the same cells.
Net profit is profit + swap + commission. Any additional cost a broker reports separately, such as a distinct fee field, is not included.
This dashboard measures deals (DEAL_ENTRY_OUT and DEAL_ENTRY_INOUT), not completed positions. A position closed through several partial fills becomes several separate deals here, each counted independently, which can distort both win rate and edge ratio relative to a one-position definition of "trade."
Heatmap rows appear in the order their symbol was first encountered in the deal history, not sorted alphabetically or by performance, so row order is not reproducible across runs covering different date ranges.
The row label column is a fixed 70 pixels wide and can visually crowd a long CFD or futures ticker.
None of InpLookbackDays, InpTopN, InpMinTradesPerCell, or the panel coordinate and size inputs are validated; a negative or nonsensical value produces undefined or visually broken output rather than a clear error.
The verification script checks cell grouping, win rate, edge ratio, the two undefined-ratio cases, and the color interpolation formula. It does not test Read()'s own history-reading logic, partial closes, time zone assumptions, or the chart's rendering output directly.
CHeatmapChart's destructor is intentionally empty so its panel survives after the object goes out of scope. This relies on the underlying CCanvas member not independently removing the chart object on its own destruction, a property of CCanvas's behavior rather than something this code enforces directly.
Conclusion
We designed and implemented a win rate and edge ratio heatmap dashboard driven by two primary data structs, a historical deal extractor, and a two-dimensional aggregator. The visual engine uses a single CCanvas renderer with a red-amber-green (RAG) color interpolation algorithm to plot both performance metrics dynamically, while a parallel logging routine outputs top and bottom symbol-hour combinations to the Experts tab. Finally, a dedicated verification script validated the underlying math against manual benchmarks—confirming that the all-loss and all-win boundary cases are correctly flagged as undefined (has_rr = false) rather than defaulting to a misleading ratio and verifying exact endpoint accuracy for the color interpolation formula.
Evaluating performance by symbol and time reveals edges that account-level statistics can hide. However, the current implementation intentionally leaves out statistical sample-size weighting, broker-local time zone offsets, and dynamic color scaling relative to account distribution. For trading systems that require low-sample filtering, custom time alignment, or auto-normalized color scales, Section 9 outlines the general direction for each of these, though implementing any of them requires working out the specific interface and data changes yourself to adapt the framework.
Programs used in the article:
| # | Name | Type | Description |
|---|---|---|---|
| 1 | HeatmapTypes.mqh | Include File | Defines the CDealSample and CHeatmapCell structs |
| 2 | DealSampleExtractor.mqh | Include File | CDealSampleExtractor class: reads closed deals and reduces each to symbol, hour, and profit |
| 3 | HeatmapAggregator.mqh | Include File | CHeatmapAggregator class: groups deals by symbol and hour, computing win rate and edge ratio |
| 4 | HeatmapChart.mqh | Include File | CHeatmapChart class: renders either heatmap on a shared red-amber-green scale via CCanvas |
| 5 | HeatmapTablePrinter.mqh | Include File | CHeatmapTablePrinter class: prints the best and worst symbol/hour combinations to the Experts tab |
| 6 | HeatmapDashboard.mq5 | Script | Main script: wires all components, extracts deals, aggregates, and renders both heatmaps |
| 7 | TestHeatmapAnalytics.mq5 | Script | Verification script covering cell grouping, win rate, edge ratio, and the color interpolation formula |
| 8 | HeatmapDashboard.zip | Zip Archive | Zip archive containing all the attached files and their paths relative to the terminal's root folder. |
Warning: All rights to these materials are reserved by MetaQuotes Ltd. Copying or reprinting of these materials in whole or in part is prohibited.
This article was written by a user of the site and reflects their personal views. MetaQuotes Ltd is not responsible for the accuracy of the information presented, nor for any consequences resulting from the use of the solutions, strategies or recommendations described.

 Graph Theory: Study of Graphs Generated by Some Random Process
 Neural Networks in Trading: Robust Trading Signals in Any Market Regime (Attention Modules)
 Markov Chains in Trading and Price Forecasting
 Building a Divergence System (Part IV): Creating a Reusable Divergence Engine for MQL5

- Free trading apps
- Over 8,000 signals for copying
- Economic news for exploring financial markets
You agree to website policy and terms of use