

Measuring broker execution quality in MQL5: Why your live account doesn't match the backtest
 2 122
2 122
 0
0

Introduction
If you code in MQL5, you have probably lived this: the Strategy Tester draws a beautiful, almost straight equity curve, and when you put the same Expert Advisor (EA) on a real account, the result is very different. I have hit that wall more than once. My first instinct used to be to blame the strategy — but very often the strategy is fine. What changed is the execution quality.
The Strategy Tester lives in an ideal world: it fills orders at (or near) the requested price, with a modeled spread and—unless configured otherwise—no delays or rejections. A live account is a different animal: the price moves between the moment you send the order and the moment it is filled, the spread widens exactly when it matters, and every now and then you get a requote, a price change, or a rejection. That friction has names: slippage, spread and requotes.
In this article I build a diagnostic tool—not a strategy—that captures execution metrics on your account. It helps answer one question with numbers: "Is my live result falling short because of the strategy, or because of execution?" The tool is an EA called Execution Quality Monitor.
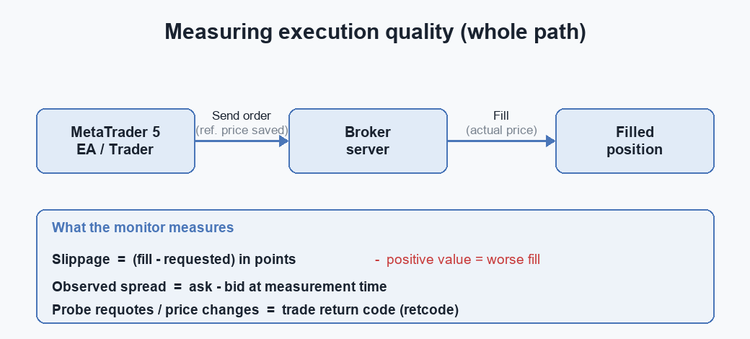
This tool does not measure the broker in isolation. It measures the entire execution path (terminal/PC/VPS, network, broker gateway, venue liquidity), so poor results can come from any link. There is a dedicated section on this later; keep it in mind throughout.
Important: this tool opens and closes real trades when you use its probe button. Run it on a demo account or with the minimum lot.
What execution quality really is
Before measuring, let me define the concepts that matter.
- Slippage. The difference between the price you expected and the price your order was actually filled at. If you wanted to buy at the ask and you were filled higher, that excess is slippage against you. Same when you sell below the bid. I measure it in points (the symbol's smallest unit) and, by convention in this tool, positive slippage means a worse fill.
- Observed spread. The bid-ask spread at the moment of measurement, in points. A quick note on terminology: in market-microstructure literature "effective spread" has a precise meaning (execution cost relative to the mid-price, often round-trip). I am not using it in that strict sense. Here it is simply the quoted spread observed at measurement time, which is enough to spot when the broker widens the spread exactly when you trade — for example during news or session changes.
- Requotes and price changes. When the price moved between your request and the execution, the server can reject the order (requote) or fill it at a different price (price changed). Each of these is friction the backtest never sees. As you will see, this tool can only count these for its own active probes (it gets the return code of its own trade calls); it cannot reconstruct them for trades it merely observes.
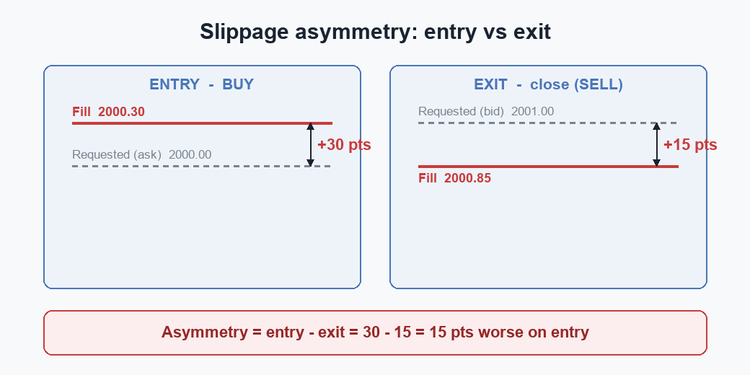
- Slippage asymmetry. This is the detail most people ignore and the one that hurts the most: is slippage even between entries and exits, or are you systematically filled worse on one side? A path that fills you worse on entries than on exits eats the edge of any scalping strategy. That is why I measure entries and exits separately.
Let me make it concrete. Say the XAUUSD ask is 2000.00 when you send a buy, and you are filled at 2000.30. That is 30 points of entry slippage against you (with a 2-digit symbol, point = 0.01). If you then close and the bid was 2001.00 but you are filled at 2000.85, that is 15 points of exit slippage. The asymmetry is 30 − 15 = 15 points worse on entry. For a strategy that aims at 100 points per trade, that asymmetric cost is huge, and it appears in no standard backtest.
MetaTrader 5 execution modes and why they matter
Not all brokers fill the same way, and the execution type decides which friction you will see. MetaTrader 5 handles three main modes:
- Instant Execution: the broker shows you a price and you ask to be filled at that exact price. If the price changed, the server answers with a requote. This is where you will see the most requotes and rejections.
- Market Execution: you send the order and the broker fills it at the best available price. There is typically no requote at the request stage, but you can still get slippage — the fill price is whatever liquidity is there at that instant, so a thin book can move it against you.
- Exchange Execution: the order goes to a centralized market (typical for stocks/futures), and the behavior depends on the order book.
Many modern forex accounts are Market Execution, where slippage tends to matter more than requotes — but this is a tendency, not a rule, and Instant accounts are still common, where requotes can be as damaging as slippage for high-frequency EAs. You can check your symbol's mode with SymbolInfoInteger(_Symbol, SYMBOL_TRADE_EXEMODE) if you want to adapt.
The approach: a diagnostic, not a filter
MQL5 already has tools that estimate market conditions in real time to decide whether to trade (microstructure filters). What I want here is different: instead of filtering, I want to measure and report what actually happened to your orders, so you can diagnose with data.
The EA works in two complementary ways, and it is important to understand that they do not measure the same thing with the same precision:
- Active mode (probe), precise-ish: a button fires a round-trip test trade with the minimum lot. It records the reference quote right before sending the order and compares it with the actual fill, so this is the closest thing to a true request-to-fill measurement. It also times the round trip and reads the return code (requote/price change) of its own calls.
- Passive mode, approximate: it listens to every deal on the account through the OnTradeTransaction event and compares the fill with the quote observed when the event is handled. This is an approximation, not a request-to-fill measurement: the event arrives after the trade, and the tick you read at that moment is not guaranteed to be the quote that existed at the instant of execution. On a fast market the two can differ. Treat passive numbers as a useful estimate of realized fill quality, not as exact slippage.
Because they are not equivalent, the panel reports probe and passive results separately. A couple more honest notes:
- The statistics are deal-based, not order-based. One order that fills in several parts becomes several samples; the tool does not reassemble order-level intent.
- Everything is measured on the chart's symbol. To monitor several symbols, attach one instance per symbol chart.
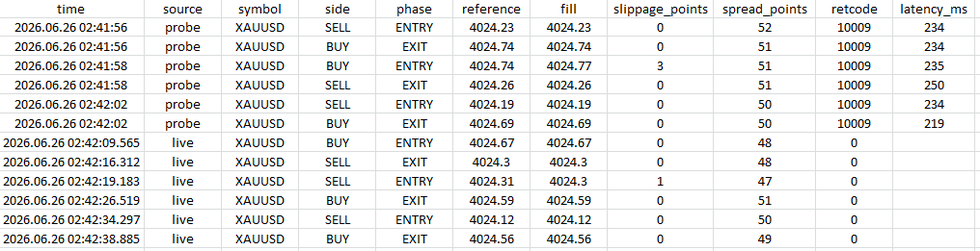
Both modes feed the on-chart panel and write every sample to a CSV file for later analysis.
Let's start with the declaration. We include the standard trading library for the active mode, define the inputs, and the global arrays that accumulate the samples — note that we keep every sample, not just running sums, so we can later report the median and the 95th percentile, not only the mean.
#include <Trade/Trade.mqh>
CTrade trade;

//--- probe side selection
enum ENUM_PROBE_SIDE
  {
   PROBE_ALTERNATE = 0,                                        // Alternate BUY / SELL on each probe
   PROBE_BUY       = 1,                                        // Always BUY
   PROBE_SELL      = 2                                         // Always SELL
  };

//--- input parameters
input double          InpProbeLot    = 0.0;                    // Probe lot (0 = symbol minimum, normalized to step)
input ENUM_PROBE_SIDE InpProbeSide   = PROBE_ALTERNATE;        // Probe direction
input bool            InpEnableProbe = true;                   // Show the manual 'Probe' button
input long            InpMagicFilter = 0;                      // Monitor only this magic (0 = all live deals)
input bool            InpWriteCsv    = true;                   // Write each sample to a CSV file
input string          InpCsvName     = "ExecutionQuality.csv"; // CSV file name (MQL5\Files)
input int             InpFontSize    = 12;                     // Panel font size
input color           InpTextColor   = clrGainsboro;           // Panel text color

//--- constants
#define PROBE_MAGIC 990011
#define MAX_LABELS  20

//--- samples (kept so we can report median / p95, not just the mean)
double   g_pEntry[];                                           // PROBE entry slippage (precise: requested-before-send vs fill)
double   g_pExit[];                                            // PROBE exit slippage
double   g_aEntry[];                                           // PASSIVE entry deviation (approx: fill vs quote at event time)
double   g_aExit[];                                            // PASSIVE exit deviation
double   g_spread[];                                           // observed bid-ask spread snapshots
double   g_lat[];                                              // PROBE per-leg latency (send -> result, ms)
int      g_nReqProbe = 0;                                      // requotes / price changes seen by our own probes only

bool     g_nextProbeBuy = true;                                // for PROBE_ALTERNATE
string   g_btnName = "EQM_ProbeButton";
int      g_csvHandle = INVALID_HANDLE;
The four slippage arrays are split on purpose: g_pEntry/g_pExit hold the precise probe measurements, while g_aEntry/g_aExit hold the approximate passive ones. We never mix them. PROBE_MAGIC tags our own test trades so the passive handler skips them (otherwise we would count each probe twice).
Initialization: OnInit and OnDeinitOn initialization we create the button, open the CSV file and draw the panel for the first time. On deinitialization we release everything cleanly.
//+------------------------------------------------------------------+
//| Expert initialization function                                   |
//+------------------------------------------------------------------+
int OnInit()
  {
   if(InpEnableProbe)
      CreateButton();

   if(InpWriteCsv)
      OpenCsv();

   UpdatePanel();
   Print("ExecutionQualityMonitor started. Run it on a DEMO or with the minimum lot. ",
         "Probe = precise round-trip; passive = approximate fill-vs-quote on live deals.");
   return(INIT_SUCCEEDED);
  }
//+------------------------------------------------------------------+
//| Expert deinitialization function                                 |
//+------------------------------------------------------------------+
void OnDeinit(const int reason)
  {
   if(g_csvHandle != INVALID_HANDLE)
      FileClose(g_csvHandle);
   ObjectDelete(0, g_btnName);
   DeletePanel();
   Comment("");
  }
Passive measurement: OnTradeTransaction
The passive mode lives in the OnTradeTransaction handler. Every time a deal is added to the account, we read its fill price and compare it with the quote we observe at that instant. Read the comments carefully — this is exactly where the "approximate, not exact" caveat lives.
//+------------------------------------------------------------------+
//| Trade transaction handler - passively approximates live fills    |
//+------------------------------------------------------------------+
void OnTradeTransaction(const MqlTradeTransaction &trans,
                        const MqlTradeRequest &request,
                        const MqlTradeResult &result)
  {
   if(trans.type != TRADE_TRANSACTION_DEAL_ADD)
      return;
   if(!HistoryDealSelect(trans.deal))
      return;
   if(HistoryDealGetString(trans.deal, DEAL_SYMBOL) != _Symbol)
      return;

   long magic = HistoryDealGetInteger(trans.deal, DEAL_MAGIC);
   if(magic == PROBE_MAGIC)                       // our own probes are measured in RunProbe()
      return;
   if(InpMagicFilter != 0 && magic != InpMagicFilter)
      return;

   long dtype = HistoryDealGetInteger(trans.deal, DEAL_TYPE);
   if(dtype != DEAL_TYPE_BUY && dtype != DEAL_TYPE_SELL)
      return;

//--- classify entry vs exit explicitly (do NOT assume "anything else is a close")
   long entry = HistoryDealGetInteger(trans.deal, DEAL_ENTRY);
   bool isEntry;
   if(entry == DEAL_ENTRY_IN)
      isEntry = true;
   else
      if(entry == DEAL_ENTRY_OUT || entry == DEAL_ENTRY_OUT_BY)
         isEntry = false;
      else
         return;                                     // DEAL_ENTRY_INOUT (reversal): can't attribute cleanly, skip

   MqlTick tk;
   if(!SymbolInfoTick(_Symbol, tk))
      return;

   bool   isBuy     = (dtype == DEAL_TYPE_BUY);
   double quoteNow  = isBuy ? tk.ask : tk.bid;    // observed quote when this event is handled
   double fill      = HistoryDealGetDouble(trans.deal, DEAL_PRICE);
   double spreadPt  = (tk.ask - tk.bid) / _Point;

//--- use the deal's own execution time, not TimeCurrent()
   long   msc       = HistoryDealGetInteger(trans.deal, DEAL_TIME_MSC);
   string tstamp    = TimeToString((datetime)(msc / 1000), TIME_DATE | TIME_SECONDS)
                      + StringFormat(".%03d", (int)(msc % 1000));

   RecordSample("live", tstamp, isBuy, isEntry, quoteNow, fill, 0, spreadPt, -1.0);
  }
Four details that matter, three of which directly address the precision of the measurement:
- We only care about deals of type DEAL_TYPE_BUY and DEAL_TYPE_SELL; we ignore balance, credit, and so on.
- Entry vs exit is classified explicitly. DEAL_ENTRY_IN is an entry; DEAL_ENTRY_OUT and DEAL_ENTRY_OUT_BY are exits; DEAL_ENTRY_INOUT (a reversal that closes and opens in one deal) is skipped, because its fill can't be attributed cleanly to a single side. The naive shortcut "anything that isn't IN is a close" would mis-bucket reversals and OUT_BY operations.
- The reference is the quote observed when the event is handled, not the price at the instant of execution. OnTradeTransaction fires after the trade, and SymbolInfoTick returns the current local tick, which on a fast market may already differ from the quote at fill time. That is why this is an approximation, and why the precise number comes from the probe.
- We timestamp with the deal's own execution time (DEAL_TIME_MSC), not TimeCurrent(), so per-hour analysis in the CSV is not skewed by event-handling delay. We also skip our own probes (PROBE_MAGIC) and, optionally, filter by magic.
The probe opens and closes a real position, so before doing anything we have to make sure it is safe — this is the single most important correctness point in the tool. The probe closes its own position by ticket, and it refuses to run if there is already a position or a pending order on the symbol, so it can never touch a trade that isn't its own.
//+------------------------------------------------------------------+
//| Normalize the probe lot to the symbol's volume constraints       |
//+------------------------------------------------------------------+
double NormalizeProbeLot()
  {
   double lot  = (InpProbeLot > 0.0) ? InpProbeLot : SymbolInfoDouble(_Symbol, SYMBOL_VOLUME_MIN);
   double step = SymbolInfoDouble(_Symbol, SYMBOL_VOLUME_STEP);
   double mn   = SymbolInfoDouble(_Symbol, SYMBOL_VOLUME_MIN);
   double mx   = SymbolInfoDouble(_Symbol, SYMBOL_VOLUME_MAX);
   if(step > 0.0)
      lot = MathRound(lot / step) * step;
   if(lot < mn)
      lot = mn;
   if(lot > mx)
      lot = mx;
   return(lot);
  }
//+------------------------------------------------------------------+
//| Make sure a probe is safe to run right now                       |
//+------------------------------------------------------------------+
bool ProbeAllowed()
  {
   if(!TerminalInfoInteger(TERMINAL_TRADE_ALLOWED))
     { Print("Probe blocked: trading is not allowed in the terminal (AutoTrading off)."); return(false); }
   if(!MQLInfoInteger(MQL_TRADE_ALLOWED))
     { Print("Probe blocked: trading is not allowed for this EA."); return(false); }
   if(!AccountInfoInteger(ACCOUNT_TRADE_ALLOWED))
     { Print("Probe blocked: trading is not allowed on this account."); return(false); }
   if((ENUM_SYMBOL_TRADE_MODE)SymbolInfoInteger(_Symbol, SYMBOL_TRADE_MODE) != SYMBOL_TRADE_MODE_FULL)
     { Print("Probe blocked: ", _Symbol, " is not fully tradable right now."); return(false); }

//--- the probe opens and closes its OWN position; refuse if something is already there
   if(PositionSelect(_Symbol))
     { Print("Probe blocked: a position already exists on ", _Symbol, ". Close it first."); return(false); }
   for(int i = OrdersTotal() - 1; i >= 0; i--)
     {
      ulong tk = OrderGetTicket(i);
      if(tk > 0 && OrderGetString(ORDER_SYMBOL) == _Symbol)
        { Print("Probe blocked: a pending order exists on ", _Symbol, ". Remove it first."); return(false); }
     }
   return(true);
  }
NormalizeProbeLot rounds the lot to the symbol's volume step and clamps it to the allowed range. This prevents probe rejections due to invalid volume. ProbeAllowed checks that the terminal, the EA and the account can actually trade, that the symbol is fully tradable, and — crucially — that there is no existing position or pending order on the symbol. This is the blunt safety rule of the whole tool: refusing to run when something is already there is what keeps the probe from ever touching a position that isn't its own — and that holds on both netting and hedging accounts. The probe only closes the single position it just opened, identified by its ticket.
The active probe: RunProbeNow the precise measurement. We pick a side (it can alternate BUY/SELL so you sample both directions), snapshot the reference quote before sending, time the round trip with GetTickCount, read the real fill, and close exactly the position we opened — by its ticket, never by a blind "close whatever is on this symbol".
//+------------------------------------------------------------------+
//| Fire one round-trip test trade and measure it precisely          |
//+------------------------------------------------------------------+
void RunProbe()
  {
   if(!ProbeAllowed())
     { UpdatePanel(); return; }

//--- pick the side
   bool sideBuy;
   if(InpProbeSide == PROBE_BUY)
      sideBuy = true;
   else
      if(InpProbeSide == PROBE_SELL)
         sideBuy = false;
      else
        {
         sideBuy = g_nextProbeBuy;
         g_nextProbeBuy = !g_nextProbeBuy;
        }

   double lot = NormalizeProbeLot();
   string ts  = TimeToString(TimeCurrent(), TIME_DATE | TIME_SECONDS);
   trade.SetExpertMagicNumber(PROBE_MAGIC);

//--- entry leg: snapshot the reference quote BEFORE sending, then time the send
   MqlTick t0;
   if(!SymbolInfoTick(_Symbol, t0))
      return;
   double refIn    = sideBuy ? t0.ask : t0.bid;
   double spreadIn = (t0.ask - t0.bid) / _Point;

   uint   ms0  = GetTickCount();
   bool   ok   = sideBuy ? trade.Buy(lot, _Symbol, 0, 0, 0, "EQM probe")
                 : trade.Sell(lot, _Symbol, 0, 0, 0, "EQM probe");
   uint   ms1  = GetTickCount();
   uint   rcIn = trade.ResultRetcode();
   if(IsRequote(rcIn))
      g_nReqProbe++;
   if(!ok)
     {
      PrintFormat("Probe %s failed, retcode=%u", (sideBuy ? "BUY" : "SELL"), rcIn);
      UpdatePanel();
      return;
     }
   double fillIn = trade.ResultPrice();
   RecordSample("probe", ts, sideBuy, true, refIn, fillIn, rcIn, spreadIn, (double)(ms1 - ms0));

//--- identify exactly the position we just opened (don't blindly close by symbol)
   ulong posTicket = 0;
   if(PositionSelect(_Symbol))
      posTicket = (ulong)PositionGetInteger(POSITION_TICKET);

//--- exit leg: closing a long sells at bid, closing a short buys at ask
   MqlTick t1;
   if(!SymbolInfoTick(_Symbol, t1))
      return;
   bool   exitBuy   = !sideBuy;
   double refOut    = sideBuy ? t1.bid : t1.ask;
   double spreadOut = (t1.ask - t1.bid) / _Point;

   uint   ms2 = GetTickCount();
   bool   closed = (posTicket > 0) ? trade.PositionClose(posTicket)
                   : trade.PositionClose(_Symbol);
   uint   ms3 = GetTickCount();
   uint   rcOut = trade.ResultRetcode();
   if(IsRequote(rcOut))
      g_nReqProbe++;
   if(!closed)
     {
      PrintFormat("Probe CLOSE failed, retcode=%u", rcOut);
      UpdatePanel();
      return;
     }
   double fillOut = trade.ResultPrice();
   RecordSample("probe", ts, exitBuy, false, refOut, fillOut, rcOut, spreadOut, (double)(ms3 - ms2));
  }
A few things worth highlighting. The latency we measure (ms1 - ms0) is the time between calling trade.Buy/Sell and getting the result back — that is client-perceived per-leg latency (the entry and the exit legs are timed separately), not pure server execution time, but it is exactly the friction you feel, and it often explains slippage. We capture the position ticket right after opening and close that ticket; because ProbeAllowed already guaranteed nothing else was on the symbol, the probe leg is unambiguous. IsRequote is a one-line helper (rc == TRADE_RETCODE_REQUOTE || rc == TRADE_RETCODE_PRICE_CHANGED) and lives in the attached source. A caveat to be honest about: CTrade::ResultRetcode() reflects how the server processed our request — it is a pragmatic proxy for "was there a requote", not a market-wide measurement.
The slippage calculation: RecordSampleBoth modes end in the same function, which computes slippage with the right sign and routes the sample to the correct group — probe or passive — so the two never mix.
//+------------------------------------------------------------------+
//| Store one measurement: compute slippage, accumulate, log         |
//+------------------------------------------------------------------+
void RecordSample(const string source, const string tstamp, const bool isBuy, const bool isEntry,
                  const double reference, const double fill, const uint retcode,
                  const double spreadPt, const double latencyMs)
  {
//--- positive slippage = worse fill than the reference price
   double slip = isBuy ? (fill - reference) / _Point
                 : (reference - fill) / _Point;

   bool probe = (source == "probe");
   if(probe)
     {
      if(isEntry)
         Push(g_pEntry, slip);
      else
         Push(g_pExit,  slip);
     }
   else
     {
      if(isEntry)
         Push(g_aEntry, slip);
      else
         Push(g_aExit,  slip);
     }

   Push(g_spread, spreadPt);
   if(probe && latencyMs >= 0.0)
      Push(g_lat, latencyMs);

   AppendCsv(source, tstamp, isBuy, isEntry, reference, fill, slip, spreadPt, retcode, latencyMs);
   UpdatePanel();
  }
The sign rule is the important part. For a buy, the worst case is being filled above the reference, so a positive fill - reference is bad. For a sell it's the other way around. This way, a positive number always means a worse fill, regardless of direction. Push is a trivial helper that appends a value to a dynamic array (in the attached source).
Distributions, not just averagesAn average hides the tail, and the tail is where execution hurts: an average entry slippage of 5 points with a 95th percentile of 40 points is a very different account from a steady 5/6. So instead of keeping running sums, we keep the samples and compute the mean, the median and the p95 on demand.
//+------------------------------------------------------------------+
//| Empirical percentile of a sample array (p in [0,1])              |
//+------------------------------------------------------------------+
double StatPctl(const double &a[], const double p)
  {
   int n = ArraySize(a);
   if(n == 0)
      return(0.0);
   double c[];
   ArrayResize(c, n);
   ArrayCopy(c, a);
   ArraySort(c);                                  // ascending
   int rank = (int)MathRound(p * (n - 1));
   if(rank < 0)
      rank = 0;
   if(rank > n - 1)
      rank = n - 1;
   return(c[rank]);
  }
StatPctl(a, 0.5) gives the median and StatPctl(a, 0.95) the p95. It sorts a copy of the array, so the accumulators stay in insertion order. The companion StatAvg and StatMax are the obvious one-liners and are in the attached source.
The CSV report: OpenCsv and AppendCsvThe on-chart panel is for watching live, but the real analysis happens on the CSV. We open it once (adding the header if the file is empty) and append one row per sample, now including the latency and the deal's own time.
//+------------------------------------------------------------------+
//| Open the CSV report and write the header once                    |
//+------------------------------------------------------------------+
void OpenCsv()
  {
   g_csvHandle = FileOpen(InpCsvName, FILE_WRITE | FILE_READ | FILE_SHARE_READ | FILE_CSV | FILE_ANSI, ',');
   if(g_csvHandle == INVALID_HANDLE)
     {
      PrintFormat("Could not open %s (error %d). CSV logging disabled.", InpCsvName, GetLastError());
      return;
     }
   FileSeek(g_csvHandle, 0, SEEK_END);
   if(FileSize(g_csvHandle) == 0)
      FileWrite(g_csvHandle, "time", "source", "symbol", "side", "phase",
                "reference", "fill", "slippage_points", "spread_points", "retcode", "latency_ms");
  }
//+------------------------------------------------------------------+
//| Append one sample row to the CSV report                          |
//+------------------------------------------------------------------+
void AppendCsv(const string source, const string tstamp, const bool isBuy, const bool isEntry,
               const double reference, const double fill, const double slip,
               const double spreadPt, const uint retcode, const double latencyMs)
  {
   if(!InpWriteCsv || g_csvHandle == INVALID_HANDLE)
      return;
   FileWrite(g_csvHandle,
             tstamp,
             source,
             _Symbol,
             (isBuy ? "BUY" : "SELL"),
             (isEntry ? "ENTRY" : "EXIT"),
             DoubleToString(reference, _Digits),
             DoubleToString(fill, _Digits),
             DoubleToString(slip, 1),
             DoubleToString(spreadPt, 1),
             (int)retcode,
             (latencyMs >= 0.0 ? DoubleToString(latencyMs, 0) : ""));
   FileFlush(g_csvHandle);
  }
Two practical points. The source column ("probe" or "live") lets you split the precise and the approximate samples when you analyze the file — keep them apart, just like the panel does. The FILE_SHARE_READ flag lets you open the CSV in a spreadsheet while the EA is still writing to it; without it MetaTrader keeps the file locked. FileFlush after each row means you don't lose data if the terminal closes.
The on-chart panel: UpdatePanelThe panel reports the two groups separately so you never confuse a precise probe number with an approximate passive one. For each group it shows the average, the median, the p95 and the worst value, plus the asymmetry, the probe latency, the probe requotes and the observed spread.
//+------------------------------------------------------------------+
//| Refresh the on-chart statistics panel (probe vs passive groups)  |
//+------------------------------------------------------------------+
void UpdatePanel()
  {
   string L[];
   PushS(L, "=== Execution Quality Monitor ===");
   PushS(L, StringFormat("Symbol: %s    Probe: %d   Passive: %d", _Symbol,
                         ArraySize(g_pEntry) + ArraySize(g_pExit),
                         ArraySize(g_aEntry) + ArraySize(g_aExit)));
   PushS(L, " ");
   PushS(L, "-- PROBE (precise: requested-before-send vs fill) --");
   PushS(L, StringFormat("Entry: avg %.1f  med %.1f  p95 %.1f  worst %.1f",
                         StatAvg(g_pEntry), StatPctl(g_pEntry, 0.5), StatPctl(g_pEntry, 0.95), StatMax(g_pEntry)));
   PushS(L, StringFormat("Exit : avg %.1f  med %.1f  p95 %.1f  worst %.1f",
                         StatAvg(g_pExit), StatPctl(g_pExit, 0.5), StatPctl(g_pExit, 0.95), StatMax(g_pExit)));
   PushS(L, StringFormat("Asymmetry (entry-exit avg): %.1f pts", StatAvg(g_pEntry) - StatAvg(g_pExit)));
   PushS(L, StringFormat("Per-leg latency: avg %.0f ms  worst %.0f ms", StatAvg(g_lat), StatMax(g_lat)));
   PushS(L, StringFormat("Probe requotes / price changes: %d", g_nReqProbe));
   PushS(L, " ");
   PushS(L, "-- PASSIVE (approx: fill vs quote at event time) --");
   PushS(L, StringFormat("Entry: avg %.1f  med %.1f  p95 %.1f  worst %.1f",
                         StatAvg(g_aEntry), StatPctl(g_aEntry, 0.5), StatPctl(g_aEntry, 0.95), StatMax(g_aEntry)));
   PushS(L, StringFormat("Exit : avg %.1f  med %.1f  p95 %.1f  worst %.1f",
                         StatAvg(g_aExit), StatPctl(g_aExit, 0.5), StatPctl(g_aExit, 0.95), StatMax(g_aExit)));
   PushS(L, " ");
   PushS(L, StringFormat("Observed spread: avg %.1f  med %.1f pts", StatAvg(g_spread), StatPctl(g_spread, 0.5)));
   PushS(L, "Positive = worse fill.  Whole path, not just the broker.");
   PushS(L, "Run on a DEMO account or with the minimum lot.");

   int x  = 20;
   int y0 = 46;
   int lh = InpFontSize + 9;
   int k  = ArraySize(L);
   for(int i = 0; i < MAX_LABELS; i++)
     {
      if(i < k)
         SetLabel("EQM_L" + (string)i, x, y0 + i * lh, L[i], InpFontSize, InpTextColor);
      else
         ObjectDelete(0, "EQM_L" + (string)i);
     }
  }
We build the lines into a string array (PushS is the string twin of Push) and render them with SetLabel, which creates each label once and updates it afterwards, using a monospaced font (Consolas) so the columns line up. The button (CreateButton/PlaceButton), the chart events (OnChartEvent) and the cleanup (DeletePanel) are straightforward UI plumbing — they are in the attached source, unchanged from a standard on-chart panel.
Note: the listing above shows the key functions, not every line. The helper routines (Push, PushS, IsRequote, StatAvg, StatMax, the button and the labels) are simple and are included in full in the attached source file, which compiles with 0 errors and 0 warnings.
How to use it
- Compile the EA in MetaEditor (F7) and check that it reports 0 errors and 0 warnings.
- Open a demo account and drag the EA onto a chart of the symbol you want to measure (for example XAUUSD, where slippage tends to be more visible).
- Enable Algo Trading. Make sure there is no open position or pending order on that symbol — the probe refuses to run otherwise, on purpose.
- Click the Probe execution button several times, at different moments of the day. With InpProbeSide = PROBE_ALTERNATE it samples BUY and SELL in turn, so you can see entry asymmetry by direction.
- Optionally, leave the EA running while you trade normally or while another EA runs: the passive mode will record those deals too (as approximate samples), as long as they are on this chart's symbol.
- Read the panel — remember the two groups are not the same precision — and, for finer analysis, open the CSV in MQL5\Files and split by the source column.
Say that after 40 alternating probes on XAUUSD across a day, the probe group shows something like this:
-- PROBE (precise: requested-before-send vs fill) --
Entry: avg 22.5  med 18.0  p95 70.0  worst 90.0
Exit : avg 8.0   med 6.0   p95 28.0  worst 35.0
Asymmetry (entry-exit avg): 14.5 pts
Per-leg latency: avg 95 ms  worst 320 ms
Probe requotes / price changes: 3

Observed spread: avg 30.0  med 28.0 pts
The first thing I read is the distribution, not the average. Entry slippage averages 22.5 points, but the median is 18 and the p95 is 70: most fills are tolerable, a minority are brutal — and that p95 is the number that quietly ruins live results while staying invisible in the mean. Next, the asymmetry: you are filled 14.5 points worse on entries than on exits, typical of a slower feed or an added execution margin, and for an M1 scalper that asymmetric cost can turn a backtest winner into a live loser. Finally, the 95 ms average latency (320 ms worst) suggests part of the cost is the round trip itself, not the broker's pricing.
Then I open the CSV, filter source = probe, and group by hour using the time column. Usually the worst fills concentrate at specific moments: session opens, closes, or high-impact news. That is actionable: add a time filter to your EA, or avoid those windows. If instead the slippage were low and even, with a tight p95, your live problem probably isn't execution at all, and you should look at the strategy.
How to interpret the numbersHere is how I read the metrics:
- Low, even slippage with a tight p95 (entry ≈ exit): healthy execution. If your live doesn't match the backtest, the problem is probably elsewhere.
- High asymmetry (entry much worse than exit): a red flag for scalpers and M1 strategies. You are paying a hidden cost on every entry that the backtest doesn't model. Consider another broker or a different account type (for example ECN with commission instead of spread).
- A p95 far above the average: rare but severe fills. Even if the mean looks fine, the tail can decide your month.
- High latency: points at your own side of the path — VPS location, connection — as much as the broker.
- Frequent probe requotes: suggests an instant-execution feed that struggles to fill; for high-frequency EAs it's almost a deal-breaker.
The goal is not to chase a perfect zero — some slippage is normal — but to have your own reference numbers and be able to compare brokers, account types or VPS locations with data instead of marketing.
Expected result 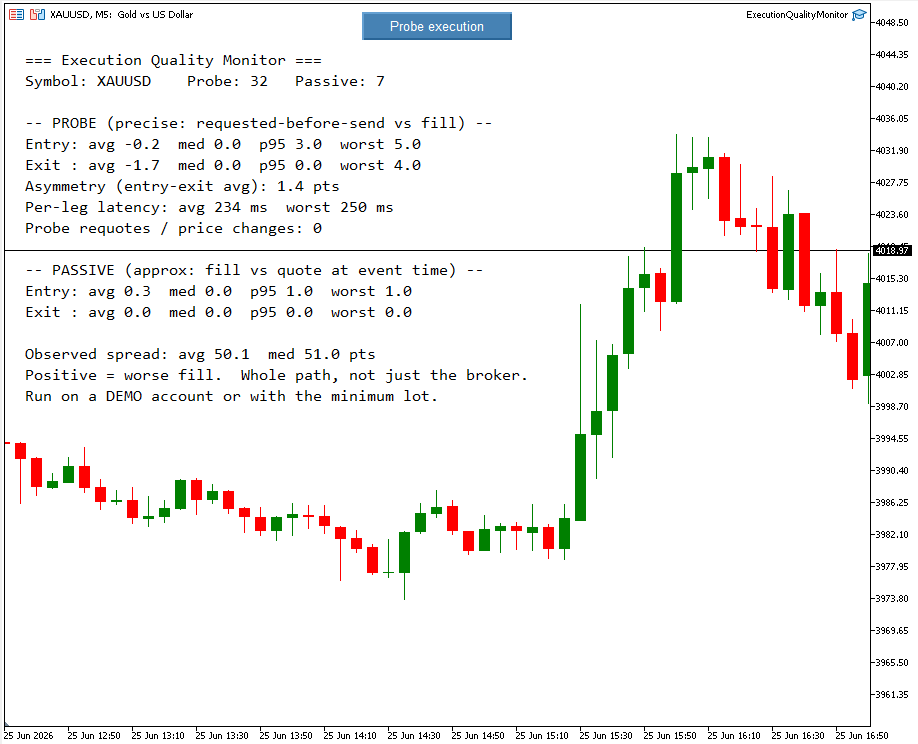
A word of caution: what you are really measuring
It is worth saying plainly, because it changes how you act on the numbers: this tool measures the execution path, not the broker alone. Between your decision and the fill sit your terminal, your PC or VPS, the internet hop, the broker gateway, the server queue and the venue's liquidity. A bad number can come from any of those. Before you switch brokers because of a high reading, rule out your own side first — especially latency and VPS distance from the server. The probe's latency figure is there precisely to help you separate "the broker fills me badly" from "my round trip is slow".
Extending the tool
A few directions that build naturally on this base:
- Per-hour / session buckets: accumulate the statistics in 24-slot arrays to show the worst and best hour right on the panel, without going through the spreadsheet.
- Persistence across sessions: read the CSV on start (or use terminal global variables) so the samples don't reset every time you restart.
- Favorable vs adverse split: report the share of adverse fills and the average of adverse-only versus favorable-only slippage; asymmetry often hides there.
- Multi-symbol and broker comparison: read each deal's own symbol, or run the same tool against two accounts, to rank symbols or brokers by spread, p95 slippage and latency.
Limitations
Let me be honest about what this tool does NOT do:
- Passive mode is an approximation. Its reference is the quote observed when the OnTradeTransaction event is handled, not the price at the exact instant the order was sent. On fast markets it can over- or under-state, and even flip sign. For request-to-fill precision, use the probe.
- Requotes are counted for probes only. The count comes from the return code of the tool's own trade calls; it is not an account-wide requote rate, and passive deals are not included in it.
- Statistics are deal-based, not order-based. An order that fills in several parts becomes several samples; the tool does not reassemble order-level intent.
- It measures the whole path, not the broker in isolation (see the caution above).
- The probe trades for real (spread/commission cost), which is why a demo or the minimum lot is the right way to run it.
- It does not replace a tick-by-tick analysis at the server level; it's a practical client-side diagnostic, and the CSV is your historical record for offline work.
Conclusion
In my experience, the gap between a promising backtest and a disappointing live result is often not in the strategy, but in how orders are actually executed. Measuring it — instead of assuming it — lets you decide with data: pick a broker, drop an hour, move your VPS, or confirm the problem is somewhere else. I built the Execution Quality Monitor to put numbers on that hidden cost, with an honest split between a precise probe and an approximate passive mode. The full source is attached and compiles cleanly; try it on your account and compare what you measure against what your backtest assumes.
Disclaimer: this tool is for diagnostics and analysis. It is not financial advice.
Warning: All rights to these materials are reserved by MetaQuotes Ltd. Copying or reprinting of these materials in whole or in part is prohibited.
This article was written by a user of the site and reflects their personal views. MetaQuotes Ltd is not responsible for the accuracy of the information presented, nor for any consequences resulting from the use of the solutions, strategies or recommendations described.

 Path Signatures for Lead-Lag Detection
 MCMC Sampling Methods: The Slice Sampling Algorithm
 Generating a Per-Symbol Trade Analytics PDF Report from MQL5
 A Reinforcement Learning System for Algorithmic Trading in MQL5

- Free trading apps
- Over 8,000 signals for copying
- Economic news for exploring financial markets
You agree to website policy and terms of use