

Symbol Correlation Monitor with Live Heatmap in MQL5
 149
149
 0
0

Introduction
A trader can hold five positions in five symbols and still not be diversified. If two or three of those symbols tend to move together, a loss on one is very likely to show up as a loss on the others at the same time, which means the account's real risk concentration is much higher than the position count alone suggests. Standard trade reports have nothing to say about this, since they look at each position in isolation.
This matrix measures how closely symbols' price returns move together. It does not measure the portfolio's actual risk, since it does not account for position size, direction, or how much each position would gain or lose per point of movement. Two highly correlated symbols held in opposite directions can reduce risk rather than concentrate it. Treat the matrix as a signal that two symbols are worth a closer look, not as a finished risk calculation.
Pearson correlation answers a simple question: over a recent window, how closely did the returns of two symbols move together? A value near 1.0 means they moved almost in lockstep. A value near -1.0 means one tended to rise when the other fell. A value near zero means no clear linear relationship at all. None of this is exotic mathematics, but correlation between two symbols is not a fixed fact. It drifts, sometimes sharply, as market regimes shift, so a number computed once at the start of the day can already be stale by the afternoon.
This article builds an Expert Advisor that keeps the correlation matrix close to current. It reads the symbols of all open positions, builds rolling return windows from closed bars, computes the pairwise correlation matrix, and draws it as a heatmap on the chart. The matrix recomputes on every new bar and on every change to the open position set, not on every tick. Every symbol pair whose correlation reaches a configurable threshold gets a visible warning border, so a trader glancing at the panel does not need to read every number to see where the risk is concentrated.
Before the implementation: a correlation matrix describes the recent past, not a forecast. A pair that was highly correlated last week can decouple this week, and a pair that looks independent today can start moving together the moment a shared driver, a rate decision, or a risk-off event shows up. This monitor is built to make that drift visible soon after it happens, not to predict when it will happen next. Because every return is measured between closed bars, the matrix always reflects the most recently completed bar, not the instant a correlation shift begins.
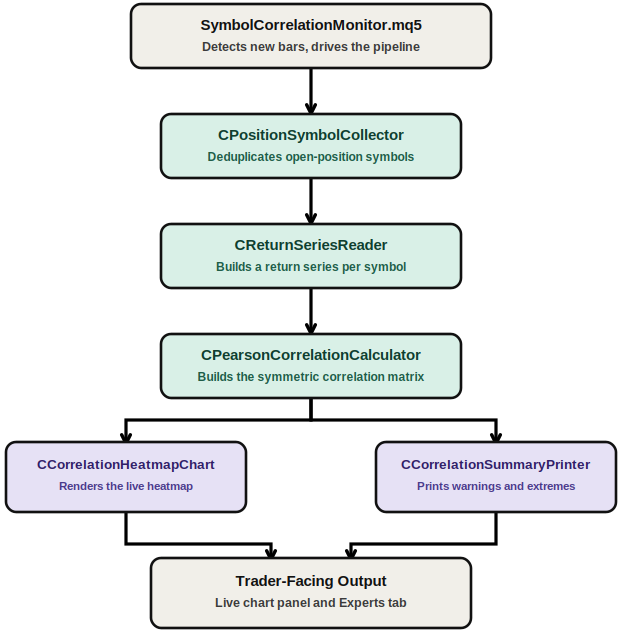
Correlation Monitor Architecture: The Expert Advisor drives the pipeline: symbols are collected, return series are built, then correlations are calculated. The result feeds both the heatmap chart and the summary printer.
Data Model: Return Series and the Correlation Matrix — CorrelationTypes.mqh
Two structures carry this project's data. CSymbolReturnSeries holds one symbol's rolling window of bar-to-bar percentage returns. CCorrelationMatrix holds the finished, square matrix of pairwise correlations across every monitored symbol.
CSymbolReturnSeries is deliberately narrow: a symbol name, a return array, and a count. Nothing else about the symbol, its open positions, its lot size, its current price, belongs here, since nothing downstream needs it. The constructor resets the return array to empty explicitly, so a series that has not yet been built by the reader can never be mistaken for a real result with zero returns in it.
//+------------------------------------------------------------------+
//|                                             CorrelationTypes.mqh |
//+------------------------------------------------------------------+
#ifndef CORRELATIONTYPES_MQH
#define CORRELATIONTYPES_MQH

//+---------------------------------------------------------------------+
//| CSymbolReturnSeries                                                 |
//+---------------------------------------------------------------------+
class CSymbolReturnSeries
  {
public:
   string            m_symbol;    // symbol this series belongs to
   double            m_returns[]; // bar-to-bar percentage returns, most recent first
   int               m_count;     // number of returns currently held
                     CSymbolReturnSeries(void);
  };

//+------------------------------------------------------------------+
//| Constructor                                                      |
//| Initializes an explicit, empty default state so a series that has|
//| not yet been populated can never be mistaken for a real result.  |
//+------------------------------------------------------------------+
CSymbolReturnSeries::CSymbolReturnSeries(void)
  {
   m_symbol = "";
   m_count  = 0;
   ::ArrayResize(m_returns, 0);
  }
CCorrelationMatrix is more involved, because MQL5 does not let a class hold a true two-dimensional array as a member. The matrix is instead stored as one flat array, and Index() converts a (row, column) pair into the offset inside that flat array. A second flat array, m_defined, tracks whether each cell's correlation could actually be computed, since a symbol whose price did not move at all across the window produces a mathematically undefined result rather than a genuine zero, and the two need to stay visibly different. Every accessor on this class trusts the caller to pass a row and column between 0 and Size() minus 1; every call site in this project loops within that range, so no bounds check is performed inside the class itself.
//+-----------------------------------------------------------------------+
//| CCorrelationMatrix                                                    |
//+-----------------------------------------------------------------------+
class CCorrelationMatrix
  {
private:
   string            m_symbols[];
   double            m_values[];
   bool              m_defined[];
   int               m_size;

public:
                     CCorrelationMatrix(void);
                    ~CCorrelationMatrix(void);
   void              Initialize(const string &symbols[], int count);
   int               Index(int row, int col) const;
   void              SetValue(int row, int col, double value, bool is_defined);
   double            GetValue(int row, int col) const;
   bool              IsDefined(int row, int col) const;
   int               Size(void) const;
   string            GetSymbol(int index) const;
  };

//+------------------------------------------------------------------+
//| Constructor                                                      |
//| Starts with an empty, zero-sized matrix until Initialize() is    |
//| called.                                                          |
//+------------------------------------------------------------------+
CCorrelationMatrix::CCorrelationMatrix(void)
  {
   m_size = 0;
   ::ArrayResize(m_symbols, 0);
   ::ArrayResize(m_values, 0);
   ::ArrayResize(m_defined, 0);
  }

//+------------------------------------------------------------------+
//| Destructor                                                       |
//| No resources are owned beyond plain arrays, so no cleanup beyond |
//| default destruction is required.                                 |
//+------------------------------------------------------------------+
CCorrelationMatrix::~CCorrelationMatrix(void)
  {
  }
Initialize(), SetValue(), and GetValue() make the flat-array design usable. Initialize() allocates the value and defined arrays at count * count and resets every cell before any correlation has actually been computed. SetValue() writes one cell, and here it is worth being precise about why the method cannot be const: this has nothing to do with array parameters passed by reference, the rule this project applies elsewhere. SetValue() writes directly into m_values and m_defined, which are the class's own members, and mutating a class's own state always requires a non-const method, independent of any other rule.
//+--------------------------------------------------------------------+
//| Initialize                                                         |
//+--------------------------------------------------------------------+
void CCorrelationMatrix::Initialize(const string &symbols[],const int count)
  {
   m_size = count;
   ::ArrayResize(m_symbols, count);
   for(int i = 0; i < count; i++)
      m_symbols[i] = symbols[i];
   ::ArrayResize(m_values, count * count);
   ::ArrayResize(m_defined, count * count);
   for(int i = 0; i < count * count; i++)
     {
      m_values[i]  = 0.0;
      m_defined[i] = false;
     }
  }
//+------------------------------------------------------------------------+
//| SetValue                                                               |
//+------------------------------------------------------------------------+
void CCorrelationMatrix::SetValue(const int row,const int col,const double value,const bool is_defined)
  {
   int index = Index(row, col);
   m_values[index]  = value;
   m_defined[index] = is_defined;
  }
Index() is the one calculation the rest of the class depends on, and it is exactly the kind of small, self-contained arithmetic where an off-by-one error would first appear. Keeping it in its own method, rather than repeating the row * m_size + col formula wherever a cell is touched, means it only has to be gotten right once, and it can be tested directly against known corner cases.
//+-----------------------------------------------------------------------+
//| Index                                                                 |
//+-----------------------------------------------------------------------+
int CCorrelationMatrix::Index(const int row,const int col) const
  {
   return(row * m_size + col);
  }
GetValue(), IsDefined(), Size(), and GetSymbol() round out the class as simple, const-safe accessors: GetValue() and IsDefined() return one cell's figures, Size() reports how many symbols are in the matrix, and GetSymbol() returns the label for a given row or column index.
//+------------------------------------------------------------------+
//| GetValue                                                         |
//+------------------------------------------------------------------+
double CCorrelationMatrix::GetValue(const int row,const int col) const
  {
   return(m_values[Index(row, col)]);
  }

//+------------------------------------------------------------------+
//| IsDefined                                                        |
//+------------------------------------------------------------------+
bool CCorrelationMatrix::IsDefined(const int row,const int col) const
  {
   return(m_defined[Index(row, col)]);
  }

//+------------------------------------------------------------------+
//| Size                                                             |
//+------------------------------------------------------------------+
int CCorrelationMatrix::Size(void) const
  {
   return(m_size);
  }

//+------------------------------------------------------------------+
//| GetSymbol                                                        |
//+------------------------------------------------------------------+
string CCorrelationMatrix::GetSymbol(const int index) const
  {
   return(m_symbols[index]);
  }
Finding Out Which Symbols Are Actually Open — PositionSymbolCollector.mqh
Before any correlation can be computed, the monitor needs to know which symbols matter right now, and that list changes every time a position opens or closes. CPositionSymbolCollector handles this with two methods: a private search helper and a public collection method.
//+------------------------------------------------------------------+
//|                                      PositionSymbolCollector.mqh |
//+------------------------------------------------------------------+
#ifndef POSITIONSYMBOLCOLLECTOR_MQH
#define POSITIONSYMBOLCOLLECTOR_MQH

//+---------------------------------------------------------------------+
//| CPositionSymbolCollector                                            |
//+---------------------------------------------------------------------+
class CPositionSymbolCollector
  {
private:
   int               FindSymbolIndex(const string &symbols[], int count, const string target_symbol) const;

public:
                     CPositionSymbolCollector(void);
                    ~CPositionSymbolCollector(void);
   bool              Collect(string &symbols_out[]) const;
  };

//+------------------------------------------------------------------+
//| Constructor                                                      |
//| The collector holds no state between calls, so construction      |
//| performs no work beyond default object creation.                 |
//+------------------------------------------------------------------+
CPositionSymbolCollector::CPositionSymbolCollector(void)
  {
  }

//+------------------------------------------------------------------+
//| Destructor                                                       |
//| No resources are owned by this class, so no cleanup is required. |
//+------------------------------------------------------------------+
CPositionSymbolCollector::~CPositionSymbolCollector(void)
  {
  }
FindSymbolIndex() is a linear search that checks whether a symbol has already been added to the list being built. It only reads its array parameter, so it stays a safe const method.
//+---------------------------------------------------------------------+
//| FindSymbolIndex                                                     |
//+---------------------------------------------------------------------+
int CPositionSymbolCollector::FindSymbolIndex(const string &symbols[],const int count,const string target_symbol) const
  {
   for(int i = 0; i < count; i++)
     {
      if(symbols[i] == target_symbol)
         return(i);
     }
   return(-1);
  }
Collect() walks every open position with PositionGetTicket() and PositionGetString(POSITION_SYMBOL), appending a symbol to the output only the first time it appears. A trader holding three EURUSD positions and one GBPUSD position ends up with a two-symbol list, not four, since the correlation matrix should have one row per distinct symbol, not one row per position. An account with no open positions at all is not treated as an error: Collect() simply returns an empty list, and the caller decides what to show on an otherwise empty heatmap.
//+------------------------------------------------------------------------+
//| Collect                                                                |
//+------------------------------------------------------------------------+
bool CPositionSymbolCollector::Collect(string &symbols_out[]) const
  {
//--- start from an empty output buffer regardless of any prior contents
   ::ArrayResize(symbols_out, 0);
   int total_positions = ::PositionsTotal();
   for(int i = 0; i < total_positions; i++)
     {
      ulong ticket = ::PositionGetTicket(i);
      if(ticket == 0)
         continue;
      string symbol = ::PositionGetString(POSITION_SYMBOL);
      //--- only append a symbol the first time it is encountered
      if(FindSymbolIndex(symbols_out, ::ArraySize(symbols_out), symbol) < 0)
        {
         int index = ::ArraySize(symbols_out);
         ::ArrayResize(symbols_out, index + 1);
         symbols_out[index] = symbol;
        }
     }
   return(true);
  }
Turning Bar Prices into Returns — ReturnSeriesReader.mqh
Correlation is computed on returns, not on raw price levels, since two symbols quoted on completely different scales can still move in lockstep percentage-wise. CReturnSeriesReader keeps the terminal-facing step and the arithmetic in separate methods, the same split this project uses everywhere I/O and computation meet.
//+------------------------------------------------------------------+
//|                                           ReturnSeriesReader.mqh |
//+------------------------------------------------------------------+
#ifndef RETURNSERIESREADER_MQH
#define RETURNSERIESREADER_MQH

#include "CorrelationTypes.mqh"

//+---------------------------------------------------------------------+
//| CReturnSeriesReader                                                 |
//+---------------------------------------------------------------------+
class CReturnSeriesReader
  {
public:
                     CReturnSeriesReader(void);
                    ~CReturnSeriesReader(void);
   bool              ReadCloses(const string symbol, ENUM_TIMEFRAMES timeframe, int closes_needed, double &closes_out[]) const;
   bool              ComputeReturns(const double &closes[], int count, double &returns_out[]) const;
   bool              BuildSeries(const string symbol, ENUM_TIMEFRAMES timeframe, int bar_count, CSymbolReturnSeries &series_out) const;
  };

//+-------------------------------------------------------------------+
//| Constructor                                                       |
//| The reader holds no state between calls, so construction performs |
//| no work beyond default object creation.                           |
//+-------------------------------------------------------------------+
CReturnSeriesReader::CReturnSeriesReader(void)
  {
  }

//+------------------------------------------------------------------+
//| Destructor                                                       |
//| No resources are owned by this class, so no cleanup is required. |
//+------------------------------------------------------------------+
CReturnSeriesReader::~CReturnSeriesReader(void)
  {
  }
ReadCloses() is the only method here that touches the terminal. It requests bars starting one position back from the current bar, using CopyClose() with a start shift of 1, which deliberately skips the bar that is still forming. Without that skip, the newest correlation figure would keep shifting on every incoming tick rather than only when a new bar actually closes, which defeats the point of a rolling, bar-based monitor. CopyClose() always fills its destination array oldest bar first, regardless of how the array was indexed before the call, so ReadCloses() calls ArraySetAsSeries() on the result to make index 0 reliably mean the newest bar, which every method built on top of this one assumes. Requesting fewer bars than are actually available is reported as a failure, which happens naturally for a symbol with a short history.
//+------------------------------------------------------------------------+
//| ReadCloses                                                             |
//+------------------------------------------------------------------------+
bool CReturnSeriesReader::ReadCloses(const string symbol,const ENUM_TIMEFRAMES timeframe,
                                     const int closes_needed,double &closes_out[]) const
  {
   int copied = ::CopyClose(symbol, timeframe, 1, closes_needed, closes_out);
   if(copied < closes_needed)
      return(false);
//--- CopyClose() always fills the array oldest first; ArraySetAsSeries() makes
//--- index 0 refer to the newest copied bar, matching what the rest of this
//--- class assumes.
   ::ArraySetAsSeries(closes_out, true);
   return(true);
  }
ComputeReturns() is the pure function that turns those closes into percentage returns. The "closes" array follows the terminal's own series convention, where index 0 is the most recent bar and later indices go further back, so returns_out[0] ends up as the most recent return, and it needs at least two closes to produce one return. A zero-priced close in the denominator is treated as invalid data rather than allowed to divide by zero, which could otherwise happen on corrupted history or a placeholder value.
//+------------------------------------------------------------------------+
//| ComputeReturns                                                         |
//+------------------------------------------------------------------------+
bool CReturnSeriesReader::ComputeReturns(const double &closes[],const int count,double &returns_out[]) const
  {
   if(count < 2)
      return(false);
   ::ArrayResize(returns_out, count - 1);
   for(int i = 0; i < count - 1; i++)
     {
      if(closes[i + 1] == 0.0)
         return(false);
      returns_out[i] = (closes[i] - closes[i + 1]) / closes[i + 1];
     }
   return(true);
  }
BuildSeries() orchestrates the two, requesting exactly bar_count + 1 closes so that bar_count returns can be computed from them, then copying the result into the output series with ArrayCopy(). This is a freshly constructed CSymbolReturnSeries on every call, so its return array always starts empty before the copy, which matters for a reason that comes up again later in this article.
//+------------------------------------------------------------------------+
//| BuildSeries                                                            |
//+------------------------------------------------------------------------+
bool CReturnSeriesReader::BuildSeries(const string symbol,const ENUM_TIMEFRAMES timeframe,
                                       const int bar_count,CSymbolReturnSeries &series_out) const
  {
   double closes[];
   if(!ReadCloses(symbol, timeframe, bar_count + 1, closes))
      return(false);

   double returns[];
   if(!ComputeReturns(closes, ::ArraySize(closes), returns))
      return(false);

   series_out.m_symbol = symbol;
   ::ArrayCopy(series_out.m_returns, returns);
   series_out.m_count = ::ArraySize(returns);
   return(true);
  }
Computing Pearson Correlation and the Full Matrix — PearsonCorrelationCalculator.mqh
CPearsonCorrelationCalculator is where the actual statistics live, and both of its methods are pure functions with no dependency on a live account, which is what makes this class directly testable.
//+------------------------------------------------------------------+
//|                                 PearsonCorrelationCalculator.mqh |
//+------------------------------------------------------------------+
#ifndef PEARSONCORRELATIONCALCULATOR_MQH
#define PEARSONCORRELATIONCALCULATOR_MQH

#include "CorrelationTypes.mqh"

//+--------------------------------------------------------------------+
//| CPearsonCorrelationCalculator                                      |
//+--------------------------------------------------------------------+
class CPearsonCorrelationCalculator
  {
public:
                     CPearsonCorrelationCalculator(void);
                    ~CPearsonCorrelationCalculator(void);
   bool              ComputePairCorrelation(const double &series_a[], const double &series_b[], int count, double &correlation_out) const;
   bool              BuildMatrix(const CSymbolReturnSeries &series[], int count, CCorrelationMatrix &matrix_out) const;
  };

//+------------------------------------------------------------------+
//| Constructor                                                      |
//| The calculator holds no state between calls, so construction     |
//| performs no work beyond default object creation.                 |
//+------------------------------------------------------------------+
CPearsonCorrelationCalculator::CPearsonCorrelationCalculator(void)
  {
  }

//+------------------------------------------------------------------+
//| Destructor                                                       |
//| No resources are owned by this class, so no cleanup is required. |
//+------------------------------------------------------------------+
CPearsonCorrelationCalculator::~CPearsonCorrelationCalculator(void)
  {
  }
ComputePairCorrelation() implements the standard formula: covariance divided by the product of both series' standard deviations. A series with zero variance, every return in it identical, most commonly a symbol whose price simply did not move across the window, makes that denominator zero and the ratio mathematically undefined. Rather than defaulting to a correlation of zero, which could be misread as a genuine finding of "no relationship," this method reports the result as undefined through its return value. When a result is defined, it is also clamped to the theoretical [-1, 1] range, since accumulated floating-point rounding across many terms can occasionally push a result fractionally outside that range even when the true correlation is exactly 1.0 or -1.0.
//+---------------------------------------------------------------------------+
//| ComputePairCorrelation                                                    |
//+---------------------------------------------------------------------------+
bool CPearsonCorrelationCalculator::ComputePairCorrelation(const double &series_a[],const double &series_b[],
      const int count,double &correlation_out) const
  {
   correlation_out = 0.0;
   if(count < 2)
      return(false);

//--- compute both series' means
   double sum_a = 0.0, sum_b = 0.0;
   for(int i = 0; i < count; i++)
     {
      sum_a += series_a[i];
      sum_b += series_b[i];
     }
   double mean_a = sum_a / count;
   double mean_b = sum_b / count;

//--- accumulate covariance and both variances in a single pass
   double covariance = 0.0;
   double variance_a = 0.0;
   double variance_b = 0.0;
   for(int i = 0; i < count; i++)
     {
      double deviation_a = series_a[i] - mean_a;
      double deviation_b = series_b[i] - mean_b;
      covariance += deviation_a * deviation_b;
      variance_a += deviation_a * deviation_a;
      variance_b += deviation_b * deviation_b;
     }

//--- a zero-variance series makes the denominator zero and the ratio undefined
   double denominator = ::MathSqrt(variance_a * variance_b);
   if(denominator == 0.0)
      return(false);

   double correlation = covariance / denominator;
//--- clamp away any floating-point overshoot past the theoretical [-1, 1] range
   if(correlation > 1.0)
      correlation = 1.0;
   if(correlation < -1.0)
      correlation = -1.0;

   correlation_out = correlation;
   return(true);
  }
BuildMatrix() assembles the full matrix from an array of return series. It only computes the upper triangle, including the diagonal, and mirrors each result into its transposed cell, since correlation between A and B is identical to correlation between B and A by definition. The diagonal, a symbol against itself, is computed with the exact same ComputePairCorrelation() call as every other pair rather than being hardcoded to 1.0. That choice keeps the zero-variance rule in one place: a symbol whose returns never moved is exactly as undefined against itself as it is against any other symbol, and there is no need for a second, separate rule to say so.
//+---------------------------------------------------------------------------+
//| BuildMatrix                                                               |
//+---------------------------------------------------------------------------+
bool CPearsonCorrelationCalculator::BuildMatrix(const CSymbolReturnSeries &series[],const int count,
      CCorrelationMatrix &matrix_out) const
  {
   if(count <= 0)
      return(false);

   string symbols[];
   ::ArrayResize(symbols, count);
   for(int i = 0; i < count; i++)
      symbols[i] = series[i].m_symbol;
   matrix_out.Initialize(symbols, count);

   for(int row = 0; row < count; row++)
     {
      for(int col = row; col < count; col++)
        {
         int shared_count = ::MathMin(series[row].m_count, series[col].m_count);
         double correlation = 0.0;
         bool   is_defined  = ComputePairCorrelation(series[row].m_returns, series[col].m_returns, shared_count, correlation);
         matrix_out.SetValue(row, col, correlation, is_defined);
         if(col != row)
            matrix_out.SetValue(col, row, correlation, is_defined);
        }
     }
   return(true);
  }
Rendering the Live Heatmap with CCanvas — CorrelationHeatmapChart.mqh
CCorrelationHeatmapChart owns a CCanvas instance and draws the finished matrix as a grid of colored, labeled cells. Its constructor stores the object name and default cell geometry, and the canvas itself is created lazily on the first call to Draw().
//+------------------------------------------------------------------+
//|                                      CorrelationHeatmapChart.mqh |
//+------------------------------------------------------------------+
#ifndef CORRELATIONHEATMAPCHART_MQH
#define CORRELATIONHEATMAPCHART_MQH

#include <Canvas\Canvas.mqh>
#include "CorrelationTypes.mqh"

//--- palette used by the heatmap, kept at file scope
const color CORR_COLOR_BACKGROUND = clrWhite;
const color CORR_COLOR_TEXT       = clrBlack;
const color CORR_COLOR_BORDER     = C'190,190,190';
const color CORR_COLOR_NEUTRAL    = C'250,250,250';
const color CORR_COLOR_POSITIVE   = C'190,60,20';
const color CORR_COLOR_NEGATIVE   = C'20,90,170';
const color CORR_COLOR_DIAGONAL   = C'225,225,225';
const color CORR_COLOR_UNDEFINED  = C'248,248,248';
const color CORR_COLOR_WARNING    = C'255,140,0';

//+--------------------------------------------------------------------------+
//| CCorrelationHeatmapChart                                                 |
//| Owns a CCanvas-backed chart panel and renders a square heatmap of every  |
//| symbol pair's Pearson correlation, with the numeric value printed inside |
//| each cell. Unlike a metric whose color scale is normalized against       |
//| whatever happens to be in the data, correlation already has a fixed,     |
//| universal range of -1 to 1, so this chart always maps that same fixed    |
//| range to color rather than rescaling it per corr_matrix, which keeps a   |
//| cell's color meaning identical from one redraw to the next.              |
//+--------------------------------------------------------------------------+
class CCorrelationHeatmapChart
  {
private:
   CCanvas           m_canvas;
   string            m_object_name;
   bool              m_canvas_created;
   int               m_created_width;
   int               m_created_height;
   int               m_left_margin;
   int               m_top_margin;
   int               m_cell_size;

   color             CorrelationColor(double value, bool is_defined) const;
   void              DrawLabels(const CCorrelationMatrix &corr_matrix);
   void              DrawCell(int row, int col, const CCorrelationMatrix &corr_matrix, double warning_threshold);

public:
                     CCorrelationHeatmapChart(const string object_name);
                    ~CCorrelationHeatmapChart(void);
   bool              Draw(const CCorrelationMatrix &corr_matrix, double warning_threshold, int x, int y, int width, int height);
   void              Clear(void);
  };

//+---------------------------------------------------------------------+
//| Constructor                                                         |
//| Stores the chart object name and establishes the default layout     |
//| geometry. The canvas is created lazily on the first call to Draw(), |
//| so construction never touches the chart.                            |
//+---------------------------------------------------------------------+
CCorrelationHeatmapChart::CCorrelationHeatmapChart(const string object_name)
  {
   m_object_name    = object_name;
   m_canvas_created = false;
   m_created_width  = 0;
   m_created_height = 0;
   m_left_margin    = 90;
   m_top_margin     = 40;
   m_cell_size      = 60;
  }

//+------------------------------------------------------------------------+
//| Destructor                                                             |
//| Intentionally empty. Unlike a script that runs once and finishes,      |
//| this chart is meant to be redrawn repeatedly for as long as the        |
//| Expert Advisor that owns it stays attached to the chart, so nothing    |
//| here should tear the panel down automatically. Clear() is the explicit,|
//| caller-driven way to remove it, normally called once, from OnDeinit(). |
//+------------------------------------------------------------------------+
CCorrelationHeatmapChart::~CCorrelationHeatmapChart(void)
  {
  }

//+------------------------------------------------------------------+
//| Clear                                                            |
//| Explicitly removes the chart panel and releases the underlying   |
//| graphical resource.                                              |
//+------------------------------------------------------------------+
void CCorrelationHeatmapChart::Clear(void)
  {
   if(m_canvas_created)
     {
      m_canvas.Destroy();
      m_canvas_created = false;
      m_created_width  = 0;
      m_created_height = 0;
     }
  }
The destructor deserves a specific explanation here, because this project's chart panel behaves a little differently from a one-shot script's chart panel. An Expert Advisor stays attached to a chart and calls Draw() again on every new bar, so the panel needs to persist across many calls. Clear() handles teardown instead, called once from OnDeinit() when the Expert Advisor is actually removed. That is the one moment removing the panel is genuinely correct.
CorrelationColor() maps a value to color using correlation's fixed, universal range of -1 to 1, not the largest value in this particular matrix. A 0.8 means the same shade of orange every time the heatmap redraws, which keeps color comparable across bars and screenshots. Zero gets its own branch and renders as flat neutral, so it is never nudged toward red or blue by floating-point noise. An undefined cell gets its own dedicated color too, so a pair that could not be scored never looks the same as a pair that scored at exactly zero.
//+-----------------------------------------------------------------------------+
//| CorrelationColor                                                            |
//+-----------------------------------------------------------------------------+
color CCorrelationHeatmapChart::CorrelationColor(const double value,const bool is_defined) const
  {
   if(!is_defined)
      return(CORR_COLOR_UNDEFINED);
   if(value == 0.0)
      return(CORR_COLOR_NEUTRAL);

   double intensity = ::MathAbs(value); // the scale is fixed to [-1, 1], so the value itself is the intensity
   int    from_r    = (int)(CORR_COLOR_NEUTRAL & 0xFF);
   int    from_g    = (int)((CORR_COLOR_NEUTRAL >> 8) & 0xFF);
   int    from_b    = (int)((CORR_COLOR_NEUTRAL >> 16) & 0xFF);
   color  target    = (value > 0.0) ? CORR_COLOR_POSITIVE : CORR_COLOR_NEGATIVE;
   int    to_r      = (int)(target & 0xFF);
   int    to_g      = (int)((target >> 8) & 0xFF);
   int    to_b      = (int)((target >> 16) & 0xFF);

   int out_r = (int)::MathRound(from_r + (to_r - from_r) * intensity);
   int out_g = (int)::MathRound(from_g + (to_g - from_g) * intensity);
   int out_b = (int)::MathRound(from_b + (to_b - from_b) * intensity);
   return((color)(out_r | (out_g << 8) | (out_b << 16)));
  }
DrawLabels() places each symbol name above its column and to the left of its row. Every label is measured with TextGetSize() first, so a row label can be right-aligned against the grid and a column label centered above its column, regardless of name length.
//+------------------------------------------------------------------------+
//| DrawLabels                                                             |
//+------------------------------------------------------------------------+
void CCorrelationHeatmapChart::DrawLabels(const CCorrelationMatrix &corr_matrix)
  {
   int size = corr_matrix.Size();
   m_canvas.FontSet("Arial", 10, FW_BOLD, 0);
   ::TextSetFont("Arial", 10, FW_BOLD, 0);
   for(int i = 0; i < size; i++)
     {
      string label = corr_matrix.GetSymbol(i);
      uint label_w = 0, label_h = 0;
      ::TextGetSize(label, label_w, label_h);

      //--- row label, right-aligned against the left edge of the grid
      int row_y = m_top_margin + i * m_cell_size + (m_cell_size - (int)label_h) / 2;
      m_canvas.TextOut(m_left_margin - (int)label_w - 8, row_y, label, ::ColorToARGB(CORR_COLOR_TEXT, 255));

      //--- column label, centered above its own column
      int col_x = m_left_margin + i * m_cell_size + (m_cell_size - (int)label_w) / 2;
      m_canvas.TextOut(col_x, m_top_margin - (int)label_h - 6, label, ::ColorToARGB(CORR_COLOR_TEXT, 255));
     }
  }
DrawCell() fills and outlines one cell, prints its correlation value inside it, and adds a warning border when appropriate. The diagonal is excluded from that check: a symbol's correlation with itself is trivially 1.0, and flagging it would only distract from the real concentration-risk pairs. Since CCanvas::Rectangle() draws only a single-pixel outline, the thick warning border is built from three concentric rectangles, one pixel apart, which reads as bold without needing a dedicated thick-line primitive. The warning border responds to the size of the correlation, not its sign, so a strongly negative pair is flagged exactly like a strongly positive one. Both describe symbols that move together in a reliable, measurable pattern. Whether that pattern increases or reduces the trader's actual risk still depends on the direction and size of each position, which this chart does not know.
//+----------------------------------------------------------------------+
//| DrawCell                                                             |
//+----------------------------------------------------------------------+
void CCorrelationHeatmapChart::DrawCell(const int row,const int col,const CCorrelationMatrix &corr_matrix,
                                        const double warning_threshold)
  {
   int cell_x = m_left_margin + col * m_cell_size;
   int cell_y = m_top_margin  + row * m_cell_size;
   bool   is_diagonal = (row == col);
   bool   is_defined  = corr_matrix.IsDefined(row, col);
   double value       = corr_matrix.GetValue(row, col);

   color fill_color = is_diagonal ? CORR_COLOR_DIAGONAL : CorrelationColor(value, is_defined);
   m_canvas.FillRectangle(cell_x, cell_y, cell_x + m_cell_size, cell_y + m_cell_size, ::ColorToARGB(fill_color, 255));
   m_canvas.Rectangle(cell_x, cell_y, cell_x + m_cell_size, cell_y + m_cell_size, ::ColorToARGB(CORR_COLOR_BORDER, 255));

//--- a thick warning border on any off-diagonal cell at or beyond the threshold
   if(!is_diagonal && is_defined && ::MathAbs(value) >= warning_threshold)
     {
      for(int inset = 0; inset < 3; inset++)
         m_canvas.Rectangle(cell_x + inset, cell_y + inset, cell_x + m_cell_size - inset, cell_y + m_cell_size - inset,
                            ::ColorToARGB(CORR_COLOR_WARNING, 255));
     }

//--- numeric value, or an explicit "N/A" when the cell is undefined
   string value_text = is_defined ? ::DoubleToString(value, 2) : "N/A";
   m_canvas.FontSet("Arial", 11, FW_BOLD, 0);
   ::TextSetFont("Arial", 11, FW_BOLD, 0);
   uint text_w = 0, text_h = 0;
   ::TextGetSize(value_text, text_w, text_h);
   int text_x = cell_x + (m_cell_size - (int)text_w) / 2;
   int text_y = cell_y + (m_cell_size - (int)text_h) / 2;
   m_canvas.TextOut(text_x, text_y, value_text, ::ColorToARGB(CORR_COLOR_TEXT, 255));
  }
Draw() ties everything together: it creates the canvas on first use, or recreates it if the requested size has changed since the last call, handles an empty matrix with an explanatory message, then draws the labels and every cell. The resize check exists because the matrix grows and shrinks as positions open and close, and a canvas sized for the first draw would otherwise clip part of the grid once the symbol count outgrows it.
//+-------------------------------------------------------------+
//| Draw                                                        |
//+-------------------------------------------------------------+
bool CCorrelationHeatmapChart::Draw(const CCorrelationMatrix &corr_matrix,const double warning_threshold,
                                    const int x,const int y,const int width,const int height)
  {
//--- (re)create the canvas whenever it has not been created yet, or when the
//--- requested size no longer matches the size it was created at. The matrix
//--- can grow as positions open, so a fixed canvas size would silently clip
//--- the grid once the symbol count outgrows it.
   if(!m_canvas_created || width != m_created_width || height != m_created_height)
     {
      if(m_canvas_created)
         m_canvas.Destroy();
      if(!m_canvas.CreateBitmapLabel(m_object_name, x, y, width, height, COLOR_FORMAT_ARGB_NORMALIZE))
        {
         ::Print("CCorrelationHeatmapChart: failed to create canvas for object '", m_object_name, "'.");
         m_canvas_created = false;
         return(false);
        }
      m_canvas_created = true;
      m_created_width  = width;
      m_created_height = height;
     }
   m_canvas.Erase(::ColorToARGB(CORR_COLOR_BACKGROUND, 255));

   int size = corr_matrix.Size();
   if(size <= 0)
     {
      m_canvas.FontSet("Arial", 11, 0, 0);
      ::TextSetFont("Arial", 11, 0, 0);
      string message = "No open positions to correlate.";
      m_canvas.TextOut(m_left_margin, m_top_margin, message, ::ColorToARGB(CORR_COLOR_TEXT, 255));
      m_canvas.Update(true);
      return(true);
     }

   DrawLabels(corr_matrix);
   for(int row = 0; row < size; row++)
     {
      for(int col = 0; col < size; col++)
         DrawCell(row, col, corr_matrix, warning_threshold);
     }

   m_canvas.Update(true);
   return(true);
  }
A Numerical Report to the Experts Tab — CorrelationSummaryPrinter.mqh
CCorrelationSummaryPrinter backs the heatmap with an exact text report: every pair at or beyond the warning threshold, how many pairs could not be scored, and the single highest and single lowest defined correlation in the matrix. It only scans the upper triangle, excluding the diagonal, since every pair would otherwise be counted twice, and a symbol's correlation with itself carries no analytical meaning worth reporting.
//+------------------------------------------------------------------+
//|                                    CorrelationSummaryPrinter.mqh |
//+------------------------------------------------------------------+
#ifndef CORRELATIONSUMMARYPRINTER_MQH
#define CORRELATIONSUMMARYPRINTER_MQH

#include "CorrelationTypes.mqh"

//+--------------------------------------------------------------------+
//| CCorrelationSummaryPrinter                                         |
//| Complements the heatmap with an exact numerical report printed to  |
//| the Experts tab: which symbol pairs exceed the warning threshold,  |
//| which pairs could not be scored at all, and the single highest and |
//| single lowest defined correlation in the corr_matrix.              |
//+--------------------------------------------------------------------+
class CCorrelationSummaryPrinter
  {
public:
                     CCorrelationSummaryPrinter(void);
                    ~CCorrelationSummaryPrinter(void);
   void              Print(const CCorrelationMatrix &corr_matrix, double warning_threshold) const;
  };

//+-------------------------------------------------------------------+
//| Constructor                                                       |
//| The printer holds no state between calls, so construction performs|
//| no work beyond default object creation.                           |
//+-------------------------------------------------------------------+
CCorrelationSummaryPrinter::CCorrelationSummaryPrinter(void)
  {
  }

//+------------------------------------------------------------------+
//| Destructor                                                       |
//| No resources are owned by this class, so no cleanup is required. |
//+------------------------------------------------------------------+
CCorrelationSummaryPrinter::~CCorrelationSummaryPrinter(void)
  {
  }

//+--------------------------------------------------------------------------+
//| Print                                                                    |
//| Scans only the upper triangle of the corr_matrix, excluding the diagonal,|
//| since each pair otherwise appears twice and a symbol's correlation       |
//| with itself carries no analytical meaning. Every pair at or beyond the   |
//| warning threshold is printed as its own line; every undefined pair is    |
//| counted separately rather than silently ignored. When the corr_matrix has|
//| fewer than two symbols there is nothing to correlate, so that case is    |
//| reported explicitly instead of falling through to an empty best/worst    |
//| search.                                                                  |
//+--------------------------------------------------------------------------+
void CCorrelationSummaryPrinter::Print(const CCorrelationMatrix &corr_matrix,const double warning_threshold) const
  {
   int size = corr_matrix.Size();
   ::Print("Symbol Correlation Summary");
   ::PrintFormat("Symbols monitored: %d", size);

   if(size < 2)
     {
      ::Print("Fewer than two symbols are open, so no pair can be correlated.");
      return;
     }

   int    warning_count   = 0;
   int    undefined_count = 0;
   int    best_row        = -1, best_col = -1;
   int    worst_row       = -1, worst_col = -1;
   double best_value      = 0.0, worst_value = 0.0;
   bool   best_found      = false, worst_found = false;

   for(int row = 0; row < size; row++)
     {
      for(int col = row + 1; col < size; col++)
        {
         if(!corr_matrix.IsDefined(row, col))
           {
            undefined_count++;
            continue;
           }
         double value = corr_matrix.GetValue(row, col);

         if(::MathAbs(value) >= warning_threshold)
           {
            warning_count++;
            ::PrintFormat("WARNING: %s <-> %s   r = %.2f   exceeds the %.2f threshold",
                          corr_matrix.GetSymbol(row), corr_matrix.GetSymbol(col), value, warning_threshold);
           }

         if(!best_found || value > best_value)
           {
            best_found = true;
            best_value = value;
            best_row   = row;
            best_col   = col;
           }
         if(!worst_found || value < worst_value)
           {
            worst_found = true;
            worst_value = value;
            worst_row   = row;
            worst_col   = col;
           }
        }
     }

   ::PrintFormat("Pairs at or beyond the warning threshold: %d", warning_count);
   if(undefined_count > 0)
      ::PrintFormat("Pairs that could not be scored (flat returns over the window): %d", undefined_count);

   if(best_found)
      ::PrintFormat("Highest correlation: %s <-> %s   r = %.2f", corr_matrix.GetSymbol(best_row), corr_matrix.GetSymbol(best_col), best_value);
   if(worst_found)
      ::PrintFormat("Lowest correlation:  %s <-> %s   r = %.2f", corr_matrix.GetSymbol(worst_row), corr_matrix.GetSymbol(worst_col), worst_value);
   if(!best_found)
      ::Print("No pair in the corr_matrix produced a defined correlation.");
  }

#endif // CORRELATIONSUMMARYPRINTER_MQH
//+------------------------------------------------------------------+
Building the Live Expert Advisor — SymbolCorrelationMonitor.mq5
SymbolCorrelationMonitor.mq5 wires the five preceding components together, and it is where this project's structure genuinely departs from a script that runs once and exits. The heatmap needs to stay on the chart and keep refreshing, bar after bar, for as long as the Expert Advisor is attached, which means the chart object itself has to persist across many calls rather than being built fresh inside a function that runs repeatedly.
That is why g_heatmap_chart is declared at global scope, constructed exactly once when the Expert Advisor loads, rather than as a local variable inside the function that redraws it.
//+------------------------------------------------------------------+
//|                                    SymbolCorrelationMonitor.mq5  |
//+------------------------------------------------------------------+
#property description "Computes a rolling Pearson correlation matrix across the "
#property description "symbols of every currently open position and renders it as "
#property description "a live CCanvas heatmap, redrawn on every new bar."
#property strict

#include <SymbolCorrelationMonitor/CorrelationTypes.mqh>
#include <SymbolCorrelationMonitor/PositionSymbolCollector.mqh>
#include <SymbolCorrelationMonitor/ReturnSeriesReader.mqh>
#include <SymbolCorrelationMonitor/PearsonCorrelationCalculator.mqh>
#include <SymbolCorrelationMonitor/CorrelationHeatmapChart.mqh>
#include <SymbolCorrelationMonitor/CorrelationSummaryPrinter.mqh>

input ENUM_TIMEFRAMES InpTimeframe             = PERIOD_H1;  // timeframe the rolling return window is measured on
input int             InpBarCount              = 50;         // number of bar-to-bar returns in the rolling window
input double          InpCorrelationThreshold  = 0.8;        // absolute correlation at or above which a pair is flagged
input int             InpMaxSymbols            = 12;         // safety cap on distinct open-position symbols handled

//--- the heatmap panel is declared at global scope, not created fresh on every
//--- call, since an Expert Advisor's canvas must persist and simply be redrawn
//--- across many bars rather than recreated the way a one-shot script would
CCorrelationHeatmapChart g_heatmap_chart("CorrelationMonitor_Heatmap");
datetime                 g_last_bar_time = 0;
string                   g_last_symbols[]; // the open-position symbol set as of the last update
SymbolListsEqual() compares two symbol lists as sets, not as ordered sequences, since the terminal does not guarantee that position order stays stable between calls even when the underlying set of symbols has not changed.
//+-------------------------------------------------------------------------+
//| SymbolListsEqual                                                        |
//+-------------------------------------------------------------------------+
bool SymbolListsEqual(const string &list_a[],const string &list_b[])
  {
   int size_a = ::ArraySize(list_a);
   int size_b = ::ArraySize(list_b);
   if(size_a != size_b)
      return(false);
   for(int i = 0; i < size_a; i++)
     {
      bool found = false;
      for(int j = 0; j < size_b; j++)
        {
         if(list_a[i] == list_b[j])
           {
            found = true;
            break;
           }
        }
      if(!found)
         return(false);
     }
   return(true);
  }
UpdateAndRender() calls Draw() on that same instance every time it runs. Draw() creates the underlying bitmap object the first time it is called, and repaints that same object on later calls, recreating it only when the number of monitored symbols changes enough to need a different panel size.
//+-------------------------------------------------------------------------+
//| UpdateAndRender                                                         |
//+-------------------------------------------------------------------------+
void UpdateAndRender(void)
  {
   CPositionSymbolCollector collector;
   string symbols[];
   collector.Collect(symbols);

   int total_symbols = ::ArraySize(symbols);
   if(total_symbols > InpMaxSymbols)
     {
      ::PrintFormat("SymbolCorrelationMonitor: %d open-position symbols found, truncating to the first %d.",
                    total_symbols, InpMaxSymbols);
      ::ArrayResize(symbols, InpMaxSymbols);
      total_symbols = InpMaxSymbols;
     }

//--- build a return series per symbol, keeping only the symbols that succeed
   CReturnSeriesReader   reader;
   CSymbolReturnSeries   built_series[];
   for(int i = 0; i < total_symbols; i++)
     {
      CSymbolReturnSeries candidate;
      if(reader.BuildSeries(symbols[i], InpTimeframe, InpBarCount, candidate))
        {
         int index = ::ArraySize(built_series);
         ::ArrayResize(built_series, index + 1);
         built_series[index].m_symbol = candidate.m_symbol;
         built_series[index].m_count  = candidate.m_count;
         ::ArrayCopy(built_series[index].m_returns, candidate.m_returns);
        }
      else
        {
         ::PrintFormat("SymbolCorrelationMonitor: skipping %s, insufficient bar history for a %d-bar window.",
                       symbols[i], InpBarCount);
        }
     }

   CPearsonCorrelationCalculator calculator;
   CCorrelationMatrix            corr_matrix;
   bool matrix_built = calculator.BuildMatrix(built_series, ::ArraySize(built_series), corr_matrix);

//--- only a genuine data failure short-circuits the update: symbols were open,
//--- but none of them produced a usable return series. Zero open positions is
//--- not a failure, and falls through to the normal empty-matrix handling in
//--- the printer and the chart window.
   if(!matrix_built && total_symbols > 0)
     {
      ::PrintFormat("SymbolCorrelationMonitor: %d open-position symbols found, but no return series could be built from them.",
                    total_symbols);
      return;
     }

   CCorrelationSummaryPrinter printer;
   printer.Print(corr_matrix, InpCorrelationThreshold);

   int panel_size = 90 + corr_matrix.Size() * 60 + 40;
   g_heatmap_chart.Draw(corr_matrix, InpCorrelationThreshold, 20, 20, panel_size, panel_size);
   ::ChartRedraw(0);
  }
OnInit() first rejects a handful of input combinations that cannot produce a meaningful result: a bar count below two, a correlation threshold outside zero to one, or a maximum symbol count below one. Once the inputs pass that check, OnInit() calls UpdateAndRender() immediately, so the panel appears the moment the Expert Advisor attaches rather than waiting for the first new bar. It then records both the bar this first render was based on and the current open-position symbol set, so the first OnTick() has something genuine to compare against rather than an empty placeholder. OnDeinit() calls Clear() once, the deliberate moment this project actually tears the panel down.
//+---------------------------------------------------------------------------+
//| Expert initialization function                                            |
//+---------------------------------------------------------------------------+
int OnInit(void)
  {
//--- reject configurations that cannot produce a meaningful result
   if(InpBarCount < 2)
     {
      ::Print("SymbolCorrelationMonitor: InpBarCount must be at least 2.");
      return(INIT_PARAMETERS_INCORRECT);
     }
   if(InpCorrelationThreshold < 0.0 || InpCorrelationThreshold > 1.0)
     {
      ::Print("SymbolCorrelationMonitor: InpCorrelationThreshold must be between 0.0 and 1.0.");
      return(INIT_PARAMETERS_INCORRECT);
     }
   if(InpMaxSymbols < 1)
     {
      ::Print("SymbolCorrelationMonitor: InpMaxSymbols must be at least 1.");
      return(INIT_PARAMETERS_INCORRECT);
     }

   ::ArrayResize(g_last_symbols, 0);
   UpdateAndRender();
//--- record the bar this initial render was based on, so the first OnTick()
//--- after attaching does not mistake a real bar time for something different
//--- from the uninitialized zero and immediately rerun the whole pipeline a
//--- second time for no actual reason.
   g_last_bar_time = ::iTime(_Symbol, InpTimeframe, 0);
   CPositionSymbolCollector collector;
   collector.Collect(g_last_symbols);
   return(INIT_SUCCEEDED);
  }

//+-----------------------------------------------------------------------+
//| Expert deinitialization function                                      |
//+-----------------------------------------------------------------------+
void OnDeinit(const int reason)
  {
   g_heatmap_chart.Clear();
  }
OnTick() is where a bar-only monitor would fall short of what a trader actually needs. Waiting for a new InpTimeframe bar before recomputing anything means a position opened five minutes into an hourly bar would not show up on the heatmap for up to fifty-five minutes, which is not a reasonable delay for something meant to flag concentration risk.
//+-------------------------------------------------------------------------+
//| Expert tick function                                                    |
//+-------------------------------------------------------------------------+
void OnTick(void)
  {
   datetime current_bar_time = ::iTime(_Symbol, InpTimeframe, 0);
   bool     is_new_bar       = (current_bar_time != g_last_bar_time);

   CPositionSymbolCollector collector;
   string current_symbols[];
   collector.Collect(current_symbols);
   bool positions_changed = !SymbolListsEqual(current_symbols, g_last_symbols);

   if(!is_new_bar && !positions_changed)
      return;

   g_last_bar_time = current_bar_time;
//--- ArrayCopy() never shrinks a destination array, only grows it when needed,
//--- so g_last_symbols is reset to empty first; otherwise a symbol count that
//--- just decreased (a position closed) would leave stale trailing entries
//--- behind, which would make every subsequent tick look like a false change
//--- and trigger UpdateAndRender() forever.
   ::ArrayResize(g_last_symbols, 0);
   ::ArrayCopy(g_last_symbols, current_symbols);
   UpdateAndRender();
  }
OnTick() itself checks two independent conditions on every tick: whether a new bar has started, and whether the open-position symbol set has changed since the last update. Either one is enough to trigger a full recompute. Scanning open positions on every tick sounds expensive at first glance, but it is a short loop over a handful of tickets, far cheaper than the return-series and correlation work that only runs when something has actually changed.
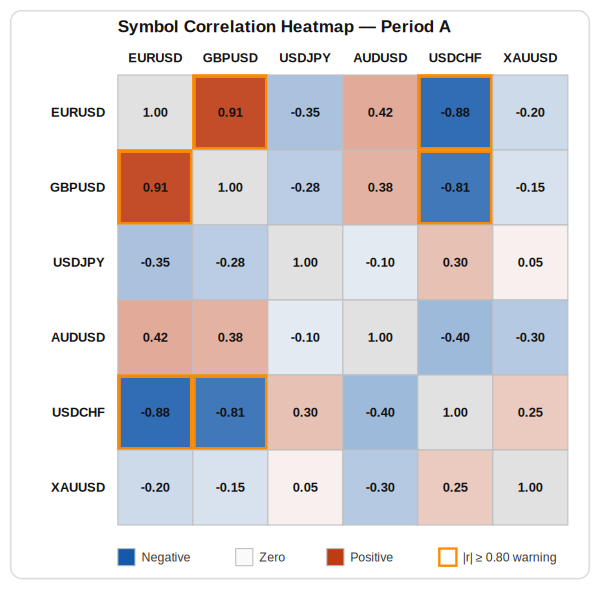
Symbol Correlation Heatmap — Period A: Illustrative mock-up, not a live screenshot. Each cell shows the Pearson correlation between two symbols' returns, blue for negative, red for positive, gray near zero. EURUSD and GBPUSD sit at 0.91, flagged with the orange warning border for moving almost in lockstep. USDCHF shows a strong negative correlation to both, meaning it tends to move opposite them.
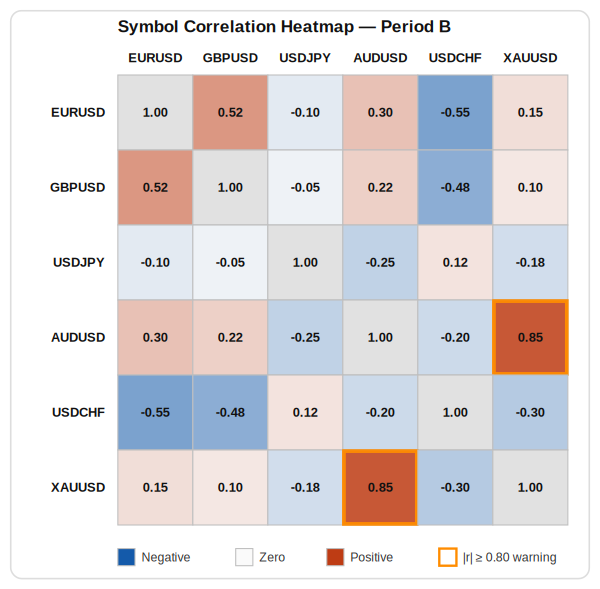
Symbol Correlation Heatmap — Period B: Illustrative mock-up, not a live screenshot. Same color scale as Period A. EURUSD and GBPUSD have cooled to 0.52, clearing the warning as their relationship weakens. AUDUSD and XAUUSD have risen to 0.85, becoming the new flagged pair, showing the monitor catching a fresh concentration risk as correlations shift.
Verification and Testing — TestCorrelationAnalytics.mq5
Position scanning and bar retrieval both depend on a live account, so neither CPositionSymbolCollector nor CReturnSeriesReader::ReadCloses can be meaningfully unit tested in a headless script. Everything downstream of that boundary, ComputeReturns(), the full Pearson correlation calculator, and the matrix's own indexing, is a pure function over plain data, and gets exercised directly with synthetic prices and synthetic return series.
//+------------------------------------------------------------------+
//|                                     TestCorrelationAnalytics.mq5 |
//+------------------------------------------------------------------+
#property description "Verifies return computation, Pearson correlation, and matrix "
#property description "index mapping using synthetic price and return data, "
#property description "independent of any live account or open positions."
#property script_show_inputs

#include <SymbolCorrelationMonitor/CorrelationTypes.mqh>
#include <SymbolCorrelationMonitor/ReturnSeriesReader.mqh>
#include <SymbolCorrelationMonitor/PearsonCorrelationCalculator.mqh>

//--- assertion counters, updated by the ASSERT macro used throughout this script
int g_assertion_passes   = 0;
int g_assertion_failures = 0;

//+---------------------------------------------------------- ---------+
//| ASSERT                                                             |
//| Records a pass or a failure for one checked condition and prints a |
//| diagnostic message, including the source line number, whenever the |
//| condition is false.                                                |
//+--------------------------------------------------------------------+
#define ASSERT(condition, message)                                          \
   if(!(condition))                                                         \
     {                                                                      \
      ::PrintFormat("ASSERTION FAILED: %s (line %d)", (message), __LINE__); \
      g_assertion_failures++;                                               \
     }                                                                      \
   else                                                                     \
     {                                                                      \
      g_assertion_passes++;                                                 \
     }
The first cluster of tests covers ComputeReturns(): a small synthetic close sequence checks the returns against a hand-computed expectation, a single close checks that the method fails rather than returning something invalid, and a zero-priced close checks that the method fails rather than dividing by zero.
//+------------------------------------------------------------------------+
//| TestComputeReturnsBasic                                                |
//| Verifies that ComputeReturns() converts a small synthetic close series |
//| into the expected bar-to-bar percentage returns, with index 0 the most |
//| recent return.                                                         |
//+------------------------------------------------------------------------+
void TestComputeReturnsBasic(void)
  {
   double closes[];
   ArrayResize(closes, 3);
   closes[0] = 110.0; // most recent close
   closes[1] = 100.0;
   closes[2] = 95.0;  // oldest close

   CReturnSeriesReader reader;
   double returns[];
   bool ok = reader.ComputeReturns(closes, ArraySize(closes), returns);

   ASSERT(ok, "ComputeReturns must succeed for at least two closes.");
   ASSERT(ArraySize(returns) == 2, "Three closes must produce exactly two returns.");
   ASSERT(MathAbs(returns[0] - 0.10) < 0.0001, "The newest return must equal (110 - 100) / 100.");
   ASSERT(MathAbs(returns[1] - (5.0 / 95.0)) < 0.0001, "The older return must equal (100 - 95) / 95.");
  }

//+------------------------------------------------------------------------+
//| TestComputeReturnsInsufficientData                                     |
//| Verifies that a single close, with no older close to compare against,  |
//| is reported as a failure rather than an empty or invalid return.       |
//+------------------------------------------------------------------------+
void TestComputeReturnsInsufficientData(void)
  {
   double closes[];
   ArrayResize(closes, 1);
   closes[0] = 100.0;

   CReturnSeriesReader reader;
   double returns[];
   bool ok = reader.ComputeReturns(closes, ArraySize(closes), returns);
   ASSERT(!ok, "ComputeReturns must fail when fewer than two closes are supplied.");
  }

//+----------------------------------------------------------------------+
//| TestComputeReturnsZeroDivision                                       |
//| Verifies that a zero-priced older close is treated as invalid data   |
//| rather than allowed to divide by zero.                               |
//+----------------------------------------------------------------------+
void TestComputeReturnsZeroDivision(void)
  {
   double closes[];
   ArrayResize(closes, 2);
   closes[0] = 10.0;
   closes[1] = 0.0;

   CReturnSeriesReader reader;
   double returns[];
   bool ok = reader.ComputeReturns(closes, ArraySize(closes), returns);
   ASSERT(!ok, "ComputeReturns must fail rather than divide by a zero-priced close.");
  }
The second cluster covers ComputePairCorrelation(): a series related to another by an exact positive linear formula checks that the coefficient comes out at exactly 1.0, an exact negative formula checks -1.0, a constant series checks that the zero-variance case is reported as undefined, and a single-point series checks the same for having too little data.
//+-----------------------------------------------------------------------+
//| TestComputePairCorrelationPerfectPositive                             |
//| Verifies that two series related by an exact positive linear formula  |
//| produce a correlation of exactly 1.0.                                 |
//+-----------------------------------------------------------------------+
void TestComputePairCorrelationPerfectPositive(void)
  {
   double series_a[] = {1.0, 2.0, 3.0, 4.0, 5.0};
   double series_b[] = {3.0, 5.0, 7.0, 9.0, 11.0}; // series_b = 2 * series_a + 1

   CPearsonCorrelationCalculator calculator;
   double correlation = 0.0;
   bool ok = calculator.ComputePairCorrelation(series_a, series_b, ArraySize(series_a), correlation);

   ASSERT(ok, "ComputePairCorrelation must succeed when both series have nonzero variance.");
   ASSERT(MathAbs(correlation - 1.0) < 0.0001, "An exact positive linear relationship must give a correlation of 1.0.");
  }

//+-----------------------------------------------------------------------+
//| TestComputePairCorrelationPerfectNegative                             |
//| Verifies that two series related by an exact negative linear formula  |
//| produce a correlation of exactly -1.0.                                |
//+-----------------------------------------------------------------------+
void TestComputePairCorrelationPerfectNegative(void)
  {
   double series_a[] = {1.0, 2.0, 3.0, 4.0, 5.0};
   double series_b[] = {-1.0, -2.0, -3.0, -4.0, -5.0}; // series_b = -series_a

   CPearsonCorrelationCalculator calculator;
   double correlation = 0.0;
   bool ok = calculator.ComputePairCorrelation(series_a, series_b, ArraySize(series_a), correlation);

   ASSERT(ok, "ComputePairCorrelation must succeed when both series have nonzero variance.");
   ASSERT(MathAbs(correlation - (-1.0)) < 0.0001, "An exact negative linear relationship must give a correlation of -1.0.");
  }

//+-----------------------------------------------------------------------+
//| TestComputePairCorrelationZeroVariance                                |
//| Verifies that a constant series, one with zero variance, is reported  |
//| as undefined rather than as a computed correlation of zero.           |
//+-----------------------------------------------------------------------+
void TestComputePairCorrelationZeroVariance(void)
  {
   double series_a[] = {1.0, 2.0, 3.0};
   double series_b[] = {5.0, 5.0, 5.0}; // constant, zero variance

   CPearsonCorrelationCalculator calculator;
   double correlation = 0.0;
   bool ok = calculator.ComputePairCorrelation(series_a, series_b, ArraySize(series_a), correlation);
   ASSERT(!ok, "ComputePairCorrelation must report undefined when either series has zero variance.");
  }

//+-----------------------------------------------------------------------+
//| TestComputePairCorrelationInsufficientData                            |
//| Verifies that a single data point, which has no variance to speak of, |
//| is reported as a failure.                                             |
//+-----------------------------------------------------------------------+
void TestComputePairCorrelationInsufficientData(void)
  {
   double series_a[] = {1.0};
   double series_b[] = {2.0};

   CPearsonCorrelationCalculator calculator;
   double correlation = 0.0;
   bool ok = calculator.ComputePairCorrelation(series_a, series_b, ArraySize(series_a), correlation);
   ASSERT(!ok, "ComputePairCorrelation must fail when fewer than two data points are supplied.");
  }
The third cluster checks the matrix itself: the flat-array index mapping at the corners of a 3x3 matrix, symmetry and a defined diagonal for two correlated series, and the undefined case for a zero-variance symbol both against itself and against a normal symbol.
//+----------------------------------------------------------------------------+
//| TestMatrixIndexBoundaries                                                  |
//| Verifies the flat-array index mapping at the corners of a small            |
//| corr_matrix, which is exactly where an off-by-one error would first appear.|
//+----------------------------------------------------------------------------+
void TestMatrixIndexBoundaries(void)
  {
   string symbols[] = {"AAA", "BBB", "CCC"};
   CCorrelationMatrix corr_matrix;
   corr_matrix.Initialize(symbols, 3);

   ASSERT(corr_matrix.Index(0, 0) == 0, "The first row and first column must map to flat index 0.");
   ASSERT(corr_matrix.Index(0, 2) == 2, "The first row, last column must map to flat index 2.");
   ASSERT(corr_matrix.Index(1, 0) == 3, "The second row, first column must map to flat index 3.");
   ASSERT(corr_matrix.Index(2, 2) == 8, "The last row, last column must map to flat index 8, the final slot in a 3x3 corr_matrix.");
  }

//+------------------------------------------------------------------------+
//| TestBuildMatrixSymmetryAndDiagonal                                     |
//| Verifies that BuildMatrix() produces a symmetric corr_matrix, that the |
//| diagonal comes out defined and equal to 1.0 for a symbol with genuine  |
//| variance, and that the mirrored cell matches the originally computed   |
//| cell exactly.                                                          |
//+------------------------------------------------------------------------+
void TestBuildMatrixSymmetryAndDiagonal(void)
  {
   CSymbolReturnSeries series[];
   ArrayResize(series, 2);
   series[0].m_symbol = "SYM1";
   double returns0[]  = {1.0, 2.0, 3.0, 4.0, 5.0};
   ArrayCopy(series[0].m_returns, returns0);
   series[0].m_count = ArraySize(returns0);

   series[1].m_symbol = "SYM2";
   double returns1[]  = {3.0, 5.0, 7.0, 9.0, 11.0}; // perfectly correlated with series[0]
   ArrayCopy(series[1].m_returns, returns1);
   series[1].m_count = ArraySize(returns1);

   CPearsonCorrelationCalculator calculator;
   CCorrelationMatrix corr_matrix;
   calculator.BuildMatrix(series, ArraySize(series), corr_matrix);

   ASSERT(corr_matrix.IsDefined(0, 1), "A pair of series with genuine variance must produce a defined correlation.");
   ASSERT(MathAbs(corr_matrix.GetValue(0, 1) - corr_matrix.GetValue(1, 0)) < 0.0001, "The corr_matrix must be symmetric across the diagonal.");
   ASSERT(corr_matrix.IsDefined(0, 0) && MathAbs(corr_matrix.GetValue(0, 0) - 1.0) < 0.0001, "A symbol with variance must correlate with itself at exactly 1.0.");
   ASSERT(corr_matrix.IsDefined(1, 1) && MathAbs(corr_matrix.GetValue(1, 1) - 1.0) < 0.0001, "The second symbol must also self-correlate at exactly 1.0.");
  }

//+-------------------------------------------------------------------------+
//| TestBuildMatrixUndefinedPair                                            |
//| Verifies that a symbol with zero-variance returns produces an undefined |
//| correlation both against itself and against a normal symbol, while the  |
//| normal symbol's own self-correlation remains defined.                   |
//+-------------------------------------------------------------------------+
void TestBuildMatrixUndefinedPair(void)
  {
   CSymbolReturnSeries series[];
   ArrayResize(series, 2);
   series[0].m_symbol = "FLAT";
   double flat_returns[] = {5.0, 5.0, 5.0};
   ArrayCopy(series[0].m_returns, flat_returns);
   series[0].m_count = ArraySize(flat_returns);

   series[1].m_symbol = "NORMAL";
   double normal_returns[] = {1.0, 2.0, 3.0};
   ArrayCopy(series[1].m_returns, normal_returns);
   series[1].m_count = ArraySize(normal_returns);

   CPearsonCorrelationCalculator calculator;
   CCorrelationMatrix corr_matrix;
   calculator.BuildMatrix(series, ArraySize(series), corr_matrix);

   ASSERT(!corr_matrix.IsDefined(0, 0), "A zero-variance symbol must be undefined even against itself.");
   ASSERT(!corr_matrix.IsDefined(0, 1), "A zero-variance symbol paired with a normal symbol must be undefined.");
   ASSERT(corr_matrix.IsDefined(1, 1), "The normal symbol must still self-correlate at a defined value.");
  }
OnStart() runs every test in sequence and prints the final pass and fail count. Nothing here touches a chart, an open position, or bar history; every input across every test is synthetic.
//+------------------------------------------------------------------------+
//| Script program start function                                          |
//+------------------------------------------------------------------------+
void OnStart(void)
  {
   g_assertion_passes   = 0;
   g_assertion_failures = 0;

   ::Print("Running TestCorrelationAnalytics...");

   TestComputeReturnsBasic();
   TestComputeReturnsInsufficientData();
   TestComputeReturnsZeroDivision();
   TestComputePairCorrelationPerfectPositive();
   TestComputePairCorrelationPerfectNegative();
   TestComputePairCorrelationZeroVariance();
   TestComputePairCorrelationInsufficientData();
   TestMatrixIndexBoundaries();
   TestBuildMatrixSymmetryAndDiagonal();
   TestBuildMatrixUndefinedPair();

   ::PrintFormat("TestCorrelationAnalytics complete: %d passed, %d failed.", g_assertion_passes, g_assertion_failures);
   if(g_assertion_failures == 0)
      ::Print("TEST SUITE PASSED");
   else
      ::Print("TEST SUITE FAILED");
  }
Extending the Dashboard
Weighting the window by recency: ComputePairCorrelation() currently treats every return in the window equally. An exponentially weighted variant that gives more influence to recent returns would make the matrix react faster to a genuine regime change, at the cost of more noise from any single outlier bar.
Filtering by magic number or account: CPositionSymbolCollector::Collect currently reads every open position on the account without distinction. Adding a magic-number filter would let a trader running several independent strategies on one account see the correlation exposure of just one strategy's own book.
Alerting instead of only printing: CCorrelationSummaryPrinter::Print already isolates every warning-threshold pair in one place. Routing that same information into SendNotification() or a sound alert would turn this project from something a trader has to be looking at into something that reaches them.
Persisting the matrix history: Neither CCorrelationMatrix nor the Expert Advisor currently keeps any record of past matrices. Writing each new matrix to a file alongside its timestamp, after BuildMatrix() runs, would let a trader later chart how a specific pair's correlation actually evolved over days or weeks, rather than only ever seeing its current value.
Ranking symbols before truncating: When the open-position count exceeds InpMaxSymbols, CPositionSymbolCollector currently keeps whichever symbols the terminal happens to enumerate first. Sorting candidates by open volume or absolute floating profit before truncating would make the kept symbols the ones that matter most to the account, rather than an arbitrary subset.
Limitations and Design Tradeoffs
The correlation window is anchored to bar closes on a single timeframe, InpTimeframe, measured against the chart the Expert Advisor is attached to, not against each monitored symbol individually. A pair that only starts moving together intraday, well before the next bar closes on the host chart, will not show up in the matrix until that bar finally closes, so this monitor trades some responsiveness for stability rather than trying to react to every tick within a bar. A monitored symbol that receives a new bar while the host chart has not yet received one of its own will still wait for the host chart's next bar or next tick before the matrix refreshes. Opening or closing a position is checked on every tick of the host chart, so it is normally picked up quickly, though the exact delay depends on how often the host chart itself ticks.
Because every genuine change triggers a full report, an account with frequent position turnover or a short InpTimeframe produces a correspondingly busy Experts tab. This follows directly from prioritizing prompt updates over a quiet log, and is expected behavior rather than an unintended side effect.
Every return series assumes its own symbol's bar-shift index lines up meaningfully with every other symbol's bar-shift index at the same position. That assumption holds well for symbols that share very similar trading sessions, most forex majors against each other, but it becomes weaker for symbols with materially different session calendars, a forex pair against an equity index or a commodity with its own separate trading hours, where "50 bars ago" on one symbol and "50 bars ago" on another do not necessarily correspond to the same real-world stretch of time.
This project reports correlation between symbols' returns, not correlation between the account's actual profit and loss streams. A trader with a long EURUSD position and a short GBPUSD position, for example, benefits from the positive correlation between those two symbols rather than being exposed to it, since a move that hurts one position helps the other. The heatmap has no way to see position direction or size, so a reader has to supply that context before deciding whether a warning border represents real concentration.
When the open-position symbol count exceeds InpMaxSymbols, the monitor keeps the first symbols returned by the position scan and drops the rest. The terminal does not guarantee that this order reflects exposure, risk, or any other analytically meaningful ranking; it simply reflects internal position storage order. A trader who regularly exceeds the limit may want to raise InpMaxSymbols rather than rely on the truncation, or extend the collector to rank positions by exposure before truncating.
The exact-zero-variance check that marks a pair as undefined relies on floating-point equality, the same category of edge case this project's other exact comparisons rely on. A symbol whose price barely moved across the window, rather than not moving at all, will not trigger this branch and will instead produce a defined but extremely noisy correlation figure, since a handful of tiny returns can produce a coefficient that swings wildly between one recalculation and the next. A minimum-variance threshold, rather than a strict zero check, would be a reasonable refinement for a genuinely quiet symbol.
Finally, and worth stating plainly: a warning border means two symbols have recently moved together or against each other with a strong, measurable pattern. It does not mean they are guaranteed to keep doing so, and it does not mean trading them together is a mistake. A strongly negative correlation between two positions held in opposite directions can reduce risk rather than add to it. Some strategies deliberately take correlated positions on purpose. This project's job is to make the pattern visible, not to judge it or to make the position-sizing decision for the trader.
Conclusion
What this comes down to is a simple loop, run over and over for as long as the Expert Advisor stays on the chart: look at what's actually open right now, pull recent price history for each of those symbols, work out how closely they've been moving together, and put that in front of the trader in a form they can read at a glance. Nothing about that loop is complicated on its own. CPositionSymbolCollector just deduplicates a list. CReturnSeriesReader just turns prices into percentage changes. CPearsonCorrelationCalculator runs a formula most traders learned once and forgot. The value is in doing all of it continuously, and in handling the edge cases, a flat symbol, a closed position, and a shrinking array—honestly rather than papering over them.
That last part turned out to matter more in practice than it might look on paper. A stale array left behind by a copy that only grows and never shrinks was enough to turn a working fix into a runaway log. Getting the analytics right and getting the plumbing right around them are genuinely two different jobs, and this project needed both.
What the heatmap actually gives a trader is a way to see co-movement that a position list hides. Four open positions can look like four independent bets or four versions of the same bet, and comparing how they have actually been moving is one useful way to tell the difference, alongside position size and direction, which this project does not evaluate. That's what this panel is for. It won't tell a trader whether a correlated position is a mistake. Plenty of the time it is not. But it puts the fact in front of them instead of leaving it buried in four separate, unremarkable-looking trades.
Programs used in the article:
| # | Name | Type | Description |
|---|---|---|---|
| 1 | CorrelationTypes.mqh | Include File | Defines CSymbolReturnSeries and CCorrelationMatrix, the return-series and flat-matrix data structures |
| 2 | PositionSymbolCollector.mqh | Include File | Defines CPositionSymbolCollector, which deduplicates the symbols of every open position |
| 3 | ReturnSeriesReader.mqh | Include File | Defines CReturnSeriesReader, which builds a bar-to-bar return series per symbol |
| 4 | PearsonCorrelationCalculator.mqh | Include File | Defines CPearsonCorrelationCalculator, which computes pairwise correlation and assembles the full matrix |
| 5 | CorrelationHeatmapChart.mqh | Include File | Defines CCorrelationHeatmapChart, which renders the live correlation heatmap using CCanvas |
| 6 | CorrelationSummaryPrinter.mqh | Include File | Defines CCorrelationSummaryPrinter, which prints warnings and the highest and lowest correlation to the Experts tab |
| 7 | SymbolCorrelationMonitor.mq5 | Expert Advisor | The main Expert Advisor that wires all components together and keeps the heatmap current |
| 8 | TestCorrelationAnalytics.mq5 | Script | A verification script that checks return computation, correlation arithmetic, and matrix indexing using synthetic data |
| 9 | SymbolCorrelationMonitor.zip | Zip Archive | Zip archive containing all the attached files and their paths relative to the terminal's root folder. |
Warning: All rights to these materials are reserved by MetaQuotes Ltd. Copying or reprinting of these materials in whole or in part is prohibited.
This article was written by a user of the site and reflects their personal views. MetaQuotes Ltd is not responsible for the accuracy of the information presented, nor for any consequences resulting from the use of the solutions, strategies or recommendations described.

 The Maximal Information Coefficient: Detecting Any Relationship, and the Null That Decides Whether It Is Real
 Price Action Analysis Toolkit Development (Part 82): Annotating Historical Bookmarks with Reliable Timeframe Switching
 MiniRocket: A Deterministic Time-Series Classifier and What It Finds in Seven Classic Setups
 Practical Modules from Other Languages in MQL5 (Part 08): MATPLOTLIB

- Free trading apps
- Over 8,000 signals for copying
- Economic news for exploring financial markets
You agree to website policy and terms of use