

Consecutive Loss Streak Analyzer and Risk-of-Ruin Calculator in MQL5
 137
137
 0
0

Introduction
Position sizing decisions usually start and end with average win rate. A trader may see a 45% win rate and choose a comfortable risk-per-trade percentage. Often, they never ask how likely a run of 5, 10, or 15 consecutive losses is. A losing streak like that is not a freak event. It is a predictable, quantifiable consequence of the win rate itself, and a large enough streak at a large enough risk-per-trade can breach a drawdown limit or wipe out an account outright.
This article builds a script that reads trade history and computes the empirical win rate, average win, and average loss. It then calculates losing-streak probabilities using the geometric distribution and risk of ruin at the current risk-per-trade using a standard win-rate/payoff formula. A CCanvas chart plots ruin probability against risk-per-trade, so a trader can see exactly how sharply that curve bends upward as position size grows.
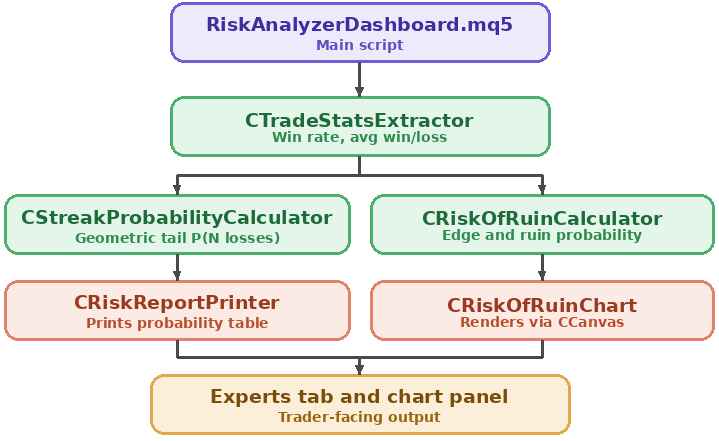
Consecutive loss streak and risk of ruin architecture
Section 1: RiskTypes.mqh — Trade Stats, Streaks, and Ruin Results
Three small structs carry the numbers through this pipeline. CTradeStats holds what gets measured directly from history: how many trades happened, how many won, the win rate, the average win and loss size, and the longest losing streak actually observed in the data. CStreakProbability pairs a streak length with its computed probability, one row for each length the trader asks about. CRiskOfRuinResult holds the three numbers a single risk-of-ruin calculation produces: the risk-per-trade percentage it was run at, the normalized edge that calculation is built on, and the resulting ruin probability.
//+------------------------------------------------------------------+
//|                                                    RiskTypes.mqh |
//+------------------------------------------------------------------+
#ifndef RISKTYPES_MQH
#define RISKTYPES_MQH

//+------------------------------------------------------------------+
//| CTradeStats                                                      |
//| Summary statistics measured from closed trade history: trade     |
//| count, win rate, average win and loss size, and the longest      |
//| losing streak actually observed.                                 |
//+------------------------------------------------------------------+
struct CTradeStats
  {
   int               trade_count;
   int               win_count;
   double            win_rate;
   double            avg_win;
   double            avg_loss;
   int               max_loss_streak;
  };

//+------------------------------------------------------------------+
//| CStreakProbability                                               |
//| One row of the streak probability table: a streak length and the |
//| computed probability of encountering at least that many losses   |
//| in a row.                                                        |
//+------------------------------------------------------------------+
struct CStreakProbability
  {
   int               streak_length;
   double            probability;
  };

//+------------------------------------------------------------------+
//| CRiskOfRuinResult                                                |
//| One risk-of-ruin calculation: the risk-per-trade percentage it   |
//| was run at, the normalized edge behind it, and the resulting     |
//| ruin probability.                                                |
//+------------------------------------------------------------------+
struct CRiskOfRuinResult
  {
   double            risk_percent;
   double            edge;
   double            ror;
  };

#endif // RISKTYPES_MQH
//+------------------------------------------------------------------+
Section 2: The Geometric Distribution and Consecutive Losses
Picture a sequence of trades, each one independently a win with probability p (the win rate) or a loss with probability q = 1 - p. Start counting losses from right now: how many will happen in a row before the next win breaks the streak? That count follows a geometric distribution, the same distribution that describes coin flips, dice rolls, or any sequence of independent yes-or-no trials repeated until the first success.
The geometric distribution has one property that makes this whole calculator possible: the probability of seeing at least N losses in a row, before that next win arrives, is simply q raised to the power of N. No trade history, no simulation, just one multiplication repeated N times.
| Term | Meaning | Formula |
|---|---|---|
| p | win rate | wins ÷ decided trades (wins + losses) |
| q | loss rate | 1 − p |
| P(streak ≥ N) | probability of at least N losses in a row | q^N |
A streak of 5 straight losses at a 40% win rate is not a rare accident. With q = 0.6, P(streak ≥ 5) = 0.6^5 ≈ 8.2%. Roughly one out of every twelve times a trader starts a fresh sequence of trades, they should expect to see five losses before the next win. This is a local, restart-from-now probability, not the probability of observing such a streak somewhere in a long future sample of trades. That number only gets more sobering as the streak length grows, but it shrinks fast: P(10) ≈ 0.67%, P(15) ≈ 0.055%. Longer streaks are exponentially rarer, but never impossible, and a trader who has personally lived through their account's worst historical streak already knows that "rare" and "never" are not the same word.
This probability describes one specific vantage point: starting the count right now, forward, until the next win. It is not the probability of seeing a streak that long at some point across the next M trades, which is a different and generally larger number requiring a separate calculation, described as a possible extension in Section 11. The same distinction applies to the historical-streak comparison printed to the Experts tab: it reports how likely a streak that long is when starting from an arbitrary point, not literally the odds of history repeating itself.
Section 3: CTradeStatsExtractor — Reading and Measuring Trade History
Getting from raw deal history to a trustworthy win rate and streak count means two separate jobs: pulling the deals out of the terminal, and doing the actual arithmetic on them in the right order. Splitting those into two methods, one that reads history and one that computes statistics from a plain array, makes the arithmetic directly testable without needing a live terminal connection to exercise it.
//+------------------------------------------------------------------+ //| TradeStatsExtractor.mqh | //+------------------------------------------------------------------+ #ifndef TRADESTATSEXTRACTOR_MQH #define TRADESTATSEXTRACTOR_MQH #include "RiskTypes.mqh" //+------------------------------------------------------------------+ //| CTradeStatsExtractor | //| Reads closed deal history for a date range, sorts it into | //| chronological order, and computes win rate, average win and | //| loss size, and the longest observed losing streak. | //+------------------------------------------------------------------+ class CTradeStatsExtractor { private: void SortByTime(datetime ×[], double &profits[], int count) const; public: CTradeStatsExtractor(void); ~CTradeStatsExtractor(void); int Read(datetime from, datetime to, CTradeStats &stats_out); int ComputeMaxLossStreak(const double &profits_in_order[], int count) const; void ComputeStats(const double &profits_in_order[], int count, CTradeStats &stats_out) const; }; //+------------------------------------------------------------------+ //| Constructor: no member state to initialize. | //+------------------------------------------------------------------+ CTradeStatsExtractor::CTradeStatsExtractor(void) { } //+------------------------------------------------------------------+ //| Destructor: no dynamic resources to release. | //+------------------------------------------------------------------+ CTradeStatsExtractor::~CTradeStatsExtractor(void) { }
Read() handles the terminal-facing work: it selects history, filters to closing deals, sorts them chronologically, and passes the resulting profit sequence to ComputeStats(). Order matters because a losing streak depends on sequence, not totals. Two accounts can share the same win rate yet have very different worst streaks if losses cluster differently over time.
//+------------------------------------------------------------------+
//| Read                                                             |
//+------------------------------------------------------------------+
int CTradeStatsExtractor::Read(datetime from, datetime to, CTradeStats &stats_out)
  {
//--- scope the terminal's history cache to the requested range
   if(!::HistorySelect(from, to))
     {
      ::Print("RiskAnalyzer: HistorySelect failed, error ", ::GetLastError());
      return(0);
     }
   int      total      = ::HistoryDealsTotal();
   datetime deal_times[];
   double   deal_profits[];
   ::ArrayResize(deal_times, total);
   ::ArrayResize(deal_profits, total);
   int      found      = 0;
   ulong    ticket     = 0;
   long     entry_type = 0;
   double   profit     = 0.0;
   double   swap       = 0.0;
   double   commission = 0.0;
   datetime close_time = 0;
//--- collect each closing deal's time and net profit
   for(int i = 0; i < total; i++)
     {
      ticket = ::HistoryDealGetTicket(i);
      if(ticket == 0)
         continue;
      entry_type = ::HistoryDealGetInteger(ticket, DEAL_ENTRY);
      if(entry_type != DEAL_ENTRY_OUT && entry_type != DEAL_ENTRY_INOUT)
         continue;
      profit     = ::HistoryDealGetDouble(ticket, DEAL_PROFIT);
      swap       = ::HistoryDealGetDouble(ticket, DEAL_SWAP);
      commission = ::HistoryDealGetDouble(ticket, DEAL_COMMISSION);
      close_time = (datetime)::HistoryDealGetInteger(ticket, DEAL_TIME);
      deal_times[found]   = close_time;
      deal_profits[found] = profit + swap + commission;
      found++;
     }
   ::ArrayResize(deal_times, found);
   ::ArrayResize(deal_profits, found);
//--- sort into chronological order, since streak length depends on sequence
   SortByTime(deal_times, deal_profits, found);
   ComputeStats(deal_profits, found, stats_out);
   return(found);
  }
SortByTime() sorts the two parallel arrays into ascending order by time using a simple bubble sort.
//+--------------------------------------------------------------------+ //| SortByTime | //+--------------------------------------------------------------------+ void CTradeStatsExtractor::SortByTime(datetime ×[], double &profits[], int count) const { datetime temp_time = 0; double temp_profit = 0.0; for(int i = 0; i < count - 1; i++) { for(int j = 0; j < count - 1 - i; j++) { if(times[j] > times[j + 1]) { temp_time = times[j]; times[j] = times[j + 1]; times[j + 1] = temp_time; temp_profit = profits[j]; profits[j] = profits[j + 1]; profits[j + 1] = temp_profit; } } } }
ComputeMaxLossStreak() is the smallest self-contained component in the dashboard. It walks the sequence once, tracks a running count of consecutive losses, and remembers the highest count seen. A breakeven trade (profit exactly zero) resets the running count to zero rather than extending it. A scratch trade is not a loss and should not merge two separate losing streaks into one.
//+------------------------------------------------------------------+
//| ComputeMaxLossStreak                                             |
//+------------------------------------------------------------------+
int CTradeStatsExtractor::ComputeMaxLossStreak(const double &profits_in_order[], int count) const
  {
   int current_streak = 0;
   int max_streak     = 0;
   for(int i = 0; i < count; i++)
     {
      if(profits_in_order[i] < 0.0)
        {
         current_streak++;
         if(current_streak > max_streak)
            max_streak = current_streak;
        }
      else
         current_streak = 0;
     }
   return(max_streak);
  }
ComputeStats() folds the same sequence into win rate and average win and loss size. A trade at exactly zero profit, a breakeven, counts toward the trade_count reported to the caller, but is excluded from every probability and average computed from the sequence: it sits in neither the win bucket nor the loss bucket, so it cannot distort avg_win or avg_loss, and win_rate itself is computed over decided (win or loss) trades only, so that 1 - win_rate is a genuine loss rate rather than one diluted by scratch trades. This keeps the loss rate used throughout the streak and risk-of-ruin formulas consistent with how ComputeMaxLossStreak() already treats a breakeven: an event that neither wins nor loses, and therefore breaks a losing streak the same way a win would.
//+------------------------------------------------------------------+
//| ComputeStats                                                     |
//+------------------------------------------------------------------+
void CTradeStatsExtractor::ComputeStats(const double &profits_in_order[], int count,
                                        CTradeStats &stats_out) const
  {
   int    win_count = 0;
   double win_sum   = 0.0;
   int    win_n     = 0;
   double loss_sum  = 0.0;
   int    loss_n    = 0;
   for(int i = 0; i < count; i++)
     {
      if(profits_in_order[i] > 0.0)
        {
         win_count++;
         win_sum += profits_in_order[i];
         win_n++;
        }
      else
         if(profits_in_order[i] < 0.0)
           {
            loss_sum += ::MathAbs(profits_in_order[i]);
            loss_n++;
           }
     }
//--- win rate is computed over decided (non-breakeven) trades only
   int decided_count = win_n + loss_n;
   stats_out.trade_count = count;
   stats_out.win_count   = win_count;
   stats_out.win_rate    = (decided_count > 0) ? (double)win_count / (double)decided_count : 0.0;
   stats_out.avg_win     = (win_n  > 0) ? win_sum  / win_n  : 0.0;
   stats_out.avg_loss    = (loss_n > 0) ? loss_sum / loss_n : 0.0;
   stats_out.max_loss_streak = ComputeMaxLossStreak(profits_in_order, count);
  }
Section 4: CStreakProbabilityCalculator — Applying the Formula
This class is a thin, deliberately simple wrapper around P(streak ≥ N) = q^N, the geometric distribution's tail formula from Section 2 above. Keeping it separate from the trade extractor means the probability math never has to know or care where the win rate came from; it works exactly the same whether that win rate came from real history or a number a trader typed in by hand to explore a hypothetical.
//+------------------------------------------------------------------+
//|                                 StreakProbabilityCalculator.mqh  |
//+------------------------------------------------------------------+
#ifndef STREAKPROBABILITYCALCULATOR_MQH
#define STREAKPROBABILITYCALCULATOR_MQH

#include "RiskTypes.mqh"

//+------------------------------------------------------------------+
//| CStreakProbabilityCalculator                                     |
//| Computes the probability of a losing streak of a given length,   |
//| using the geometric distribution's tail formula.                 |
//+------------------------------------------------------------------+
class CStreakProbabilityCalculator
  {
public:
                     CStreakProbabilityCalculator(void);
                    ~CStreakProbabilityCalculator(void);

   double                ComputeStreakProbability(double win_rate, int streak_length) const;
   int                   BuildProbabilityTable(double win_rate, const int &streak_lengths[],
         int count, CStreakProbability &table_out[]) const;
  };

//+------------------------------------------------------------------+
//| Constructor: no member state to initialize.                      |
//+------------------------------------------------------------------+
CStreakProbabilityCalculator::CStreakProbabilityCalculator(void)
  {
  }

//+------------------------------------------------------------------+
//| Destructor: no dynamic resources to release.                     |
//+------------------------------------------------------------------+
CStreakProbabilityCalculator::~CStreakProbabilityCalculator(void)
  {
  }

//+------------------------------------------------------------------+
//| ComputeStreakProbability                                         |
//| Returns the probability of at least streak_length consecutive    |
//| losses in a row, computed as the loss rate raised to that power. |
//+------------------------------------------------------------------+
double CStreakProbabilityCalculator::ComputeStreakProbability(double win_rate, int streak_length) const
  {
   if(streak_length <= 0)
      return(1.0);
//--- clamp an out-of-range win rate to a valid probability before using it
   double clamped_win_rate = win_rate;
   if(clamped_win_rate < 0.0)
      clamped_win_rate = 0.0;
   if(clamped_win_rate > 1.0)
      clamped_win_rate = 1.0;
   double loss_rate = 1.0 - clamped_win_rate;
   return(::MathPow(loss_rate, streak_length));
  }

//+------------------------------------------------------------------+
//| BuildProbabilityTable                                            |
//| Computes the streak probability for every requested streak       |
//| length and returns the number of rows populated.                 |
//+------------------------------------------------------------------+
int CStreakProbabilityCalculator::BuildProbabilityTable(double win_rate, const int &streak_lengths[],
      int count, CStreakProbability &table_out[]) const
  {
   ::ArrayResize(table_out, count);
   for(int i = 0; i < count; i++)
     {
      table_out[i].streak_length = streak_lengths[i];
      table_out[i].probability   = ComputeStreakProbability(win_rate, streak_lengths[i]);
     }
   return(count);
  }

#endif // STREAKPROBABILITYCALCULATOR_MQH
//+------------------------------------------------------------------+
Section 5: Risk of Ruin
Risk of ruin asks a harder, more consequential question than the streak calculator: not "how likely is a bad run," but "given this win rate, this payoff size, and this much risked per trade, what is the probability the account eventually gets wiped out entirely." The formula used here is a standard simplified approximation from trading risk literature, built on a normalized measure of edge and the number of "risk units" the account's capital represents.
| Term | Meaning | Formula |
|---|---|---|
| edge (A) | normalized advantage per trade, from −1 to 1 | (p·avg_win − q·avg_loss) ÷ (p·avg_win + q·avg_loss) |
| risk units (U) | how many full-loss trades in a row would wipe out the account | 100 ÷ risk_per_trade_percent |
| Risk of Ruin | probability of eventual ruin | ((1 − A) ÷ (1 + A))^U |
A positive edge means the base of that exponent, (1-A)/(1+A), is less than 1, so raising it to a larger power (a smaller risk-per-trade, meaning more risk units before ruin) drives the ruin probability toward zero. A larger risk-per-trade shrinks the number of risk units, which raises that same base to a smaller power, and the ruin probability climbs, slowly at first and then very sharply, exactly the curve this dashboard's chart is built to show.
One case requires explicit handling instead of relying on the raw formula. When edge is zero or negative, the system has no advantage. In that case the formula's base is ≥ 1.0, and raising it to a positive power yields a value ≥ 1.0, which cannot be a probability. A negative-edge system does not have some computed ruin chance between 99% and 105%; it has, for practical purposes, certain eventual ruin, so this dashboard clamps that case directly to 1.0 rather than reporting a number a probability can never actually be.
Section 6: CRiskOfRuinCalculator — Computing the Curve
Every number in Section 5's risk-of-ruin theory above collapses into two methods here. One turns a single risk-per-trade value into a single ruin probability; the other repeats that calculation across a whole range of values to trace a curve.
//+------------------------------------------------------------------+
//|                                        RiskOfRuinCalculator.mqh  |
//+------------------------------------------------------------------+
#ifndef RISKOFRUINCALCULATOR_MQH
#define RISKOFRUINCALCULATOR_MQH

#include "RiskTypes.mqh"

//+------------------------------------------------------------------+
//| CRiskOfRuinCalculator                                            |
//| Computes risk of ruin from win rate, average win and loss size,  |
//| and risk-per-trade percentage, and builds a curve of ruin        |
//| probability across a range of risk-per-trade values.             |
//+------------------------------------------------------------------+
class CRiskOfRuinCalculator
  {
public:
                     CRiskOfRuinCalculator(void);
                    ~CRiskOfRuinCalculator(void);

   bool                  Compute(double win_rate, double avg_win, double avg_loss,
                                 double risk_percent, CRiskOfRuinResult &result_out) const;
   int                   BuildCurve(double win_rate, double avg_win, double avg_loss,
                                    double risk_min, double risk_max, double step,
                                    CRiskOfRuinResult &curve_out[]) const;
  };

//+------------------------------------------------------------------+
//| Constructor: no member state to initialize.                      |
//+------------------------------------------------------------------+
CRiskOfRuinCalculator::CRiskOfRuinCalculator(void)
  {
  }

//+------------------------------------------------------------------+
//| Destructor: no dynamic resources to release.                     |
//+------------------------------------------------------------------+
CRiskOfRuinCalculator::~CRiskOfRuinCalculator(void)
  {
  }
Compute() implements RoR = ((1 − A) ÷ (1 + A))^U for one risk-per-trade value, where A is the normalized edge and U = 100 ÷ risk_per_trade_percent is the risk unit count, including the clamp that forces RoR = 1.0 whenever A ≤ 0.
//+------------------------------------------------------------------+
//| Compute                                                          |
//+------------------------------------------------------------------+
bool CRiskOfRuinCalculator::Compute(double win_rate, double avg_win, double avg_loss,
                                    double risk_percent, CRiskOfRuinResult &result_out) const
  {
   if(risk_percent <= 0.0)
      return(false);
   double loss_rate     = 1.0 - win_rate;
   double weighted_win  = win_rate  * avg_win;
   double weighted_loss = loss_rate * avg_loss;
   double denom         = weighted_win + weighted_loss;
//--- with no measurable win or loss size, there is nothing to compute an edge from
   if(denom <= 0.0)
     {
      result_out.risk_percent = risk_percent;
      result_out.edge         = 0.0;
      result_out.ror          = 1.0;
      return(true);
     }
   double edge = (weighted_win - weighted_loss) / denom;
   double units = 100.0 / risk_percent;
   double ror;
//--- a zero or negative edge has no valid formula result; treat it as certain ruin
   if(edge <= 0.0)
      ror = 1.0;
   else
     {
      double base = (1.0 - edge) / (1.0 + edge);
      ror = ::MathPow(base, units);
      if(ror > 1.0)
         ror = 1.0;
     }
   result_out.risk_percent = risk_percent;
   result_out.edge         = edge;
   result_out.ror          = ror;
   return(true);
  }
BuildCurve() calls Compute() once for every step between a minimum and maximum risk-per-trade value, which is exactly the sequence of points the chart needs to trace the curve.
//+------------------------------------------------------------------+
//| BuildCurve                                                       |
//+------------------------------------------------------------------+
int CRiskOfRuinCalculator::BuildCurve(double win_rate, double avg_win, double avg_loss,
                                      double risk_min, double risk_max, double step,
                                      CRiskOfRuinResult &curve_out[]) const
  {
   if(step <= 0.0 || risk_max < risk_min)
      return(0);
   int estimated = (int)((risk_max - risk_min) / step) + 2;
   ::ArrayResize(curve_out, estimated);
   int populated = 0;
   double r = risk_min;
   while(r <= risk_max + 0.0000001)
     {
      CRiskOfRuinResult point;
      if(Compute(win_rate, avg_win, avg_loss, r, point))
        {
         curve_out[populated] = point;
         populated++;
        }
      r += step;
     }
   ::ArrayResize(curve_out, populated);
   return(populated);
  }
Section 7: CRiskOfRuinChart — Rendering with CCanvas
A curve on its own only shows a relationship. It takes a second element, a marker showing exactly where the trader stands on that curve right now, to turn the picture into something personally useful rather than just theoretically interesting.
That is what this class draws. It plots the ruin probability curve computed by CRiskOfRuinCalculator::BuildCurve() as a connected line across the full risk-per-trade range, then overlays a single vertical line at the trader's actual current risk-per-trade setting, labeled with the exact ruin probability at that point. The curve by itself answers "how does ruin probability change with position size." The marker answers the question that actually matters day to day: "given how I'm sized right now, where do I sit on that curve."
//+------------------------------------------------------------------+
//|                                             RiskOfRuinChart.mqh  |
//+------------------------------------------------------------------+
#ifndef RISKOFRUINCHART_MQH
#define RISKOFRUINCHART_MQH

#include <Canvas\Canvas.mqh>
#include "RiskTypes.mqh"

//+------------------------------------------------------------------+
//| CRiskOfRuinChart                                                 |
//| Renders the risk-of-ruin curve as a connected line, with a       |
//| vertical marker at the trader's current risk-per-trade setting,  |
//| using a CCanvas panel.                                           |
//+------------------------------------------------------------------+
class CRiskOfRuinChart
  {
private:
   CCanvas               m_canvas;
   string                m_object_name;
   string                m_font_name;
   int                   m_font_size;
   uint                  m_font_flags;

public:
                     CRiskOfRuinChart(void);
                    ~CRiskOfRuinChart(void);

   bool                  Draw(const CRiskOfRuinResult &curve[], int count,
                              double current_risk_percent, double current_ror_value,
                              int x, int y, int width, int height);
   void                  Clear(void);
  };

//+------------------------------------------------------------------+
//| Constructor: assigns a fixed object name for the canvas panel.   |
//| This dashboard only ever creates one ruin curve panel, so a      |
//| single constant name is sufficient; running the script twice in  |
//| the same session reuses that name, which Clear() is written to   |
//| handle safely regardless of which instance created the original  |
//| panel.                                                           |
//+------------------------------------------------------------------+
CRiskOfRuinChart::CRiskOfRuinChart(void)
  {
   m_object_name = "RiskOfRuinPanel";
   m_font_name   = "Arial";
   m_font_size   = 12;
   m_font_flags  = FW_BOLD;
  }

//+------------------------------------------------------------------+
//| Destructor: intentionally does not remove the canvas panel. The  |
//| panel is a chart object owned by the chart itself, and must      |
//| remain visible after the CRiskOfRuinChart instance that drew it  |
//| goes out of scope at the end of a script's OnStart.              |
//+------------------------------------------------------------------+
CRiskOfRuinChart::~CRiskOfRuinChart(void)
  {
  }

//+------------------------------------------------------------------+
//| Draw                                                             |
//| Plots the ruin probability curve as a connected line across the  |
//| risk-per-trade range, then overlays a vertical marker line at    |
//| current_risk_percent labeled with the caller's own already-      |
//| computed ruin probability for that exact percentage.             |
//+------------------------------------------------------------------+
bool CRiskOfRuinChart::Draw(const CRiskOfRuinResult &curve[], int count,
                            double current_risk_percent, double current_ror_value,
                            int x, int y, int width, int height)
  {
   Clear();
   if(!m_canvas.CreateBitmapLabel(m_object_name, x, y, width, height, COLOR_FORMAT_ARGB_NORMALIZE))
     {
      ::Print("RiskAnalyzer: CreateBitmapLabel failed, error ", ::GetLastError());
      return(false);
     }
   m_canvas.FontSet(m_font_name, m_font_size, m_font_flags);
   ::TextSetFont(m_font_name, m_font_size, m_font_flags);
   m_canvas.Erase(::ColorToARGB(clrWhiteSmoke, 255));
   if(count < 2)
     {
      m_canvas.Update();
      return(true);
     }
//--- the risk-per-trade range is taken directly from the curve's own bounds
   double risk_min = curve[0].risk_percent;
   double risk_max = curve[count - 1].risk_percent;
   double risk_range = risk_max - risk_min;
   if(risk_range <= 0.0)
      risk_range = 1.0;
//--- finds the ruin probability range, always anchored at zero for readability
   double ror_max = 0.0;
   for(int i = 0; i < count; i++)
      if(curve[i].ror > ror_max)
         ror_max = curve[i].ror;
   if(ror_max <= 0.0)
      ror_max = 1.0;
   int plot_left   = 50;
   int plot_right  = width - 10;
   int plot_top    = 30;
   int plot_bottom = height - 20;
//--- draws the ruin probability curve as a series of connected segments
   int prev_x = 0;
   int prev_y = 0;
   for(int i = 0; i < count; i++)
     {
      int px = plot_left + (int)(((curve[i].risk_percent - risk_min) / risk_range) * (plot_right - plot_left));
      int py = plot_bottom - (int)((curve[i].ror / ror_max) * (plot_bottom - plot_top));
      if(i > 0)
         m_canvas.Line(prev_x, prev_y, px, py, ::ColorToARGB(clrDarkSlateBlue, 255));
      prev_x = px;
      prev_y = py;
     }
//--- overlay a vertical marker at the exact current risk-per-trade setting.
//--- current_ror_value is the caller's own already-computed result for this
//--- exact percentage, not a lookup against the sampled curve, so the
//--- labeled figure is genuinely exact rather than an approximation from
//--- the nearest sampled point
   int marker_x = plot_left + (int)(((current_risk_percent - risk_min) / risk_range) * (plot_right - plot_left));
//--- clamp the marker inside the plotted area; a risk percentage outside
//--- the sampled range would otherwise draw off the edge of the panel
   if(marker_x < plot_left)
      marker_x = plot_left;
   if(marker_x > plot_right)
      marker_x = plot_right;
   m_canvas.LineVertical(marker_x, plot_top, plot_bottom, ::ColorToARGB(clrCrimson, 255));
   string marker_text = "Current: " + ::DoubleToString(current_risk_percent, 1) + "%  RoR " +
                        ::DoubleToString(current_ror_value * 100.0, 3) + "%";
   m_canvas.TextOut(marker_x + 6, plot_top, marker_text, ::ColorToARGB(clrCrimson, 255));
   m_canvas.Update();
   return(true);
  }

//+------------------------------------------------------------------+
//| Clear                                                            |
//| Removes any chart object with this name, whether or not this     |
//| specific instance was the one that created it. A freshly         |
//| constructed instance has no memory of a panel left behind by an  |
//| earlier run of the script under the same object name, so deletion|
//| is attempted unconditionally by name rather than gated on        |
//| instance-local state.                                            |
//+------------------------------------------------------------------+
void CRiskOfRuinChart::Clear(void)
  {
   ::ObjectDelete(0, m_object_name);
  }

#endif // RISKOFRUINCHART_MQH
//+------------------------------------------------------------------+
Section 8: CRiskReportPrinter — Experts Tab Summary
The chart shows the shape of the risk curve, but a trader who wants exact numbers to write down needs a plain-text table. This printer covers three things: the streak probability table itself, the account's own historical worst streak alongside the probability of it happening again, and the current risk-of-ruin figure.
//+------------------------------------------------------------------+ //| RiskReportPrinter.mqh | //+------------------------------------------------------------------+ #ifndef RISKREPORTPRINTER_MQH #define RISKREPORTPRINTER_MQH #include "RiskTypes.mqh" //+------------------------------------------------------------------+ //| CRiskReportPrinter | //| Prints the streak probability table, the historical worst streak | //| with its own probability, and the current risk-of-ruin figure | //| to the Experts tab. | //+------------------------------------------------------------------+ class CRiskReportPrinter { private: string PadRight(string value, int width) const; public: CRiskReportPrinter(void); ~CRiskReportPrinter(void); void Print(const CTradeStats &stats, const CStreakProbability &table[], int table_count, double historical_streak_probability, const CRiskOfRuinResult ¤t_ror) const; }; //+------------------------------------------------------------------+ //| Constructor: no member state to initialize. | //+------------------------------------------------------------------+ CRiskReportPrinter::CRiskReportPrinter(void) { } //+------------------------------------------------------------------+ //| Destructor: no dynamic resources to release. | //+------------------------------------------------------------------+ CRiskReportPrinter::~CRiskReportPrinter(void) { } //+------------------------------------------------------------------+ //| Print | //| Prints trade statistics, the streak probability table, the | //| account's own historical worst streak and its probability, and | //| the current risk-of-ruin figure. | //+------------------------------------------------------------------+ void CRiskReportPrinter::Print(const CTradeStats &stats, const CStreakProbability &table[], int table_count, double historical_streak_probability, const CRiskOfRuinResult ¤t_ror) const { ::PrintFormat("RiskAnalyzer: %d trades, win rate %.1f%%, avg win %.2f, avg loss %.2f", stats.trade_count, stats.win_rate * 100.0, stats.avg_win, stats.avg_loss); //--- print the streak probability table string header = PadRight("Streak", 10) + PadRight("Probability", 14); ::Print(header); for(int i = 0; i < table_count; i++) { string row = PadRight(::IntegerToString(table[i].streak_length), 10) + PadRight(::DoubleToString(table[i].probability * 100.0, 3) + "%", 14); ::Print(row); } //--- put the account's own worst streak in the same probability context ::PrintFormat("RiskAnalyzer: historical worst streak was %d losses (P = %.3f%%)", stats.max_loss_streak, historical_streak_probability * 100.0); //--- print the current risk-of-ruin figure ::PrintFormat("RiskAnalyzer: at %.1f%% risk-per-trade, edge %.4f, risk of ruin %.4f%%", current_ror.risk_percent, current_ror.edge, current_ror.ror * 100.0); } //+------------------------------------------------------------------+ //| PadRight | //| Pads a string with trailing spaces up to the given width, or | //| returns the original string unchanged if it already meets or | //| exceeds that width. | //+------------------------------------------------------------------+ string CRiskReportPrinter::PadRight(string value, int width) const { int need = width - ::StringLen(value); if(need <= 0) return(value); string result = value; for(int i = 0; i < need; i++) result += " "; return(result); } #endif // RISKREPORTPRINTER_MQH //+------------------------------------------------------------------+
Section 9: RiskAnalyzerDashboard.mq5 — Assembling the Main Script
Every class built so far does one job well in isolation. This script is where they finally meet: it wires the extractor, both calculators, the chart, and the printer into a single run that turns raw trade history into a finished report.
The inputs cover exactly what a trader needs to control and nothing more: the lookback window to pull history from, the risk-per-trade percentage currently in use, and the position and size of the ruin curve panel on the chart. Streak lengths are not exposed as an input at all; they are fixed at 5, 10, 15, and 20 losses, the round numbers a trader naturally reaches for when thinking about a bad run, rather than a setting someone would realistically want to change on every run.//+------------------------------------------------------------------+ //| RiskAnalyzerDashboard.mq5 | //+------------------------------------------------------------------+ #property script_show_inputs #include <RiskAnalyzer/RiskTypes.mqh> #include <RiskAnalyzer/TradeStatsExtractor.mqh> #include <RiskAnalyzer/StreakProbabilityCalculator.mqh> #include <RiskAnalyzer/RiskOfRuinCalculator.mqh> #include <RiskAnalyzer/RiskOfRuinChart.mqh> #include <RiskAnalyzer/RiskReportPrinter.mqh> input int InpLookbackDays = 180; // Number of days to look back from now input double InpRiskPercent = 2.0; // Current risk-per-trade, as a percentage input int InpPanelX = 20; // Canvas panel X coordinate input int InpPanelY = 20; // Canvas panel Y coordinate input int InpPanelWidth = 640; // Canvas panel width in pixels input int InpPanelHeight = 260; // Canvas panel height in pixels
OnStart() reads trade statistics, builds the streak probability table, computes the account's own historical streak in that same probability context, then computes and charts the ruin curve.
//+------------------------------------------------------------------+
//| OnStart                                                          |
//+------------------------------------------------------------------+
void OnStart(void)
  {
//--- resolve the date range from the lookback input
   datetime to_time   = ::TimeCurrent();
   datetime from_time = to_time - (InpLookbackDays * 86400);
//--- read trade statistics from closed deal history
   CTradeStatsExtractor extractor;
   CTradeStats          stats;
   int                  trade_count = extractor.Read(from_time, to_time, stats);
   if(trade_count < 2)
     {
      ::Print("RiskAnalyzer: not enough trades to compute meaningful statistics");
      return;
     }
//--- build the streak probability table for the standard reference lengths
   CStreakProbabilityCalculator streak_calc;
   int                          streak_lengths[4] = {5, 10, 15, 20};
   CStreakProbability           table[];
   int table_count = streak_calc.BuildProbabilityTable(stats.win_rate, streak_lengths, 4, table);
//--- put the account's own worst streak in the same probability context
   double historical_probability = streak_calc.ComputeStreakProbability(stats.win_rate, stats.max_loss_streak);
//--- compute risk of ruin at the current risk setting and across the full curve
   CRiskOfRuinCalculator ror_calc;
   CRiskOfRuinResult     current_ror;
   if(!ror_calc.Compute(stats.win_rate, stats.avg_win, stats.avg_loss, InpRiskPercent, current_ror))
     {
      ::Print("RiskAnalyzer: could not compute risk of ruin; InpRiskPercent must be greater than zero");
      return;
     }
   CRiskOfRuinResult curve[];
   int curve_count = ror_calc.BuildCurve(stats.win_rate, stats.avg_win, stats.avg_loss, 0.5, 20.0, 0.5, curve);
//--- render the ruin curve chart, passing the exact already-computed ruin
//--- value at the current setting rather than letting the chart approximate
//--- it from the nearest sampled point on the curve
   CRiskOfRuinChart chart;
   chart.Draw(curve, curve_count, InpRiskPercent, current_ror.ror,
              InpPanelX, InpPanelY, InpPanelWidth, InpPanelHeight);
//--- print the full report to the Experts tab
   CRiskReportPrinter printer;
   printer.Print(stats, table, table_count, historical_probability, current_ror);
  }
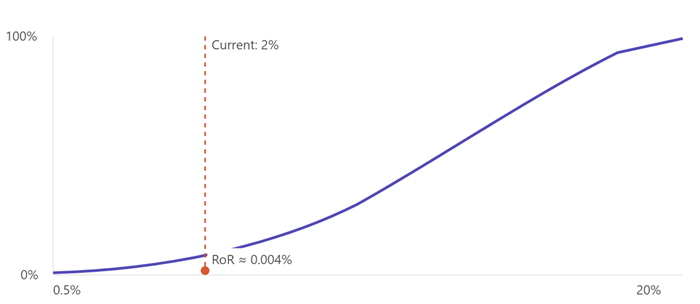
Risk of ruin vs. risk-per-trade curve. Ruin probability climbs slowly at first, then accelerates sharply as risk-per-trade grows, exactly the pattern this dashboard is built to make visible. The solid vertical marker shows where the trader's current setting sits on that curve.
Section 10: Verification — TestRiskAnalytics.mq5
The verification script builds a fixed 13-trade sequence containing a breakeven trade and two separate losing runs, one broken by the breakeven and one that becomes the account's longest streak, then checks every downstream calculation against numbers worked out by hand.
//+------------------------------------------------------------------+
//|                                            TestRiskAnalytics.mq5 |
//+------------------------------------------------------------------+

#include <RiskAnalyzer/RiskTypes.mqh>
#include <RiskAnalyzer/TradeStatsExtractor.mqh>
#include <RiskAnalyzer/StreakProbabilityCalculator.mqh>
#include <RiskAnalyzer/RiskOfRuinCalculator.mqh>

#define ASSERT(condition, message) TestAssert((condition), (message))

int g_pass_count = 0;
int g_fail_count = 0;

//+------------------------------------------------------------------+
//| TestAssert                                                       |
//| Prints a pass or fail message for a single test condition and    |
//| tracks the running pass and fail counts.                         |
//+------------------------------------------------------------------+
void TestAssert(bool condition, string message)
  {
   if(condition)
     {
      g_pass_count++;
      ::Print("PASS: ", message);
     }
   else
     {
      g_fail_count++;
      ::Print("FAIL: ", message);
     }
  }

//+------------------------------------------------------------------+
//| OnStart                                                          |
//| Checks the max-loss-streak walk, the win rate and average win    |
//| and loss size, the geometric streak probability formula, and the |
//| risk-of-ruin formula including its negative-edge clamp, all      |
//| against hand-worked values.                                      |
//+------------------------------------------------------------------+
void OnStart(void)
  {
//--- a 13-trade sequence: two win-break bookends, a breakeven that
//--- resets a 3-loss run, and a 4-loss run that becomes the max streak
   double profits[13] = {50, -20, -30, -10, 0, -15, -25, 40, -5, -5, -5, -5, 100};
   CTradeStatsExtractor extractor;
//--- test 1: the max loss streak should be 4, not 7 (the breakeven must break the chain)
   int max_streak = extractor.ComputeMaxLossStreak(profits, 13);
   ASSERT(max_streak == 4, "max loss streak computes to 4, correctly broken by the breakeven trade");
//--- tests 2-5: win rate, average win, average loss, and the streak figure via ComputeStats
   CTradeStats stats;
   extractor.ComputeStats(profits, 13, stats);
   ASSERT(stats.trade_count == 13 && stats.win_count == 3,
          "13 trades produce 3 wins");
   ASSERT(::MathAbs(stats.win_rate - (3.0 / 12.0)) < 0.0001,
          "win rate computes to 3/12, computed over decided trades only");
   ASSERT(::MathAbs(stats.avg_win - (190.0 / 3.0)) < 0.001,
          "average win computes to 190/3");
   ASSERT(::MathAbs(stats.avg_loss - (120.0 / 9.0)) < 0.001,
          "average loss computes to 120/9");
//--- tests 6-7: the geometric streak probability formula at clean values
   CStreakProbabilityCalculator streak_calc;
   double p5  = streak_calc.ComputeStreakProbability(0.5, 5);
   double p10 = streak_calc.ComputeStreakProbability(0.5, 10);
   ASSERT(::MathAbs(p5  - 0.03125) < 0.000001,     "P(5 losses) at 50% win rate computes to 0.03125");
   ASSERT(::MathAbs(p10 - 0.0009765625) < 0.0000001, "P(10 losses) at 50% win rate computes to 0.0009765625");
//--- test 8 and 9: an out-of-range win rate is clamped rather than
//--- producing a meaningless probability outside 0 and 1
   double p_over  = streak_calc.ComputeStreakProbability(1.5, 5);
   double p_under = streak_calc.ComputeStreakProbability(-0.5, 5);
   ASSERT(::MathAbs(p_over - 0.0) < 0.0000001,
          "a win rate above 1.0 clamps to 1.0, giving a 0.0 streak probability");
   ASSERT(::MathAbs(p_under - 1.0) < 0.0000001,
          "a win rate below 0.0 clamps to 0.0, giving a 1.0 streak probability");
//--- tests 10-11: risk of ruin rises as risk-per-trade increases, at a known positive edge
   CRiskOfRuinCalculator ror_calc;
   CRiskOfRuinResult ror_low, ror_high;
   ror_calc.Compute(0.45, 150.0, 100.0, 2.0, ror_low);
   ror_calc.Compute(0.45, 150.0, 100.0, 10.0, ror_high);
   ASSERT(::MathAbs(ror_low.edge - 0.102041) < 0.0001,
          "edge at 45% win rate, 150/100 payoff computes to about 0.1020");
   ASSERT(ror_high.ror > ror_low.ror,
          "risk of ruin at 10% risk-per-trade is higher than at 2%");
//--- test 12: a zero or negative edge clamps risk of ruin to exactly 1.0
   CRiskOfRuinResult ror_negative;
   ror_calc.Compute(0.40, 100.0, 100.0, 2.0, ror_negative);
   ASSERT(::MathAbs(ror_negative.ror - 1.0) < 0.0000001,
          "risk of ruin clamps to 1.0 for a negative-edge system");
//--- print the final summary of pass and fail counts
   ::Print("TestRiskAnalytics: ", g_pass_count, " passed, ", g_fail_count, " failed");
  }
//+------------------------------------------------------------------+
Section 11: Extending the Dashboard
A trader who wants a forward-looking rather than backward-looking view could extend CStreakProbabilityCalculator with a method that answers a different question: not "what is the probability of at least N losses starting right now," which is already what ComputeStreakProbability() answers, but "over the next M trades, how likely is a streak of N or more to appear at least once." That version needs a more involved recursive formula rather than the single-line geometric tail used here, since overlapping possible streak positions within M trades are not independent of each other.
A position-sizing recommendation could work backward from a target maximum acceptable risk of ruin. Given a win rate and payoff size, CRiskOfRuinCalculator::BuildCurve() already produces the whole curve; a trader could scan it for the largest risk-per-trade value whose ruin probability stays under some chosen threshold, like 1%, and use that as a data-driven position size rather than a number chosen by feel.
Exporting the streak table and the ruin curve to CSV would let a trader compare risk profiles across several strategies side by side in a spreadsheet, following the same FileOpen(), FileWrite(), FileClose() pattern used elsewhere in this kind of dashboard.
A rolling-window version could recompute win rate and payoff size over just the most recent N trades, showing whether a strategy's risk profile has been drifting as market conditions or the trader's own execution has changed over time.
Section 12: Limitations
The geometric streak formula assumes every trade is an independent event with the same win probability. Real trading strategies often violate this: a losing trade can change a trader's behavior on the next one, market regimes shift the underlying win rate over time, and correlated trades on the same symbol are not truly independent draws. The probability table this dashboard prints describes an idealized model, not a guarantee about what the account will actually do next.
The risk-of-ruin formula uses only the average win and average loss size. It has no way to see the shape of the distribution around those averages: heavy-tailed losses, skewed payoffs, or serial correlation between consecutive trades can all make the real risk of ruin higher than this formula reports, even when the average figures themselves are accurate.
The risk-of-ruin formula assumes a fixed percentage risked per trade, calculated against the account's starting capital rather than its current, possibly shrinking or growing, balance. A trader who reduces position size as the account draws down will see a lower real risk of ruin than this formula reports, since the formula has no way to represent that adaptive behavior.
Average win and average loss are raw account-currency figures, not normalized by position size, risk-per-trade, or account balance. A strategy that varies its position size across trades will have its edge and risk-of-ruin figures partly reflect that size variation, rather than pure win-or-lose behavior.
Both calculators depend entirely on the win rate, average win, and average loss measured from historical trades. A short history produces confident-looking numbers built on a shaky foundation, and a history with no losing trades at all drives the average loss to zero, pushing the computed edge toward its maximum and the risk of ruin toward zero, an artifact of too small a sample rather than genuine safety.
This dashboard measures deals (DEAL_ENTRY_OUT and DEAL_ENTRY_INOUT), not logical trades or completed positions. A position closed through several partial fills produces several separate points here, each counted as its own win or loss, which can inflate the trade count and distort the win rate and the streak walk relative to a definition of "trade" based on one complete position.
Swap and commission are read only from each trade's closing deal. A broker that charges commission on the opening deal instead of, or in addition to, the closing deal will have that portion of the cost excluded from the net profit figure computed here.
A win rate or edge computed from one account's history is not a stable constant; it is a historical average carried forward as if it were a fixed future probability, with no adjustment for the statistical uncertainty in a limited sample.
"Certain eventual ruin" for a zero-or-negative-edge system describes an infinite-horizon, repeated-game model. It does not mean a real account is guaranteed to be wiped out within any specific stretch of calendar time, and the model has no concept of broker margin calls, forced stop-outs, or a finite trading horizon, all of which shape what actually happens to a real account long before an idealized infinite series would.
The risk-of-ruin curve is sampled at fixed steps across a fixed range, 0.5% to 20% risk-per-trade in 0.5% increments, rather than dynamically covering whatever range suits a specific trader's situation. A current setting outside that range is drawn pinned to the nearest edge of the panel rather than at its true position.
The chart does not validate InpPanelWidth or InpPanelHeight. A panel set too small can produce a squeezed or overlapping layout, since the drawing math assumes enough room for the axis margins and the footer.
Passing every test in the verification suite confirms that the code correctly implements the stated formulas on the cases it checks. It does not test Read()'s history-reading logic, the chart's rendering, the terminal-log printer, or the dashboard's behavior on an invalid InpRiskPercent or an empty trade history, and it does not validate that the underlying financial assumptions match how a real account behaves.
Conclusion
A standard backtest report ends with a maximum historical drawdown and a maximum historical losing streak, two numbers presented as facts about the past with nothing to say about the future. This dashboard was built to close that gap. It takes the same trade history and turns it into two forward-looking questions a report alone can never answer: how likely is a streak this bad, or worse, to happen again, and at the position size actually in use, what this simplified model estimates as the probability of losing the account entirely.
Getting there took three structs to carry the numbers, a trade statistics extractor with a chronology-aware streak walk that correctly lets a breakeven trade close out a losing run rather than silently extending it, a probability calculator built on the geometric distribution's tail formula, and a risk-of-ruin calculator with an explicit clamp for the case no textbook formula handles gracefully: a system with no real edge at all. A CCanvas chart traces the ruin curve with the trader's own risk setting marked directly on it, and an Experts tab report ties every number together in one place. A verification script confirmed the core formulas, the breakeven-aware streak logic, the win rate and payoff calculations, the geometric formula at clean values, and the risk-of-ruin formula's behavior both as risk climbs and at a negative edge.
What this dashboard cannot do is just as important as what it can. Every formula here assumes trades are independent events with a stable win rate, an assumption a martingale or grid-style strategy can violate badly enough to make its Risk of Ruin figure actively misleading rather than merely approximate. It also has no concept of adaptive position sizing as an account's balance moves, and no way to warn a trader when their historical sample is too thin to trust. A trader who needs any of that will have to extend the classes described in Section 11, but even without those extensions, this dashboard already answers a question every backtest report leaves unasked.
Programs used in the article:
| # | Name | Type | Description |
|---|---|---|---|
| 1 | RiskTypes.mqh | Include File | Defines the CTradeStats, CStreakProbability, and CRiskOfRuinResult structs |
| 2 | TradeStatsExtractor.mqh | Include File | CTradeStatsExtractor class: reads history and computes win rate, payoff size, and the longest observed losing streak |
| 3 | StreakProbabilityCalculator.mqh | Include File | CStreakProbabilityCalculator class: computes losing streak probability using the geometric distribution |
| 4 | RiskOfRuinCalculator.mqh | Include File | CRiskOfRuinCalculator class: computes risk of ruin and builds the ruin probability curve |
| 5 | RiskOfRuinChart.mqh | Include File | CRiskOfRuinChart class: renders the ruin curve with the current risk setting marked, via CCanvas |
| 6 | RiskReportPrinter.mqh | Include File | CRiskReportPrinter class: prints the streak table and risk-of-ruin summary to the Experts tab |
| 7 | RiskAnalyzerDashboard.mq5 | Script | Main script: wires all components, reads trade stats, computes both risk measures, and renders |
| 8 | TestRiskAnalytics.mq5 | Script | Verification script covering the streak walk, trade statistics, streak probability, and risk of ruin |
| 9 | RiskAnalyzer.zip | Zip Archive | Zip archive containing all the attached files and their paths relative to the terminal's root folder. |
Warning: All rights to these materials are reserved by MetaQuotes Ltd. Copying or reprinting of these materials in whole or in part is prohibited.
This article was written by a user of the site and reflects their personal views. MetaQuotes Ltd is not responsible for the accuracy of the information presented, nor for any consequences resulting from the use of the solutions, strategies or recommendations described.

 Meta-Labeling the Classics (Part 4): Filtering and Sizing MACD Trades
 The Deflated Sharpe Ratio in MQL5: Telling a Real Edge from a Lucky Backtest
 Developing Smart Chart Objects in MQL5 (Part 2): Automating Trendline Discovery and Lifecycle Management
 Swing Extremes and Pullbacks (Part 5): Filtering Weak Swings Using Candle Imbalance

- Free trading apps
- Over 8,000 signals for copying
- Economic news for exploring financial markets
You agree to website policy and terms of use